CIFR: BC Retest Complete โ Are We Heading to Point C?Underpinning the bullish technical bounce at the BC zone is Cipherโs aggressive transformation from a pure-play Bitcoin miner into a high-performance computing (HPC) and AI data center provider. The company has secured over $11.4 billion in contracted revenue through long-term leases with major hyperscalers, including landmark 10-to-15-year hosting agreements backed by Google/Fluidstack and Amazon Web Services (AWS). This transition provides high-margin, predictable cash flows that significantly de-risk the company's macro growth outlook compared to pure crypto mining volatility.
Cipherโs development pipeline is heavily supported by institutional debt markets rather than aggressive equity dilution. Recent major capital milestonesโincluding an $810 million senior secured notes offering for its Stingray facility and a $200 million revolving credit facility supported by global banksโensure primary gigawatt-scale data center builds like Barber Lake and Black Pearl remain on track to go operational through late 2026.
Wall Street institutional consensus strongly aligns with the chart's $52โ$62 macro expansion target for Point (C). Major investment firms like Morgan Stanley hold price targets near $47โ$48.50, with multi-year fundamental valuation models pointing toward $50 to $80 as contracted hyperscaler revenue ramps up into 2027. This fundamental backing provides the institutional tailwind needed for a breakout above $30 to follow through toward the Point (C) target box.
Fibonacci
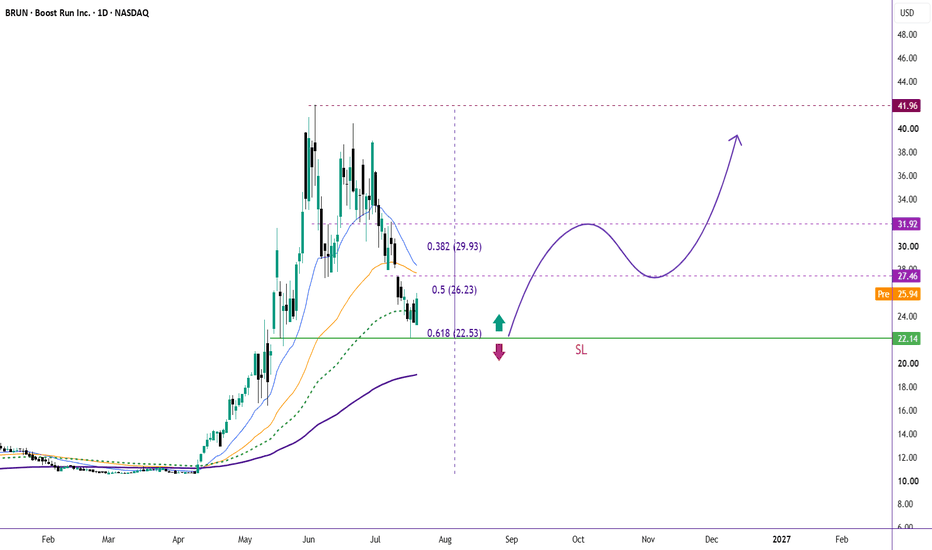
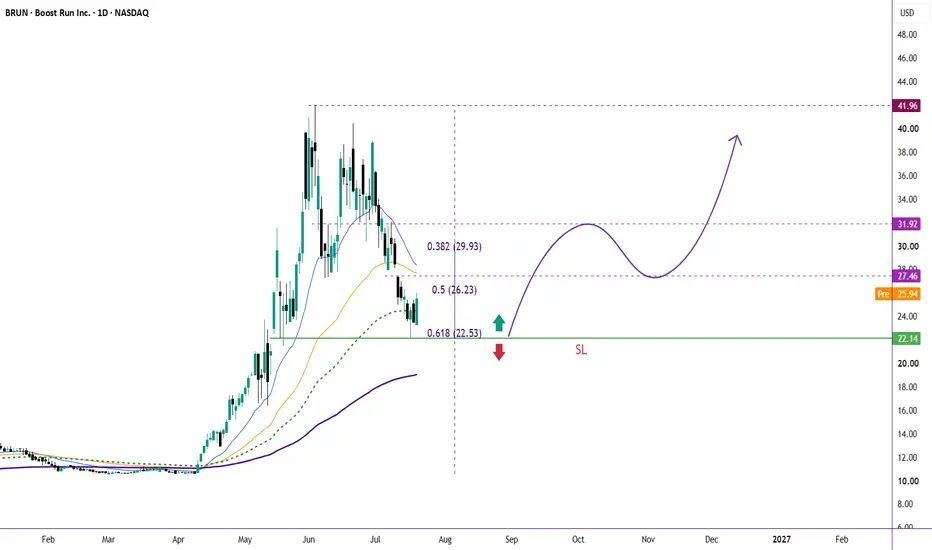
BRUN: Golden Pocket Rebound or More Pain Ahead?Another chart. Another story.
BRUN has delivered an impressive rally from around $10 to a high near $42, rewarding trend followers with a massive move. As expected after such an explosive run, the stock entered a healthy correction phase.
The interesting part? That correction has now reached a high-confluence support zone.
๐ The Story
After the rally, BRUN has retraced into the Fibonacci Golden Pocket (0.5โ0.618), with the 0.618 level near $22.5 aligning almost perfectly with horizontal support around $22.1.
At this key level, buyers stepped in aggressively, printing a Bullish Engulfing candleโoften an early sign that demand is returning after a pullback.
This is exactly the type of price action swing traders like to see:
๐ข Healthy retracement into the Golden Pocket
๐ข Strong horizontal support
๐ข Bullish Engulfing candle at support
๐ข Favorable risk-to-reward if support holds
While no setup is guaranteed, the odds now favor a relief rally as long as this support remains intact.
๐ฏ Bullish Targets
๐ฏ $27.5 โ First resistance (0.5 Fib)
๐ฏ $30.0 โ 0.382 Fib resistance
๐ฏ $32.0 โ Major resistance
๐ $42.0 โ Previous swing high
A decisive break above these levels could put BRUN back on track to retest its highs.
โ Invalidation
A daily close below $22.1 would invalidate this bullish thesis and suggest the correction isn't over yet.
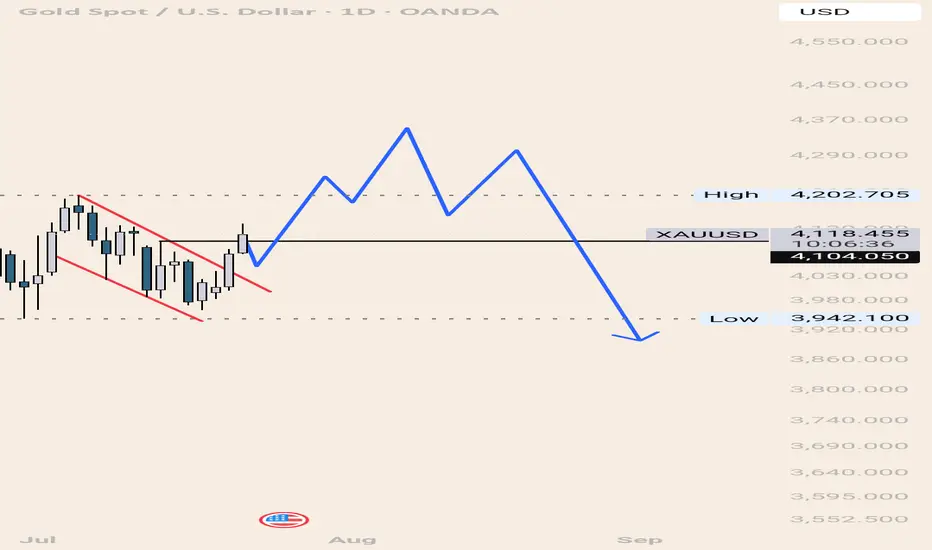
XAUUSD Roadmap: The Road to 4350 and the Long-Term ReversalGold Update
โAfter breaking 4104 and holding above it with an 8-hour candle:
โGold targets 4243 first.
โThen 4350 as a final and highly important level.
โAfter that, I see it resuming its decline below 4000.
โAs shown by the blue line.
โNote: This is on the daily timeframe, meaning it will take a long time for this scenario to play out.
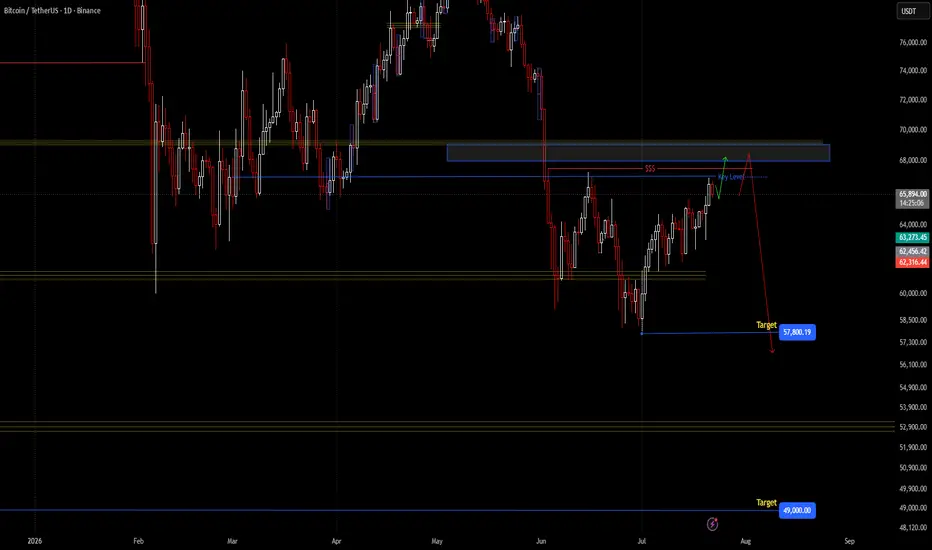
BTCBTC/USDT
Bias:
Shortโterm: Bullish momentum likely to continue, with potential for a push higher before resistance.
Mediumโterm (Swing): Anticipated bearish reversal once shortโterm strength exhausts, setting up a swingโtrade opportunity.
Phase 1 โ ShortโTerm Bullishness
Look for continuation signals such as strong candles, volume confirmation, or momentum indicators turning positive.
Consider entering long positions for the shortโterm move.
Manage risk with tight stops to avoid being caught in sudden reversals.
Exit once signs of exhaustion or rejection appear.
Phase 2 โ Swing Bearishness
Watch for rejection patterns, weakening momentum, or bearish divergence.
Enter short positions once confirmation of reversal is seen.
Swing targets can be managed by scaling out gradually as the move develops.
Use wider stops to account for volatility in swing trades.
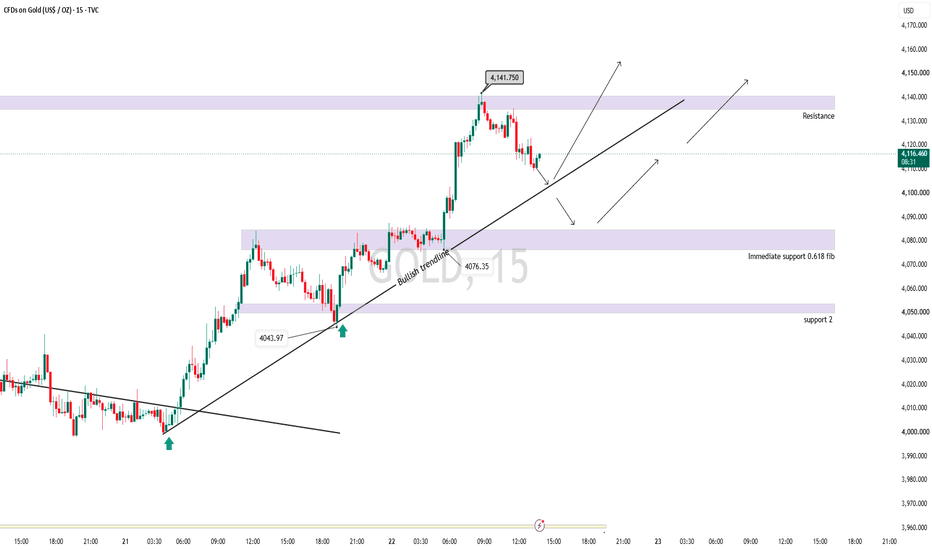
Gold(XAUUSD) outlook and trade setup for today.Price got rejected form an important resistance level of 4140, currently its retracing, the retracement might retest the horizontal support zone of 4080 and after consolidating tat that level for some more time might give a breakout on the bullish direction. Trend is very strong and there is very high chance of price continuing in upward direction.
Immediate resistance is at 4140 and support is at 4080 and below that next support is at 4045.
Outlook remain on the bullish to sideways direction, only buy trades should be preferred at support levels.
For Educational Purposes only, Not an Investment Advice, Always use strict Risk management measures.
Regards
CrazyTrades247.
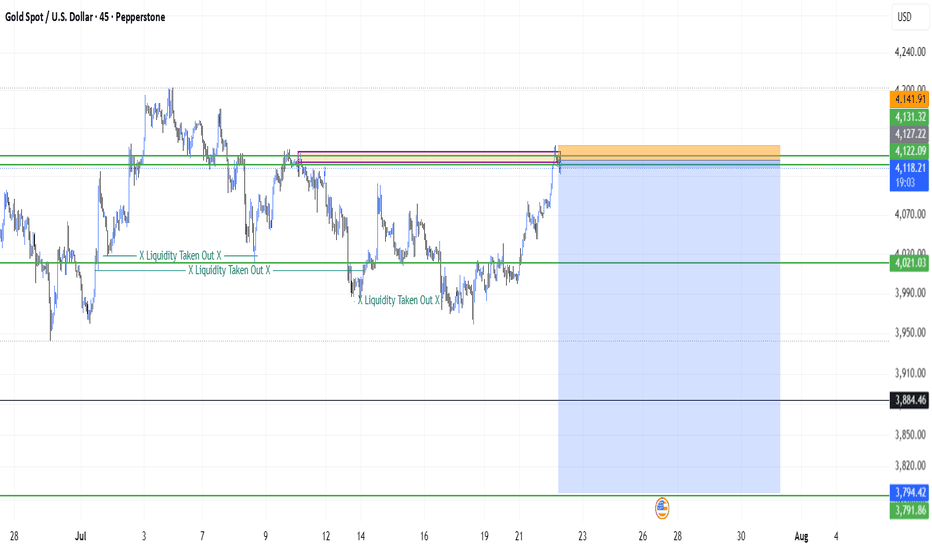
XAUUSD may be heading to $3795 - FxDollarsAnalysis -[22/07/2026]XAUUSD Short at cmp 4118, entry point was 4127
and Short limit at 4132
Stop loss at 4142
Take profit at 3795
Disclaimer:- This report is prepared for general informational purposes only and does not constitute personalized investment advice . This report includes general investment opinions such as buy, hold, or sell conclusions. All analysis is based on publicly available information and reflects the authorโs independent judgment at the time of publication. The content is intended for distribution to multiple recipients and should not be relied upon for individual financial decisions. Vincent (Vishal Budhrani) is not licensed by the Hong Kong Securities and Futures Commission (SFC) to provide personalized investment advice.
#Gold #XAUUSD #MarketCrash #TradingView #FinanceNews #InvestSmart #Commodities #GoldPrice #TechnicalAnalysis
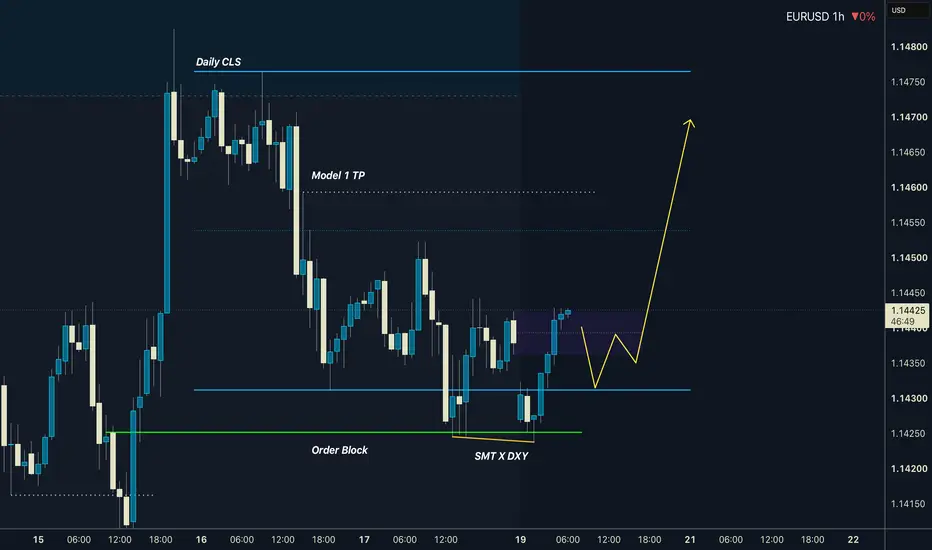
EURUSD - Daily CLS - Model 1Hi Friends, New CLS Range has been created and Im looking for Long Model 1 trade setup. As always after the manipulation in to the Key Level, below the CLS range and reaction, we need to see a confirmation switch from the manipulation phase - CIOD (change in order flow) in the the expansion.
โณ Stay patient and enter only after candle close.
๐ฏ Target: 50% Liquidity - of the CLS range.
๐ฅ CLS Model 1 Video Explanation ๐ Bullish CLS Strategy Structure โ ๏ธ Risk Control is Key to Long Term Success
๐ Always place a proper stop loss
๐ Manage your risk per trade
๐ Stay disciplined & avoid emotional tradingโจ
๐Take the Trade only if you understand logic behind itโจ
๐ Protect Capital First
๐Boost | ๐ Share | ๐ฌ Comment | โ
Follow for more CLS setups
Adapt useful, Reject useless and add what is specifically yours.
David Perk โจ
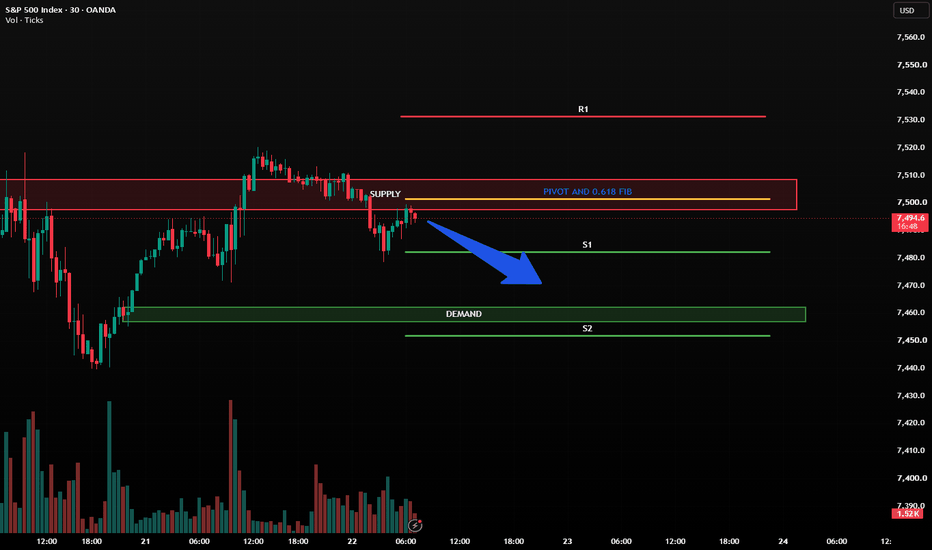
NQ Power Range Report with FIB Ext - 7/22/2026 SessionCME_MINI:NQU2026
- PR High: 29310.75
- PR Low: 29253.00
- NZ Spread: 80.25
No key scheduled economic events
Session Open Stats (As of 12:15 AM)
- Session Open ATR: 652.44
- Volume: 34K
- Open Int: 290K
- Trend Grade: Short
- From BA ATH: -6.0% (Rounded)
Key Levels (Rounded - Think of these as ranges)
- Long: 31904
- Mid: 29517
- Short: 27131
Keep in mind this is not speculation or a prediction. Only a report of the Power Range with Fib extensions for target hunting. Do your DD! You determine your risk tolerance. You are fully capable of making your own decisions.
BA: Back Adjusted
BuZ/BeZ: Bull Zone / Bear Zone
NZ: Neutral Zone
As $USO goes $CVX $XOM will followAMEX:USO is currently making a v-shape recovery back to it's previous highs. Unsure if it will return there but this is my idea.
If AMEX:USO can get above the 61.8% on the fib around $134, I would say yes. Have you missed the entire move? No as it still will track back towards $150 before it will hit a bit of exhaustion, before another decision in the market is made.
Trade ideas NYSE:CVX NYSE:XOM
EURUSD: Strong Weekly Support Could Trigger a Bullish ReversalEURUSD is testing a major weekly support zone after an extended decline. Price is reacting around a key demand area that has previously attracted buyers. If this support holds and bullish confirmation appears, the pair could begin a recovery toward the recent swing highs.
Key Levels:
* ๐ฆ Strong Support: 1.1300โ1.1350
* ๐ฏ Bullish Target: 1.1600 โ 1.1900+
* โ A weekly close below support could invalidate the bullish outlook.
This analysis is based on price action and market structure. Always wait for confirmation and manage your risk before entering any trade.
Disclaimer: This idea is for educational purposes only and is not financial advice.
XAUUSD: Major Resistance Could Trigger a Sharp SelloffGold is approaching a major resistance zone after a strong bullish recovery. This area could trigger selling pressure if buyers fail to break above it. A rejection may lead to a move toward the recent weak lows, while a confirmed breakout and close above resistance would invalidate the bearish outlook.
Key Levels:
* ๐ต Resistance: 4065โ4085
* ๐ Bearish Target: 4000 โ 3950
* โ ๏ธ Wait for confirmation before entering.
This analysis is for educational purposes only and is not financial advice.
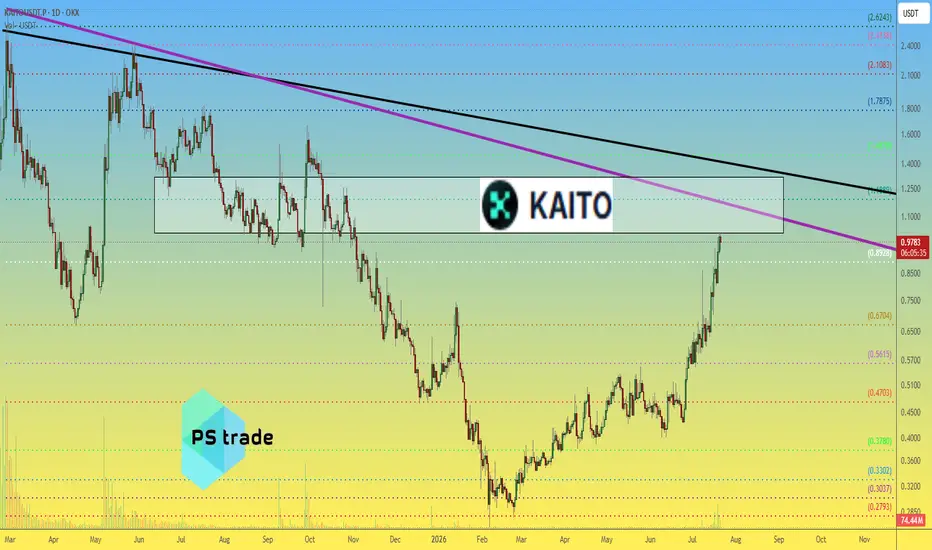
KAITO price analysis๐จโ๐ป Those who have been holding CRYPTOCAP:KAITO since our previous analysis may want to start watching the chart more closely.
โช๏ธ OKX:KAITOUSDT has now entered an interesting and highly liquid zone between $1.02 and $1.32. The $1.19 level is particularly noteworthy, as buyers struggled to break through it, and that battle is clearly visible on the chart.
โช๏ธ There are a few other things that catch our attention. Price is approaching major trendlines, the current rally has unfolded with almost no meaningful pullbacks, and most importantly, the move has not been supported by a noticeable increase in trading volume.
โช๏ธ For now, our conclusion is fairly straightforward. The market may still push CRYPTOCAP:KAITO a little higher, but every additional cent is likely to become more difficult to gain. On the other hand, sending the price back down would probably require much less effort.
Of course, we could be missing something.
๐ฌ So tell us: what fundamental reasons do you see that could justify a significantly higher valuation for CRYPTOCAP:KAITO ?
______________
โ Follow us โค๏ธ for daily crypto insights & updates!
๐ Donโt miss out on important market moves
๐ง DYOR | This is not financial advice, just thinking out loud
Sedco Capital Reit Fund : From Deep Discount to Potential 14โ16TADAWUL:4344
๐ From Deep Discount to Potential 14โ16 Target? The Weekly Chart Tells an Interesting Story ๐ฅ
The weekly chart suggests that price may have completed a major accumulation and recovery phase after rebounding from a deep discounted Fibonacci retracement zone of the previous bullish swing from 4.14 to 11.00.
๐ The Price Structure
After the initial bullish move, price retraced within a descending parallel channel, eventually forming a significant swing low near 5.91 in November 2025.
Since that low, price has demonstrated strong weekly bullish momentum and steadily recovered, despite the severe geopolitical conflict affecting the region during the first half of 2026.
This resilience is an important technical observation.
โ ๏ธ Key Resistance: 8.10โ8.25
Price is now approaching a significant resistance zone around 8.10โ8.25, which aligns with the 0.5 Fibonacci retracement level.
At this stage, the market may need to cool off before continuing higher.
This could happen through:
๐น Sideways consolidation
๐น A controlled technical correction
๐น A retest of previous breakout levels
๐ฏ Two Critical Correction Zones
If price experiences a pullback, two areas stand out:
๐ 7.13 โ Parallel Channel Breakout Retest
A retest of the previous descending channel breakout could provide an important support test.
๐ 6.80 โ 0.618 Fibonacci Retracement Zone
This area represents the deeper Fibonacci retracement level of the latest bullish swing and could act as a potential demand zone.
๐ Breakout Strategy
For new positions, chasing price at the current market price may carry a relatively higher risk due to the nearby resistance zone.
A confirmed breakout above 8.25, preferably followed by a successful retest and support confirmation, could provide a more favorable risk-reward entry for momentum traders.
๐ Potential Upside Targets
If the bullish structure remains intact:
๐ฏ Initial upside target: Around 12.00
This is where the projected AB=CD harmonic pattern could reach completion.
๐ญ Extended target zone: 14.00โ16.00
A Reverse Fibonacci Extension projection suggests the possibility of a larger measured move toward this region.
๐ง My View
The broader weekly market structure remains bullish, but price is now entering a major technical decision zone.
The key question is:
Will price break above 8.25 and accelerate higher, or will the market first consolidate and retest lower support levels before the next major move?
For me, 8.25 remains the key trigger level, while 7.13 and 6.80 are the important correction and accumulation zones to monitor.
Do you think this is a breakout setupโor does price need one more correction before the next leg higher? ๐
Share your view below. โฌ๏ธ
๐ Hashtags
#Tadawul #SaudiStocks #SaudiStockMarket #TASI #SaudiInvesting #SaudiTrading #SaudiInvestors #TadawulStocks #SaudiMarket #KSAStocks #RiyadhMarket #GCCMarkets #MiddleEastMarkets #StockMarket #Investing #Trading #TechnicalAnalysis #PriceAction #Breakout #SwingTrading #MarketOutlook #StockAnalysis #TradingIdeas #Bullish #Bearish #ChartAnalysis #TradingView #WiSHFundManagement
XAUUSD Daily Analysis โ Bearish Structure Shift Confirmed Timeframe: Daily (Higher Timeframe Context)
Scale: Deep Structural + Liquidity Analysis
_______________________________________________________
Market Observation Gold has completed a clear Market Structure Shift (MSS) to the downside around 4269. The market is now consistently making lower highs and lower lows, confirming seller dominance on the daily chart.
Market Bias
Bearish Bias in the medium term with potential counter-trend buying opportunities at strong demand zones.
Full Liquidity Map Bearish Opportunity (Selling Zone):
4400 โ 4460
Strong resistance area where sellers are likely to defend. Good risk-reward for short positions if price retests this zone. Bullish Buying Zones (Demand):Medium Buying Zone: 3930 โ 3970
Normal risk area with previous reaction. Suitable for swing longs with proper confirmation.
Strong Long-Term Buying Zone: 3500 โ 3550
Major liquidity pool + Bullish Order Block from higher timeframe. High-probability reversal area for long-term investors.
Structure Factors:
Bearish MSS completed around 4269
Continuous lower low formation
Liquidity sweep potential above recent highs
Strong daily Order Block at 3500-3550 level
________________________________________________________________
Trade Active Battlefield: Gold (XAUUSD)
Potential Scenarios: Bearish Continuation โ Retest of 4400-4460 for short entries
Bullish Reversal โ Deep pullback to 3930-3970 or 3500-3550 for long entries
_________________________________________________________________
This is not financial advice. Always manage your risk properly and do your own analysis.
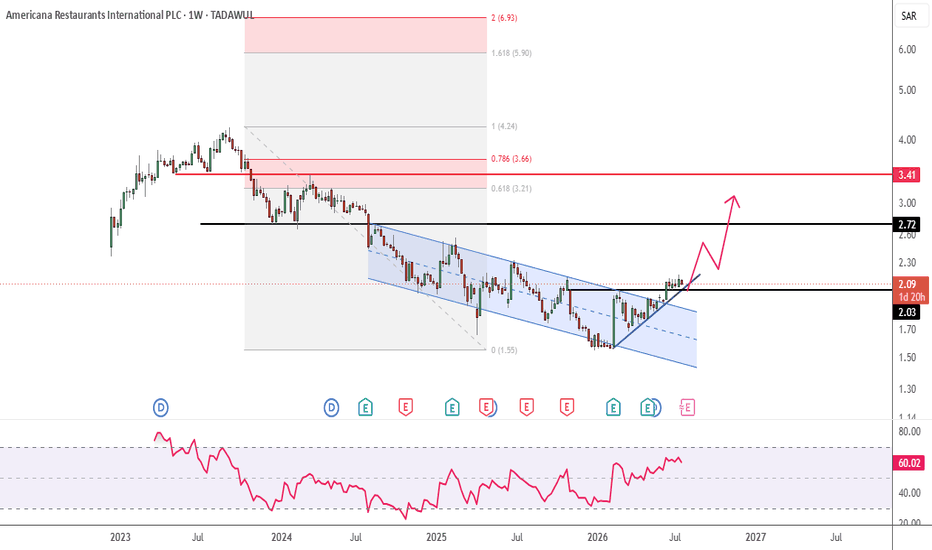
Americana : Is a Breakout Around the Corner ?TADAWUL:6015
๐ 5-Week Consolidation: Is a Breakout Around the Corner? ๐
After spending nearly five weeks consolidating around the 2.00 level, price continues to hold within a tight range, with the recent swing high forming near 2.09.
This prolonged consolidation is becoming increasingly interesting from a price action and technical analysis perspective.
๐ Key Technical Structure
๐น Trendline support remains intact, suggesting buyers are still defending the underlying structure.
๐น Price is also sustaining above the 2.03 resistance zone. If this level continues to hold as support, it could signal a potential resistance-to-support flip and increase the probability of an upside breakout.
๐น After several weeks of sideways price action, a confirmed breakout could trigger a strong momentum expansion.
๐ฏ Potential Upside Targets
If price confirms a bullish breakout and maintains its position above the key resistance zone:
๐ Immediate upside target: 2.50โ2.70
๐ Extended Fibonacci target: 3.20โ3.50
๐ Key reference: 0.618 Fibonacci retracement/extension zone
โ ๏ธ Setup Invalidation
The bullish thesis would be invalidated if price breaks decisively below the rising trendline support.
In that scenario, the consolidation structure could fail and price may potentially retrace toward the 1.75 support zone.
๐ My View
The market appears to be coiling after an extended period of consolidation.
As long as trendline support remains intact and price sustains above 2.03, the technical structure continues to favor a potential bullish breakout.
A confirmed breakout above the recent 2.09 swing high could provide the momentum needed for the next leg higher.
Is this consolidation preparing for a breakout, or will the trendline eventually fail? ๐
Share your view below. โฌ๏ธ
๐ Hashtags
#TechnicalAnalysis #TradingView #PriceAction #Breakout #BreakoutTrading #BullishSetup #BullishTrend #SwingTrading #MarketStructure #Trendline #SupportAndResistance #ResistanceBreakout #Fibonacci #FibonacciRetracement #PriceTarget #MomentumTrading #ChartAnalysis #TradingIdeas #TradeSetup #StockMarket #Investing #TechnicalTrader #TrendFollowing #TradingStrategy #MarketOutlook #Bullish #WiSHFundManagement
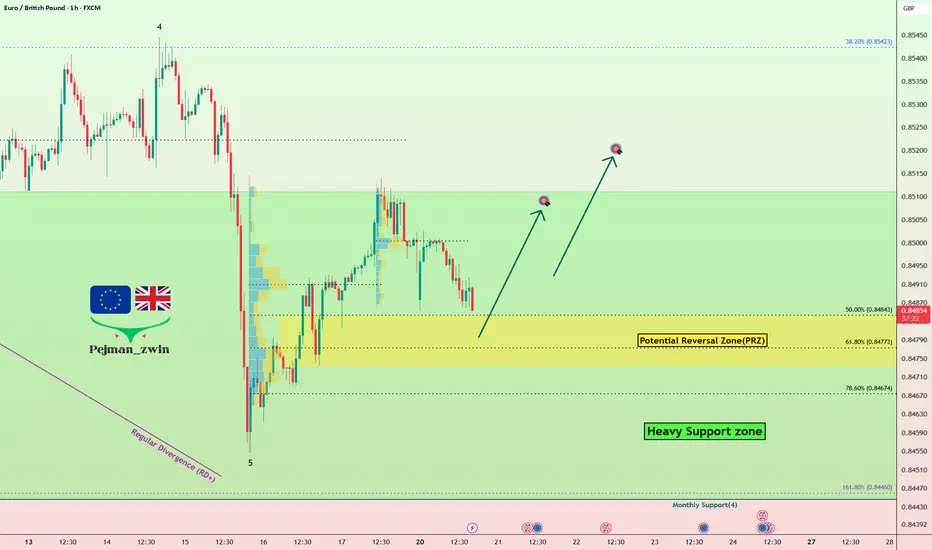
EURGBP at Major Support โ Is a Bullish Reversal Finally Here?EURGBP ( FX:EURGBP ) is currently trading inside a heavy support zone(0.8511 GBP-0.8444 GBP)). On the higher timeframe, we can also see a Positive Regular Divergence (RD+) between two consecutive valleys, which could be an early sign of a potential bullish reversal.
From an Elliott Wave perspective, EURGBP appears to have completed its five-wave bearish structure, suggesting that a corrective move to the upside may begin soon.
The key trading level to monitor if EURGBP starts moving higher is 0.8522 GBP.
I expect EURGBP to rebound from the Potential Reversal Zone(PRZ) and continue its bullish correction, with an initial target around 0.8510 GBP.
First Target: 0.8510 GBP
Second Target: 0.8519 GBP
Stop Loss(SL): 0.8465 GBP
Whatโs your view on EURGBP? Do you think the pair can resume its bullish trend, or should we expect another bearish move first?
๐ก Please respect each other's opinions and express agreement or disagreement politely.
๐Euro/ British Pound Analyze (EURGBP), 1-hour time frame.
๐ Always set a Stop Loss(SL) for every position you open.
โ
This is just my idea; Iโd love to see your thoughts too!
๐ฅ If you find it helpful, please BOOST this post and share it with your friends.
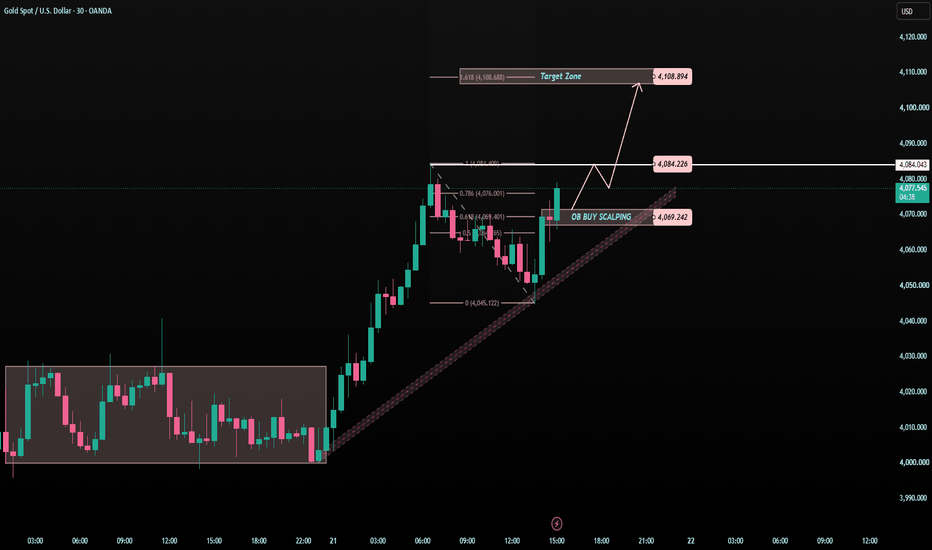
XAUUSD M30 โ Can 4,084 Open 4,108?Gold is showing a clear short-term recovery on the M30 chart.
After building a base around the 4,000 area, price broke higher and is now trading around 4,070 - 4,080.
The move looks strong, but the chart is already close to the first important resistance.
So for the US session, I do not want to chase blindly.
I want to see if buyers can protect the M30 structure.
The simple read
Gold is currently moving above the rising trendline.
The short-term structure remains positive while price holds above the 4,069 OB buy scalping zone.
This area also connects with the Fibonacci reaction zone, so it becomes an important support for the current intraday recovery.
The first upside test is 4,084.
If gold breaks and holds above 4,084, buyers may try to continue toward the target zone near 4,108.
But if gold rejects from 4,084, a retest back toward 4,069 may appear first.
Key price zones
Current price area: 4,070 - 4,080
M30 OB buy scalping zone: 4,069
First resistance: 4,084
Target zone: 4,108
Trendline support: 4,060 - 4,069
Bullish structure weakens below: 4,069
Trading plan for US session
๐ Bullish continuation scenario
If gold holds above 4,069:
The M30 recovery structure remains valid.
Buyers may try to push price toward 4,084.
If 4,084 breaks and holds, the next target zone becomes 4,108.
A clean bullish setup needs price to hold above the trendline or retest 4,069 successfully.
๐ Rejection scenario
If gold rejects from 4,084:
Price may pull back toward 4,069.
This would not automatically break the bullish view.
It may simply be a healthy retest before the next decision.
A clean reaction from 4,069 could support another push higher.
๐ Weakness scenario
If 4,069 breaks clearly:
The M30 bullish structure becomes weaker.
Gold may need a deeper pullback before buyers can rebuild momentum.
In that case, I would avoid forcing a buy until price gives a new confirmation.
Tiaraโs View
Gold is improving on M30, but the US session is now testing a sensitive area.
For me, the key is not the fast move.
The key is whether price can hold above 4,069 and break 4,084 with strength.
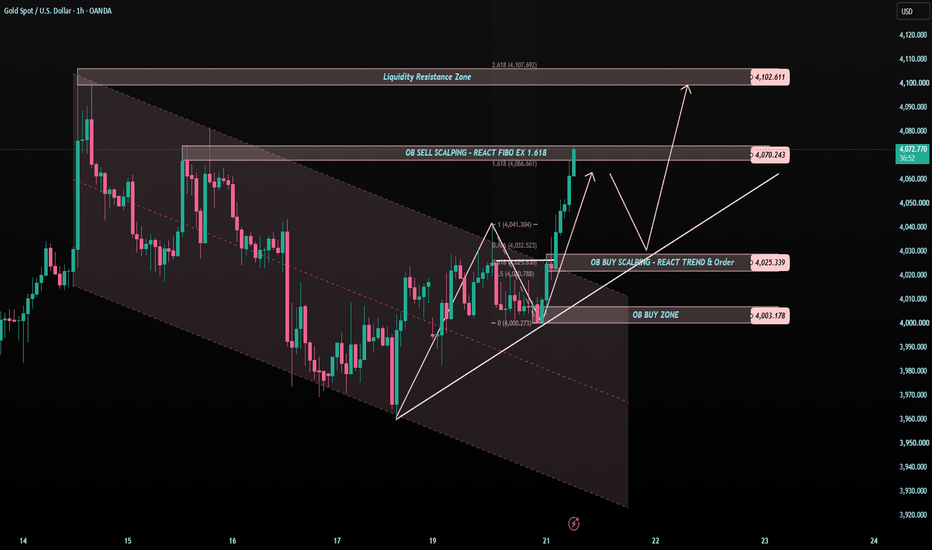
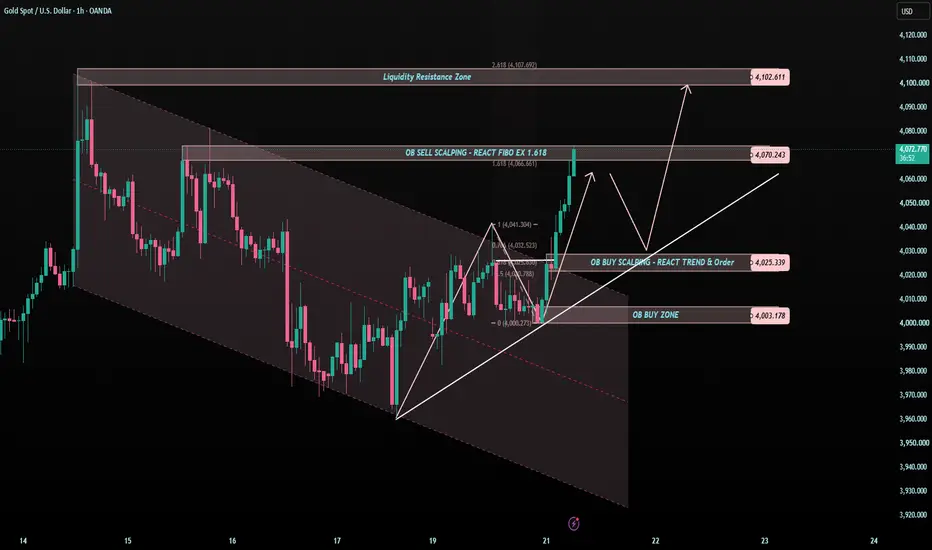
XAUUSD โ Did Gold Just Break 4,070?Gold is showing a stronger short-term recovery today.
Price has pushed into the 4,070 area, which is an important reaction zone on the chart.
This zone is not random.
It lines up with the OB sell scalping area and the Fibonacci extension reaction around 1.618.
So even though buyers are showing strength, I still do not want to chase blindly at the top of the candle.
The simple read
Gold has escaped the previous bearish channel pressure and is now building a short-term recovery structure.
The rising trendline is supporting price from below.
As long as gold holds above 4,025 and 4,003, the recovery structure can remain valid.
The key level now is 4,070.
If gold breaks and holds above 4,070, buyers may try to continue toward the liquidity resistance zone around 4,102.
But if price fails to hold above 4,070, a pullback toward 4,025 may appear first.
That pullback would not automatically destroy the bullish view.
It may simply be a retest before the next decision.
Key price zones
Current price area: 4,065 - 4,075
Breakout / reaction zone: 4,070
Liquidity resistance zone: 4,102
Trendline / OB buy reaction zone: 4,025
Main OB buy zone: 4,003
Bullish structure weakens below: 4,003
Trading plan
๐ Bullish continuation scenario
If gold holds above 4,070:
The recovery structure becomes stronger.
Buyers may try to push price toward 4,102.
A cleaner bullish idea needs price to stay above 4,070 or retest this level successfully.
No clean hold = no strong confirmation.
๐ Retest scenario
If gold rejects from 4,070:
Price may pull back toward 4,025.
This is the first important support zone connected with the rising trendline and OB buy reaction area.
If buyers defend 4,025, gold may try another push toward 4,070 and 4,102.
๐ Deeper pullback scenario
If 4,025 fails:
Gold may move lower toward 4,003.
This is the main OB buy zone on the chart.
If 4,003 also fails, the short-term recovery becomes weaker and the market may need more time to rebuild.
Tiaraโs View
Gold is improving, but the chart is now testing a very sensitive breakout area.
A breakout candle can look exciting.
But the real confirmation comes from the hold or the retest.
For today, I am watching one question:
Can buyers protect 4,070?
If yes, 4,102 becomes the next liquidity target.
If not, the market may pull back to test 4,025 first.
Main view:
Gold is short-term bullish while holding above 4,025.
4,070 is the breakout decision zone.
4,102 is the next liquidity resistance.
4,025 - 4,003 is the key support area if price pulls back.
Reaction first.
Confirmation second.
Trade last.
No confirmation = no trade.
Do you think gold can hold above 4,070, or will it retest 4,025 first?
$BSB / USDT: Macro Elliott Wave 3 Expansion SetupStrategy: Mid to Long-Term Bullish Accumulation / Reversal
Pattern: Daily Falling Wedge at Wave 2 Demand Apex
Current Price Zone and ideal Entry Price Zone: $0.129 โ $0.138
๐ Elliott Wave & Fibonacci Level Breakdown
Wave 1 (Initial Impulse): Established the primary structural swing high from cycle lows near $0.080 up to resistance.
Wave 2 (Current Bottoming Phase): Retracing 61.8% โ 78.6% Fib of Wave 1 into the current $0.125 โ $0.138 demand pocket. Limit order absorption (flat price despite sell CVD) signals this macro pullback is completing inside the falling wedge apex.
Wave 3 (Macro Parabolic Expansion): Projected 1.618x โ 2.618x Fib extension of Wave 1. Upside expansion targets $0.35 โ $0.85.
Wave 4 (Consolidation / Pullback): Projected shallow 23.6% โ 38.2% Fib retracement of Wave 3.
Wave 5 (Macro Blow-Off Top): Projected 0.618x โ 1.000x Fib extension of Waves 1โ3 combined, targeting $1.50 โ $2.00+.
๐ Reloading Scenarios: Wave 2 vs. Wave 4 Strategy
๐ฅ Primary Opportunity: Wave 2 Reloading (Heavy Capital Deployment)
Zone: $0.125 โ $0.138 (Current Golden Pocket / Wedge Apex)
Rationale: Wave 2 offers the maximum Risk-to-Reward ratio across the entire Elliott Wave cycle. Reloading heavily here allows you to front-run the longest, most violent leg of the trend (Wave 3) while maintaining a tight, well-defined invalidation level.
Execution: Maximize position sizing in this accumulation floor.
โก Secondary Opportunity: Wave 4 Reloading (Optional Scale-In)
Zone: Shallow pullback zone after Wave 3 completion (estimated around $0.32 โ $0.38, depending on Wave 3 peak).
Rationale: Wave 4s in altcoin macro trends tend to be brief, complex, or shallow (23.6%โ38.2% Fib). Reloading here is strictly optional for compounding gains or adding trailing margin before Wave 5, but offers significantly less R:R compared to the Wave 2 base.
๐ฏ Key Targets & Risk Management
Invalidation / Stop Loss: Daily close below $0.120 (Invalidates Wave 2 bottom structure)
TP 1 (Wave 3.1 Breakout / Wedge Target): $0.35 โ $0.50
TP 2 (Wave 3 Macro Extension): $0.75 โ $0.85
TP 3 (Wave 5 Cycle Ceiling): $1.50 โ $2.00
#BSB #CryptoTrading #ElliottWave #Fibonacci #Altcoins #TradingSetup
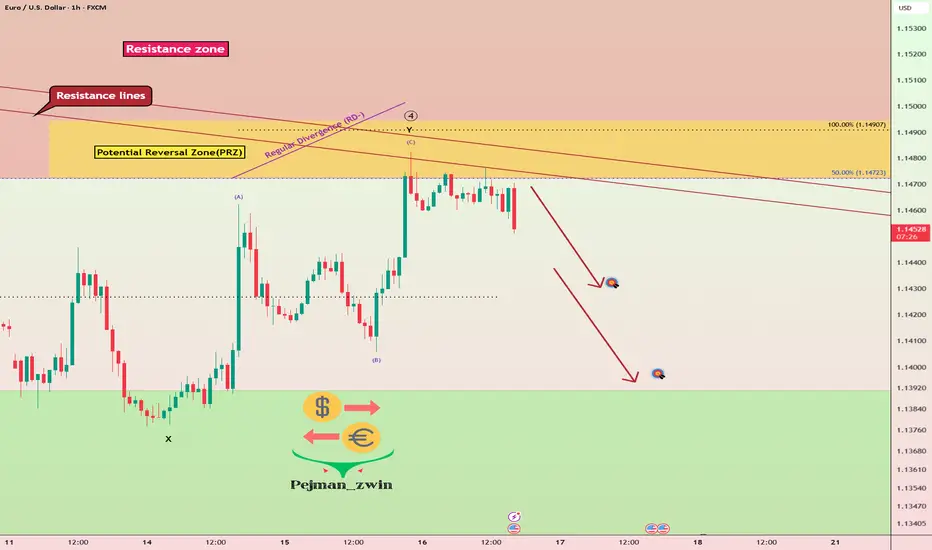
EURUSD at Major Resistance โ Is a Bigger Correction Beginning?EURUSD ( FX:EURUSD ) is currently trading near a resistance zone($1.1573-$1.1473), the Potential Reversal Zone (PRZ) , and the Resistance Lines.
From an Elliott Wave perspective, EURUSD appears to have completed its Primary Wave 4 near the resistance lines. The overall structure of Wave 4 seems to be developing as a Double Three Correction (W-X-Y).
Also, we can see a Negative Regular Divergence (RD-) between two consecutive peaks, which could be an early sign of weakening bullish momentum.
I expect EURUSD to continue its bearish move in the coming hours and decline at least toward 1.1430. If the bearish momentum increases, the pair could extend its decline further. A break below the key trading level of 1.1428 could open the door for a deeper correction.
First Target: $1.1430
Second Target: $1.1410
Third Target: $1.13920
Stop Loss(SL): $1.1496(Worst)
Whatโs your view on EURUSD? Do you think the pair can continue its bullish trend, or should we expect a deeper correction?
๐ก Please respect each other's opinions and express agreement or disagreement politely.
๐ Euro/U.S Dollar Analyze (EURUSD), 1-hour time frame.
๐ Always set a Stop Loss(SL) for every position you open.
โ
This is just my idea; Iโd love to see your thoughts too!
๐ฅ If you find it helpful, please BOOST this post and share it with your friends.