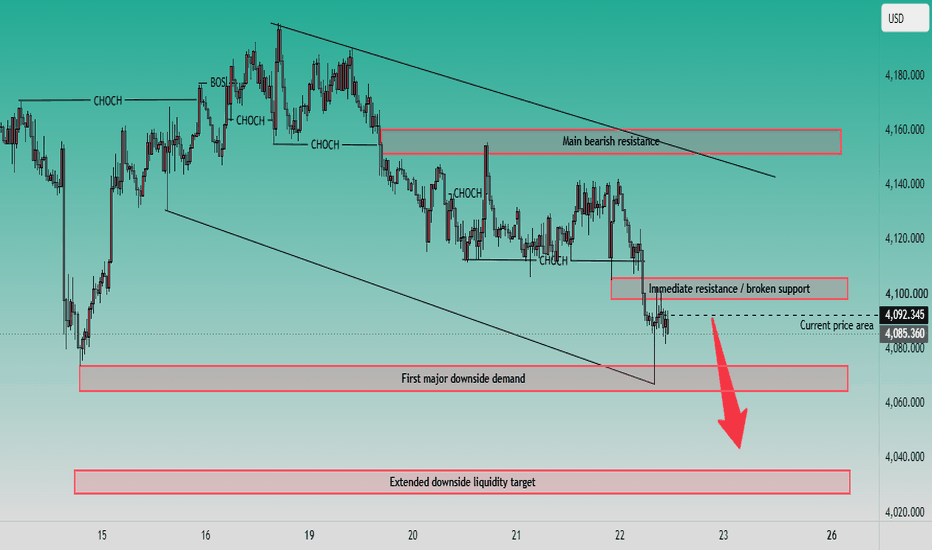
XAUUSD — 4,100 Lost, Is 4,030 the Next Magnet?
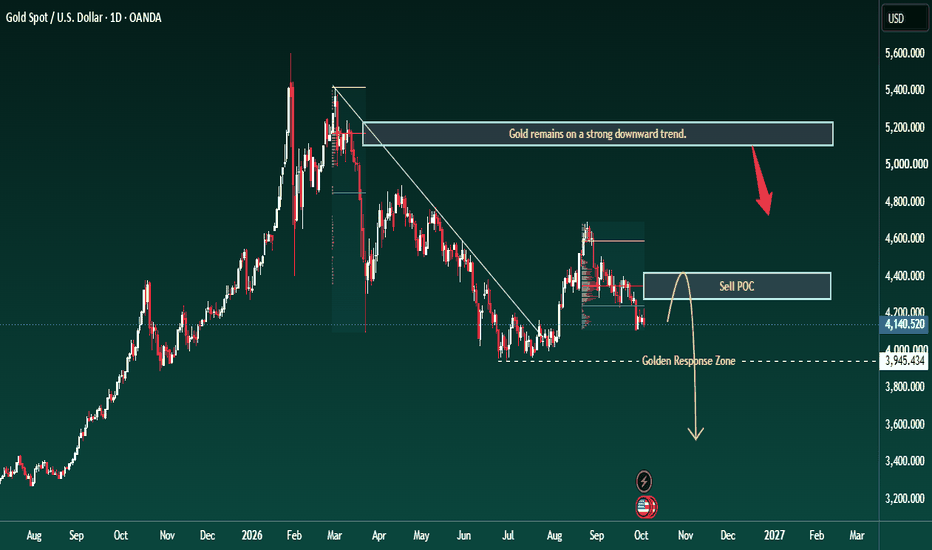
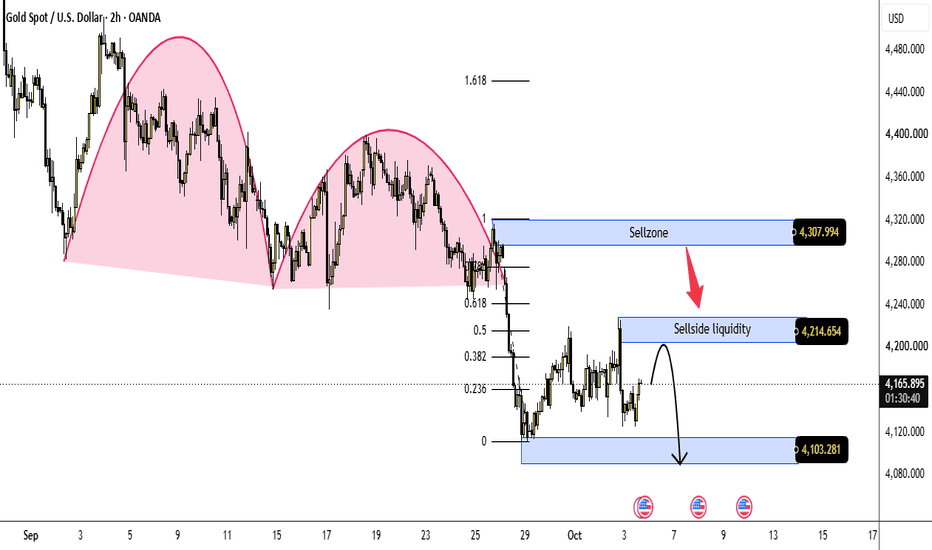
Gold is holding around the lower part of the structure, but from my view this is still a bearish market trying to pause, not a bullish market ready to reverse.
Fundamentally, price is staying relatively stable as traders reassess the Fed path, with the market still pricing a high probability that rates remain unchanged in October. At the same time, Middle East tensions are keeping safe-haven interest alive. That mix can create short-term swings, but technically the chart is still speaking wit
Fibonacci Extension
XAUUSD: Gold's Next Wave Faces Three Fibonacci Tests
Gold is climbing along a rising trendline, but the next Elliott Wave move may face a critical challenge. Is this the beginning of a stronger bullish impulse, or another corrective rally approaching Fibonacci resistance?
Elliott Wave — A Developing Bullish Structure?
Following the sharp decline and subsequent recovery in mid-October, XAUUSD has developed a short-term ascending structure.
The current advance could represent a developing bullish wave sequence, with a corrective pullback potenti
EUR/GBP ($EURGBP) Daily Technical Matrix: Testing Macro 0.8380 EUR/GBP ( OANDA:EURGBP ) Daily Technical Matrix: Testing Macro 0.8380 Static Base & 1.0 Fib Extension Node in Falling Wedge Channel
### 🇪🇺🇬🇧 Euro / British Pound ( OANDA:EURGBP ) Daily Technical Matrix (Ref: EURGBP_2026-10-21_09-32-42.png)
We are issuing a Daily (1D) macro structural technical study for the EUR/GBP currency pair ( OANDA:EURGBP / ICE). Following an extended bearish impulse wave that accelerated lower through the active descending channel framework, price action has driven stra
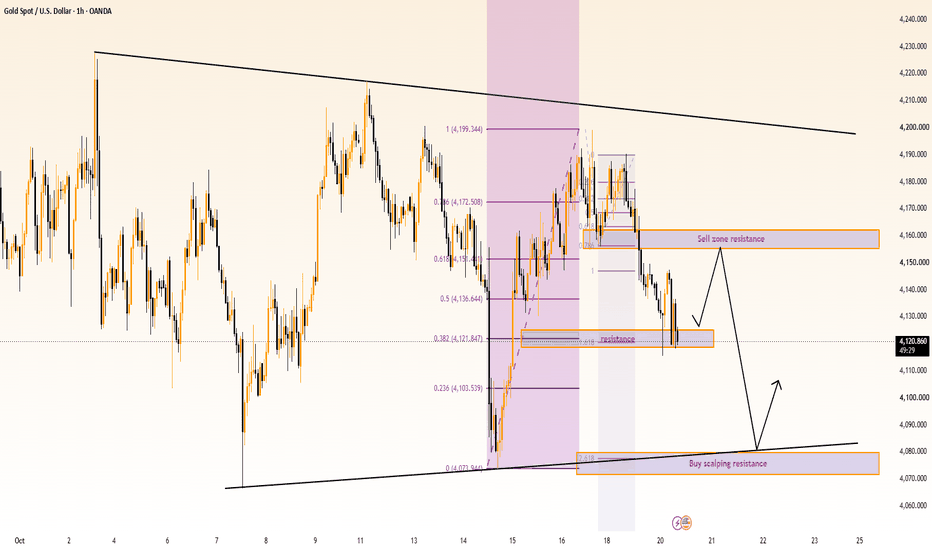
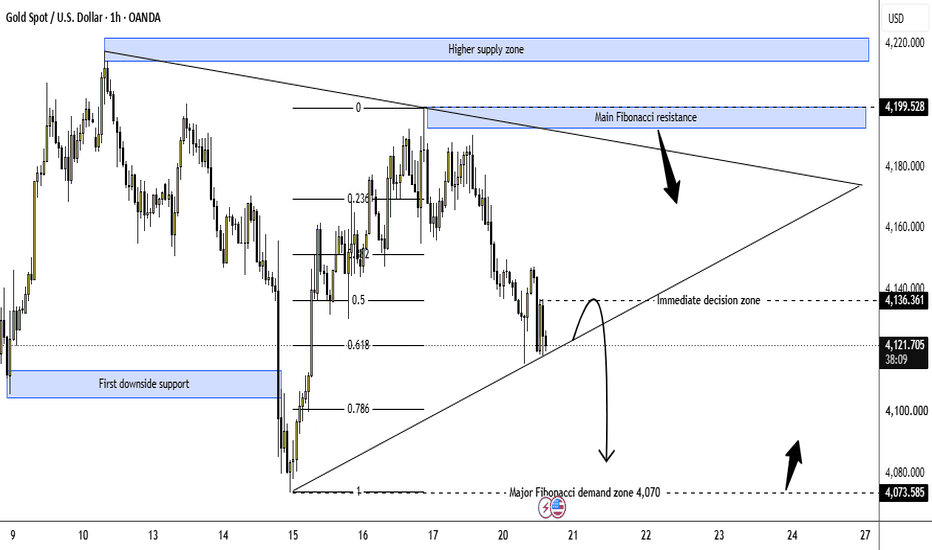
XAUUSD – Will Gold Break Below 4,120 Toward 4,070?
Gold is currently trading around 4,123 after extending its decline for a third consecutive session. Repeated rejection near 4,190 – 4,200 has weakened bullish momentum, while sellers continue to defend higher prices.
The latest H1 chart shows gold approaching a critical support area where the rising trendline from the October 15 low meets the deeper Fibonacci retracement structure.
The market is now facing an important decision: will buyers defend 4,120 and trigger another recovery, or will
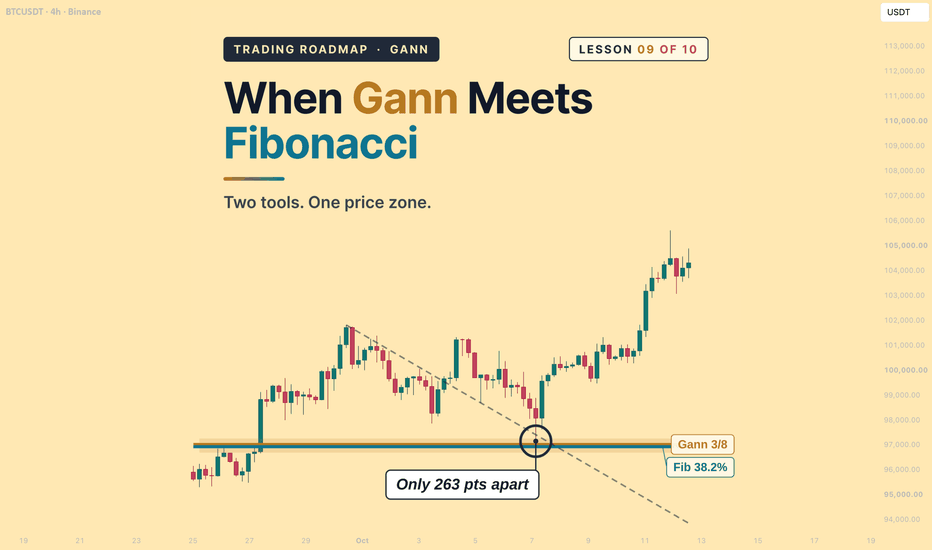
Trading Roadmap | Gann · Lesson 09 — Gann, Fib and ClassicalLesson 09 - Gann, Fib and Classical
Difficulty: (Intermediate)
Most traders who use Gann also use Fibonacci and ordinary support and resistance — and many of them count every line that agrees as one more reason to trade. This lesson takes one real Bitcoin swing and asks a harder question: when several tools point at the same price, how many independent reasons do you actually have? Sometimes it is three. Often it is one, measured twice.
BTC's advance from 74,409 to 111,983 in spring
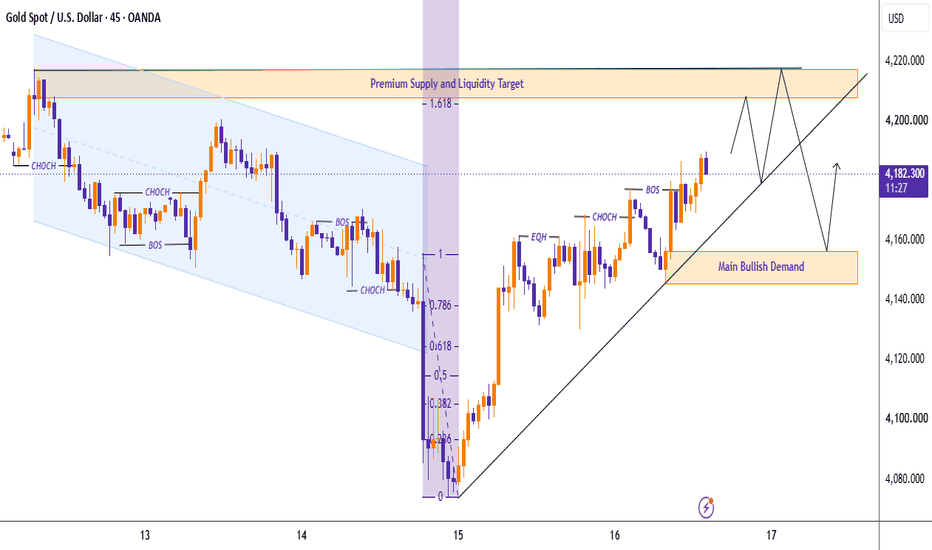
XAUUSD: Bullish BOS — Is 4,205 a Liquidity Trap?
Gold is trading around 4,184 after a strong recovery from the 4,075 low.
The market has undergone an important structural shift. After several sessions of lower highs and lower lows inside a descending channel, buyers stepped in aggressively, producing a bullish CHoCH followed by a BOS near 4,175–4,180.
Price is now supported by a rising trendline, suggesting that short-term bullish momentum is improving.
However, the real challenge lies at 4,205–4,218, where premium supply, liquidity and F
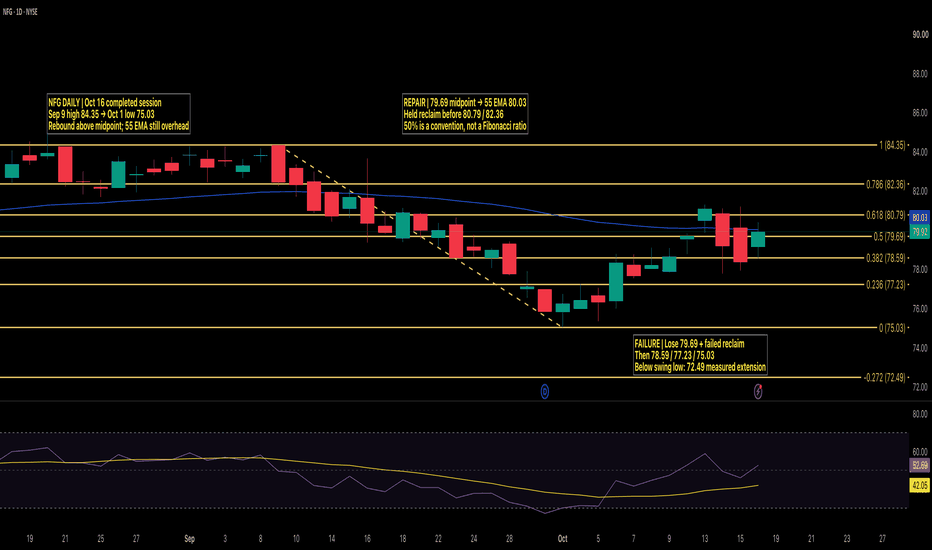
NFG: A Completed Acquisition Does Not Complete a Chart ReclaimNational Fuel's business milestone and its daily price test belong on the same research page, but they answer different questions. A larger regulated footprint can change the company's operating mix. It does not automatically move a candle above a falling average. The October 16 daily chart is a useful lesson in connecting fundamental context to a conditional setup without allowing one to stand in for the other.
Macro — identify which gas exposure you are actually studying
National Fuel report
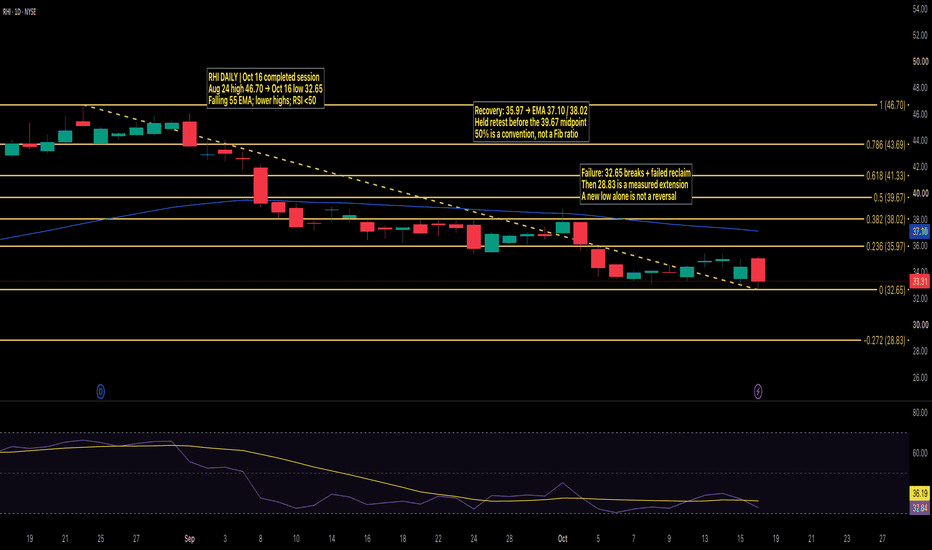
RHI: A New Low Does Not Supply Its Own Reversal SignalA Fibonacci map can organize a falling stock without making the newest low a buying signal. Robert Half's daily chart provides a concrete example: a visible sequence of lower price areas, a falling 55 EMA and a new low at the end of the selected decline. The task is to define what a recovery would have to accomplish, rather than assume that a large measured decline is enough.
Macro and fundamental context — identify the business before the ratio
Robert Half operates in specialized staffing and
Japan 225 (Daily) – Key Trendlines & Critical Support LevelsThe Japan 225 is currently testing key dynamic support trendlines on the daily chart. Depending on how price action reacts around these dynamic trendlines, we have two distinct scenarios—a bullish continuation or a deeper correction toward major horizontal support zones.
Scenario 1: Bullish Trendline Hold (Primary Bias)Condition: As long as the current ascending dynamic support trendlines hold, the overall bullish structure remains intact.
Target: A successful bounce off this dyna
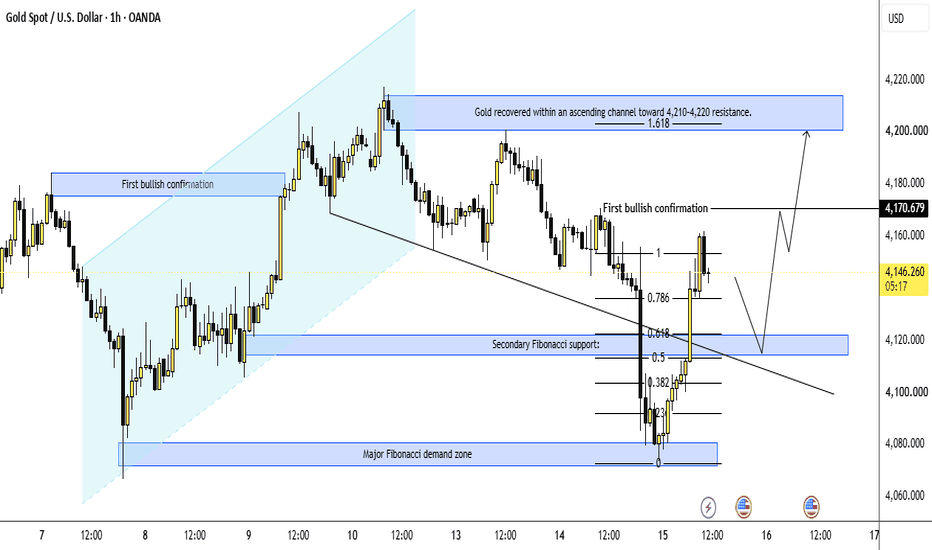
XAUUSD – Fibonacci Recovery: Can Gold Reclaim 4,170?
Gold is currently trading around 4,145 after a sharp rebound from the major Fibonacci demand zone near 4,070 – 4,080. The recovery initially pushed price toward 4,160, but buyers struggled to maintain momentum, leading to another pullback toward the current reaction area.
From the chart, gold previously developed a bullish recovery inside an ascending channel, eventually reaching the major resistance zone around 4,210 – 4,220. However, the rejection from this area changed the short-term marke
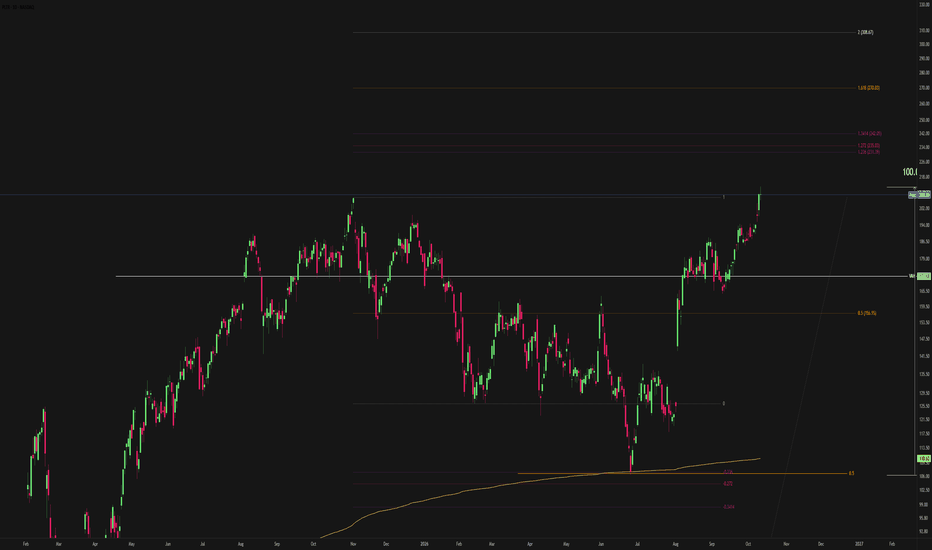
$PLTR in price discovery: adding at $171-$183, targets $231-$308The Level
Bought almost the bottom as my target to buy NASDAQ:PLTR was between $105 to $110. The low printed $106.37 and today it made a new high of $212.94, up over 100%
My add zone is $171-$183, where $171.68 is the value area high.
Why this level
The move is slightly overbought, so I expect a pullback before continuation. The $171.68 VAH is the area price broke out of, so it is the first place I want to add. The thesis underneath is fundamental. FY25 revenue was $4.4B, up 56% YoY. P/E
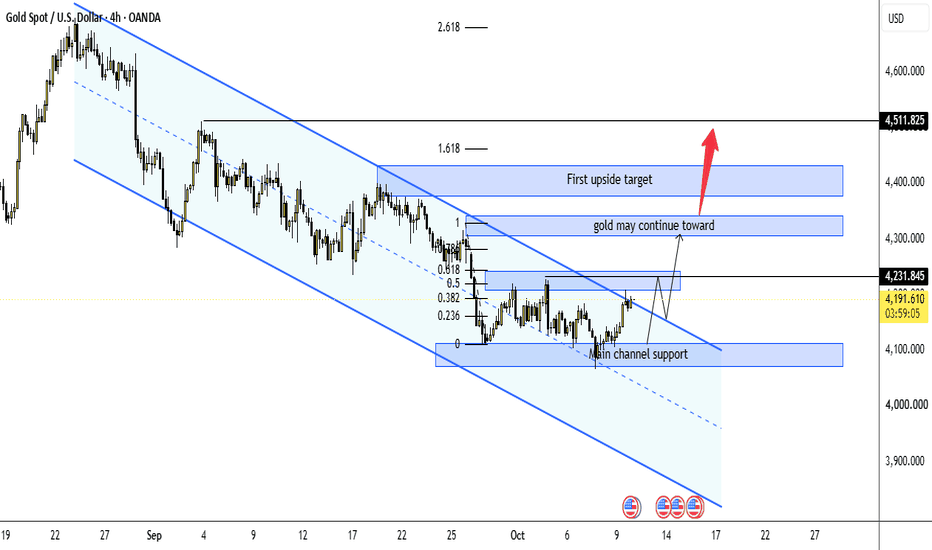
XAUUSD – Fibonacci Recovery Testing
Gold is currently trading around 4,186 after reacting from the lower support base near 4,080 – 4,100.
From the chart, price is still moving inside a broad descending channel, but the latest recovery is now approaching the upper channel boundary.
This is an important moment because gold is no longer only reacting from support; it is now testing whether buyers can break the channel structure and turn the rebound into a stronger recovery.
The Fibonacci structure shows that gold reacted from the
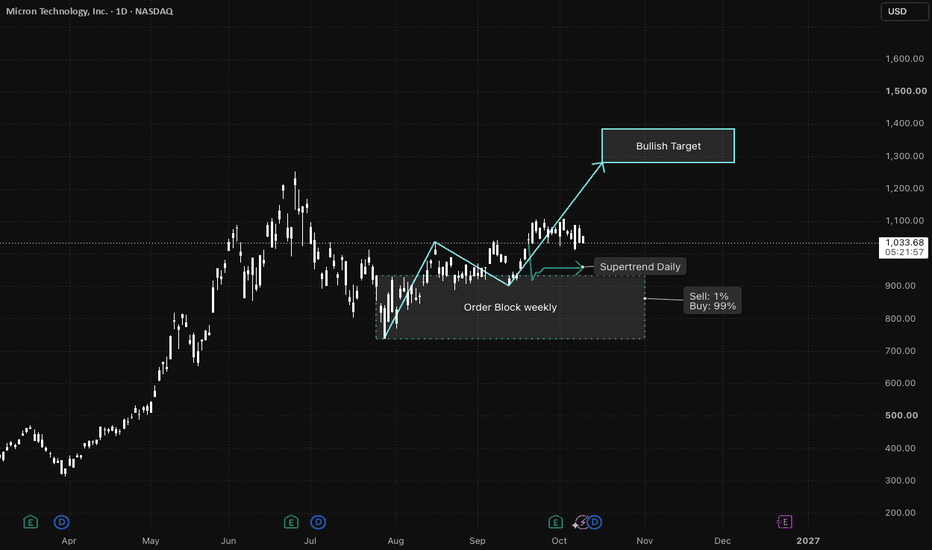
Micron ($MU) – Potential Retest Before Main ExpansionIdea Overview
Micron Technology ( NASDAQ:MU ) is currently consolidating after a recent push upward. While the macro structure remains overall bullish, we could see a deeper healthy retracement back into major support zones before reaching the main Bullish Target.
Key Technical Levels & Zones:
1. Daily Supertrend Support:
The price is hovering above the Supertrend Daily zone. A quick sweep into this level could provide the first reaction for buyers to step back in.
2. Weekly Order Block (
AUDNZD: Bearish Sequence ActivatedOANDA:AUDNZD completed its bullish expansion directly into the overhead target zone, meeting immediate rejection at the swing highs. This structural terminus marked clear buyer exhaustion, stalling upward momentum and shifting local order flow. The failure to sustain new highs marks the completion of the impulse and opens the path for a corrective cycle.
Sellers quickly carved an initial impulse low at Point A, followed by a corrective retracement into Point B within the internal BC correction
BRIAN XAUUSD – WEEKLY VOLUME PROFILE MAP: GOLD STILL UNDER SELLEBRIAN XAUUSD – WEEKLY VOLUME PROFILE MAP: GOLD STILL UNDER SELLER VALUE
Gold closed the week with a very important message:
The recovery attempts are still weak, and the higher-timeframe structure is still controlled by sellers.
Throughout the week, gold stayed trapped below the main recovery zones. Buyers tried to defend the lower value area around 4,110 - 4,180, but every recovery attempt failed to create strong acceptance above the short-term value range. This tells me the market is not in
XAUUSD – Gold Tries to Recover, But Sellers Still XAUUSD – Gold Tries to Recover, But Sellers Still Control the Structure
Gold starts the new week with a small recovery attempt around the 4,150 – 4,170 area, but the broader technical structure is still leaning bearish.
From the chart, gold is trading below the previous breakdown structure after failing to maintain strength above 4,200. The large rounded rejection pattern on the left side shows that sellers have been controlling the market from higher levels for several sessions. After the sha
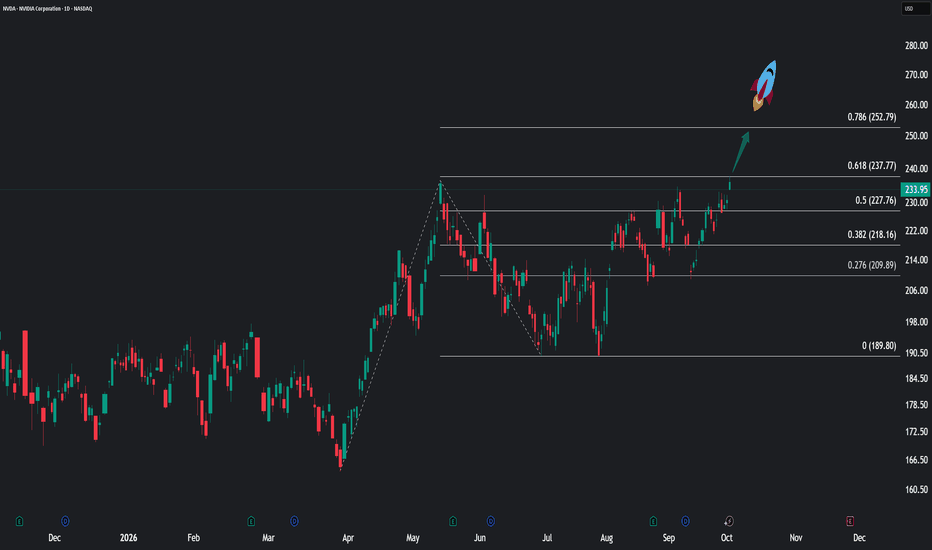
NVDA: Bulls Test ResistanceNVIDIA is approaching its May highs after several months of consolidation. On the daily chart, the latest displayed price is $233.95, as of October 2, 2026.
The recent structure looks constructive. Since the September low, price has formed higher lows and reclaimed $227.76, giving buyers the short-term advantage.
The key resistance is $237.77, aligned with the 0.618 level of the Fibonacci drawing shown on the chart. A daily close above this level, followed by a successful hold or retest, would
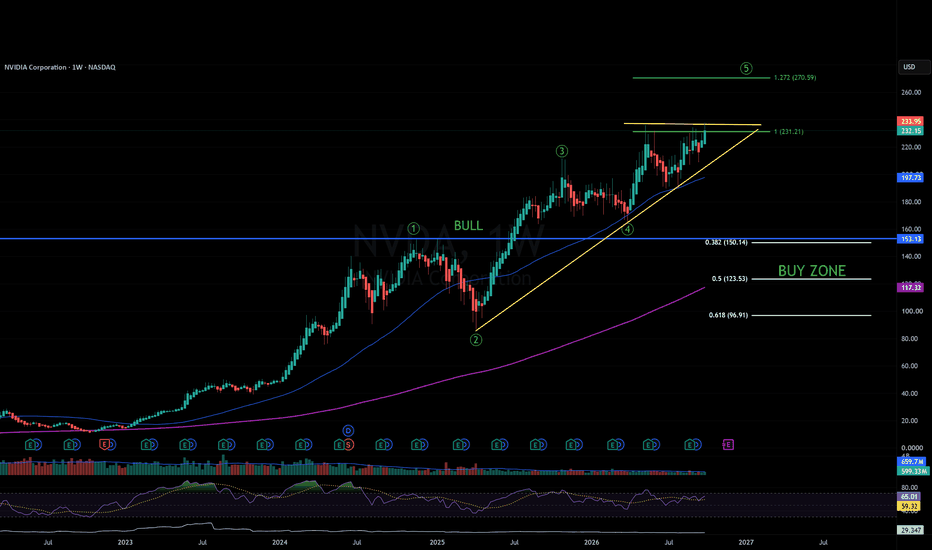
NVDA | Weekly Structure | $236 Could Unlock the Final Wave 5Thesis:
NVDA is now testing one of the most important confluence areas on the weekly chart.
The zone between roughly $228 and $236 brings together several major technical levels, and a clean break above it would put the Bull Case firmly back in play.
Context
This is the same area I have been watching for several weeks.
NVDA has continued to push higher and is now trading directly below its all-time high, with the larger Wave 5 structure still intact.
What I see
- Previous all-time high
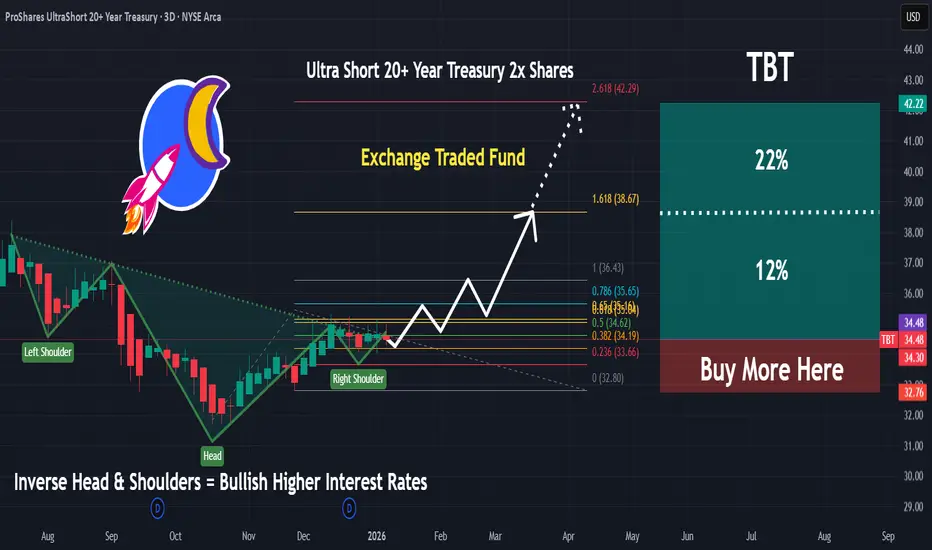
TBT | Expect Interests Rates To Surge | LONGProShares UltraShort 20+ Year Treasury seeks daily investment results, before fees and expenses, that correspond to two times the inverse (-2x) of the daily performance of the ICE U.S. Treasury 20+ Year Bond Index. The fund invests in financial instruments that ProShare Advisors believes, in combination, should produce daily returns consistent with the fund's investment objective. The index includes publicly-issued U.S. Treasury securities with minimum term to maturity greater than or equal to t
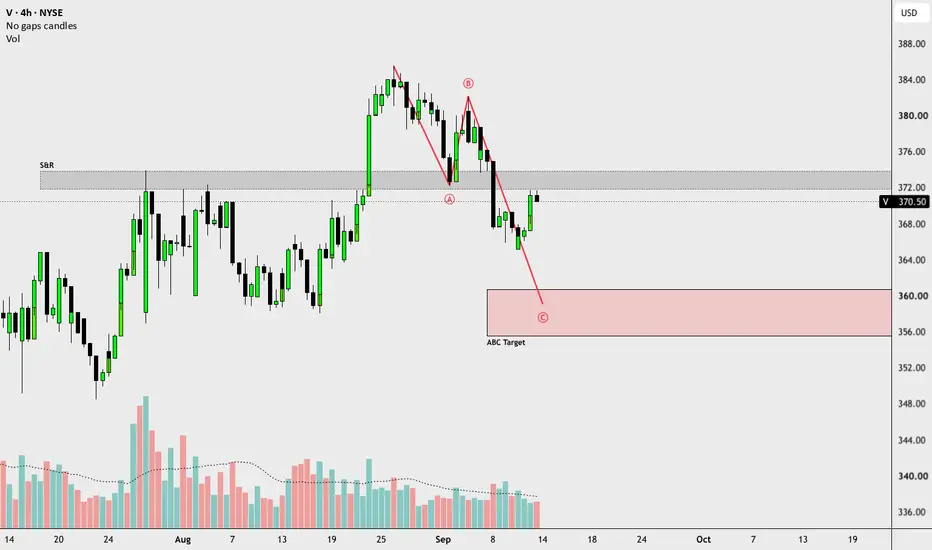
V: S&R Breakdown Clears the Path to Target CVisa Inc. ( NYSE:V ) has shifted into a clear corrective structure on the 4-hour timeframe following a rejection from the $385.00 highs. The impulsive breakdown below the key $372.00 – $374.50 support and resistance zone has decisively flipped previous structural support into immediate overhead supply, driving bearish momentum.
This breakdown confirmed the activation of an impulsive sequence, marked by the initial reaction low at Point A ($371.50) followed by a corrective lower high into Point
CaixaBank at AlltimeHigh Breakout level | CSE Option Decision OSCaixaBank is at AlltimeHigh Breakout level.
This stock made a huge leap within 1.5 ~ 2 years time.
Now, from this level, the thesis can breakout the alltime high and reach the new levels.
The Tactical Failure lies at € 10.50 and the Tactical Repair lies at € 10.70.
Macro support at 8.80
Soft Thesis Invalidation at 7.50
Hard Thesis invalidation 6.30
Find all about our unique model on CSE Option Decision OS.
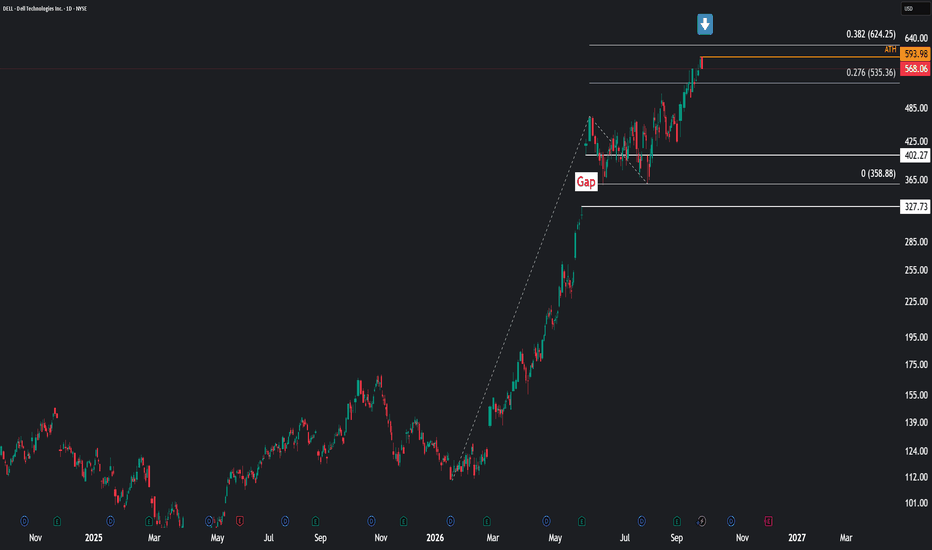
Dell: on its way to $624?I’ve drawn a Fibonacci extension that points to a technical target around $624.25 , corresponding to the 0.382 Fibonacci extension level .
The bullish momentum remains intact, but the key question now is: should we keep riding the trend, or start locking in some profits?
As price approaches this target, I’ll be watching closely for the market’s reaction and any signs of weakening momentum.
At this stage, it’s important not to get too greedy: trees don’t grow to the sky.
⚠️ Disclaimer:
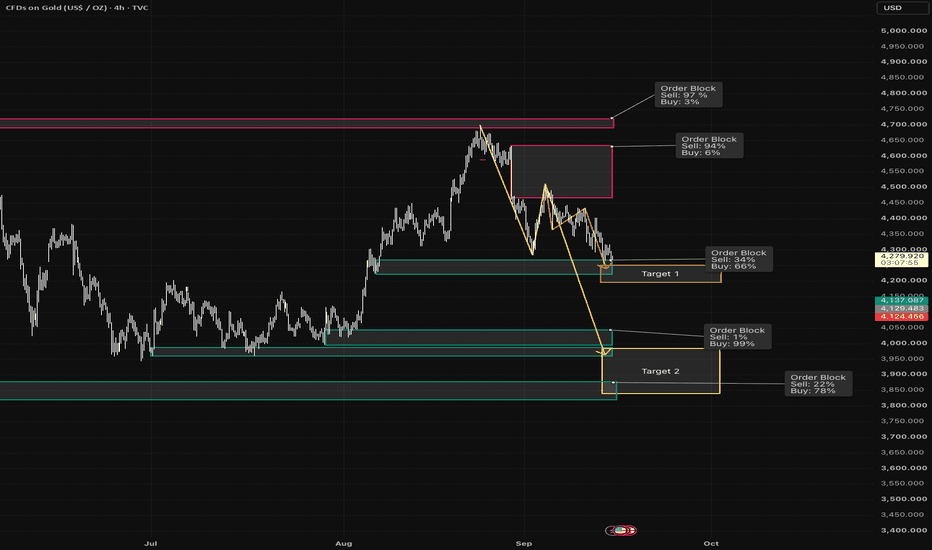
GOLD (XAUUSD) 4H: Bearish Market Structure & Key TargetsOn the 4-Hour timeframe, Gold (XAUUSD) has shown a clear market structure reversal following a rejection from the major higher-timeframe resistance supply zone around $4,700–$4,730.
After forming lower highs and lower lows, price action confirms strong bearish momentum breaking down toward major demand order blocks below.
Key Technical Highlights:
Major Resistance (Supply Zone): Heavy sell imbalance detected at $4,700–$4,730 (Order Block 97% Sell / 3% Buy).
Lower High Order Block: Secondar
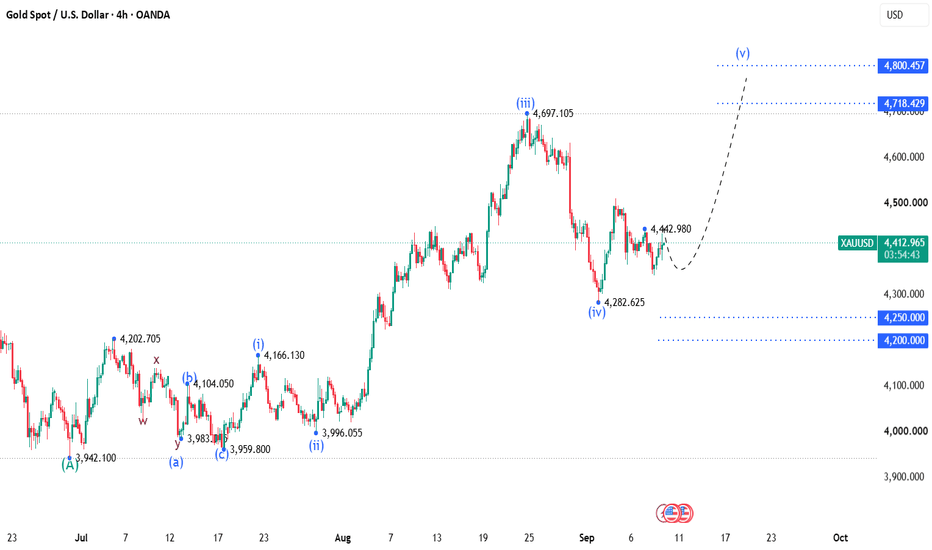
GOLD: Wave (iv) Complete —Setting Up the Final Leg to $4,718–800Good afternoon traders,
Trust you are good.
Please find below my outlook of the Gold (XAUUSD) market.
Gold appears to be in a 5-wave bullish impulse from around 3,942.1 to 4,697.105, and it appears to be in wave 4 of the 5wave impulse. Therefore, the overall direction of Gold is bullish.
Structure: Wave (i)-(ii)-(iii)-(iv) is complete and valid — no rule violations. Wave (iv) low = 4,282.625. Currently basing/chopping (4,282–4,442) ahead of wave (v).
My Primary count : Wave (iv) is done — n