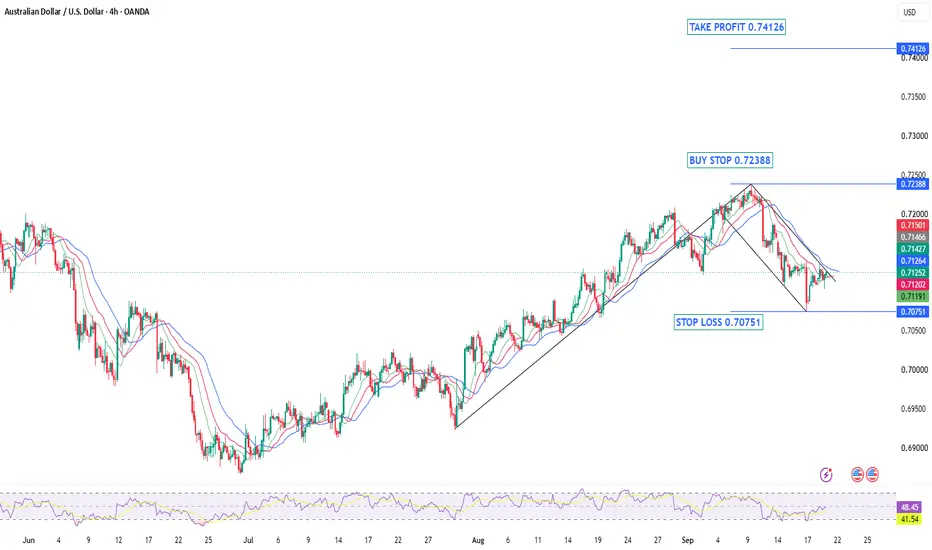
AUDUSD — Bullish Flag Breakout SetupAfter months of bearish pressure that dominated the first half of the year, AUDUSD has made a remarkable recovery. Since mid-July, the pair has been carving out a textbook bullish structure — printing a clean series of Higher Highs and Higher Lows — a classic sign that buyers are firmly in control and the market is in a healthy Advancing Phase.
The rally was strong and impulsive, with price gaining significant ground in a relatively short period of time. This kind of momentum tells us that there is genuine buying interest behind this move — not just a temporary bounce.
The Flag Formation
After such a strong impulse move pushing price all the way up to the 0.7238 resistance zone, it was only natural for the market to pause and consolidate. This is exactly what happened. Price pulled back in an orderly and controlled manner — not a sharp reversal, not panic selling — just a healthy cooldown. This consolidation formed a Bullish Flag pattern, which is one of the most reliable continuation patterns in technical analysis.
The flag has been respecting its boundaries cleanly. Price is compressing, momentum is being reset, and the market appears to be coiling up for the next move. This is exactly the kind of price action that precedes a strong breakout.
What We Are Looking For
A clean breakout and close above the upper boundary of the flag at 0.72388 would confirm that the consolidation phase is over and the trend is ready to resume. Once buyers take control above that level, the path toward 0.74126 opens up — a significant supply zone and our target for this setup.
The stop loss is placed at 0.70751, below the flag structure and recent swing low — giving the trade enough room to breathe while keeping risk defined.
Levels to Watch:
🔵 Buy Stop: 0.72388 (breakout confirmation)
🔴 Stop Loss: 0.70751 (below flag & swing low)
🟢 Take Profit: 0.74126 (supply zone)
As always, patience is key. We do not chase — we wait for the market to come to our level and confirm before entering.
Not financial advice. Trade your own plan. Bitcoin to $98,000? Daily Flag Breakout Puts BTC Back in Focus
Bitcoin is showing an interesting development on the daily chart.
After reclaiming the 200 EMA, BTC spent the following sessions consolidating inside a downward-sloping structure. Following the latest strong upward move, price now appears to be breaking above the upper boundary of that consolidation.
This raises an obvious question:
Could Bitcoin be preparing for a move toward $94,000–$98,000?
Possibly — but there are several important things to watch before getting too confident about that scenario.
📊 The 200 EMA Changed the Picture
Before focusing on the current breakout, the 200 EMA deserves attention.
Bitcoin previously moved above this long-term moving average and has remained above it while the recent consolidation developed.
On this chart, the 200 EMA is currently around the $73,000 area.
That doesn’t mean $73K must hold if Bitcoin returns there. Moving averages are not guaranteed support levels.
But if BTC experiences a deeper correction, the interaction with the 200 EMA would be an important part of the technical picture.
A successful hold could support the broader bullish structure.
A decisive move back below it would require us to reassess that structure.
🚩 A Potential Flag Breakout
Following the strong upward impulse from the August lows, Bitcoin began moving inside a relatively tight downward-sloping channel.
This created a flag-like consolidation.
Now price appears to have pushed above the upper boundary of that structure, following another strong bullish daily move.
That is constructive from a technical perspective.
But there is an important distinction:
A breakout is not the same as a guaranteed continuation.
Price can break a trendline and return immediately inside the previous structure. False breakouts happen regularly, particularly in volatile markets such as Bitcoin.
For that reason, the next reaction may be just as important as the breakout itself.
🔄 Don’t Ignore the Possibility of a Retest
After a breakout, many traders immediately focus on higher targets.
But the market doesn’t have to move directly upward.
Bitcoin could return toward the former upper boundary of the flag and test whether that area can hold.
That would give us additional information.
If former resistance begins acting as support and buyers respond, the bullish continuation scenario becomes more interesting.
If price falls back into the flag and remains there, the breakout would look considerably weaker.
And if the correction becomes much deeper, attention would eventually shift back toward the 200 EMA around $73K.
Again, none of these levels should be treated as automatic entry points.
The reaction matters more than the level itself.
🎯 $94K and $98K: Areas to Watch, Not Predictions
If Bitcoin successfully holds the breakout and momentum continues, the chart shows two particularly interesting higher areas:
$94,000
$98,000
These should not be interpreted as guaranteed targets.
They are simply potential areas of interest within the bullish scenario.
From the current structure, the bullish roadmap could therefore look approximately like this:
200 EMA reclaimed → Flag consolidation → Breakout → Possible retest → Potential continuation toward $94K–$98K
But every step depends on what price actually does next.
Technical analysis is not about drawing an arrow toward $98K and assuming Bitcoin will follow it.
The arrow represents a scenario, not a forecast.
⚠️ What Could Go Wrong?
This is where caution becomes especially important.
Bitcoin has already made a strong upward move. After sharp moves, volatility can increase and short-term pullbacks can become aggressive.
Several alternative scenarios remain possible.
BTC could retest the breakout before continuing.
It could move sideways and build another consolidation.
The current breakout could fail completely.
Or the market could experience a deeper correction toward the 200 EMA.
That’s why chasing a strong candle simply because a technical pattern appears to have broken can be dangerous.
The objective should be to observe how the market behaves after the breakout.
🧠 Analysis, Not Prediction
The purpose of this chart isn’t to claim:
“Bitcoin is going to $98,000.”
A more useful question is:
“What would need to happen for $94K–$98K to become increasingly relevant?”
Right now, the daily structure gives us a framework:
Bullish scenario: The breakout holds and BTC maintains strength above the previous flag structure. The $94K and $98K areas become increasingly relevant.
Retest scenario: BTC returns toward the breakout area. We observe whether buyers defend it.
Deeper correction: Attention shifts toward lower support areas and potentially the 200 EMA around $73K.
Failed breakout: Price moves decisively back into the previous structure, forcing us to reassess the bullish thesis.
We don’t have to predict which one happens.
We can prepare for all of them.
🎓 Building a Process Instead of Predicting Markets
This type of scenario-based chart analysis is also part of what we work through in our courses: combining market structure, trendlines, moving averages and key price levels to create a plan before the market moves.
The objective isn’t to give someone a prediction or tell them where Bitcoin will go next.
It’s to learn how to look at a chart independently, identify different possibilities, define what would support or invalidate an idea, and then reassess as new price action develops.
Because good analysis isn’t about being certain.
It’s about being prepared when you’re wrong.
📊 Bitcoin to $98K — or retest first?
The breakout makes the bullish scenario interesting, but the next reaction could tell us much more.
Do you think BTC continues toward $94K–$98K from here, or does the market retest the breakout first? 👇
Educational content only. This is technical analysis, not financial or investment advice. Cryptocurrency markets are volatile and involve substantial risk.  Long
Long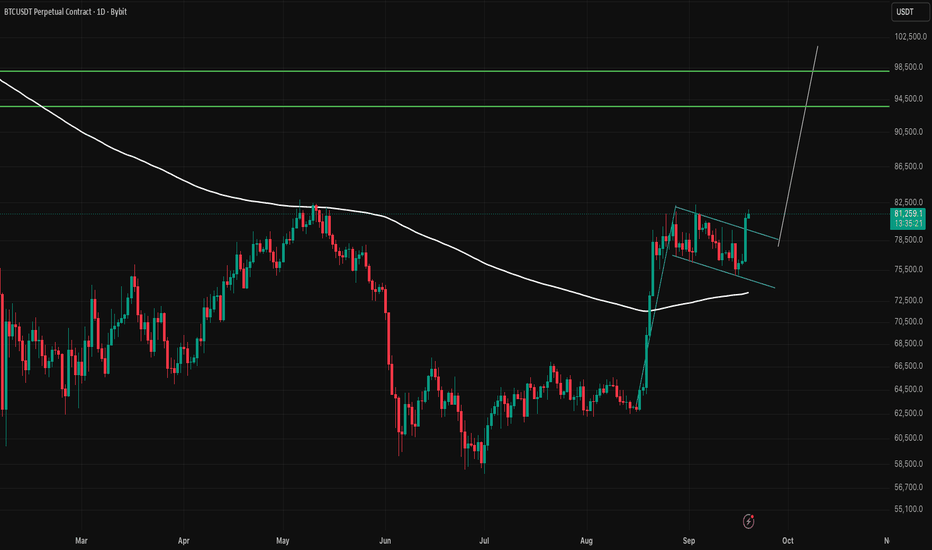
 Long
Long
 Long
Long
How I did a 1-week swing trade on BTC after a clear bullish flagAfter a 1-year downtrend on BTC, it finally broke out of a long-term descending trendline - this can be seen in a weekly chart if you zoom out.
BTC clearly started trending sideways like a bullish flag, which made me accumulate coins between Sep 8 and 17. I targeted my favourite coins at the moment personally - BTC, ETH, XRP, SOL, ADA, AVAX and QNT. My target of at least a 5% increase was achieved for all my trades.
In case you want to go deeper into technical analysis and my thought process:
1 - At first I spotted an ascending channel (blue rectangles)
2 - This channel started getting squeezed, forming a bullish pennant (black lines). This is when I started buying.
3 - When the pennant failed, I kept holding because there was a big support around 75-76k
4 - BTC could not close below 75500 even with bad news (clarity act), and it formed a falling wedge (yellow lines)
5 - BTC finally broke out, continuing its bullish trend since July 1st
6 - Now BTC is retesting 82k and most likely it will breakout
During these 3 patterns, all of them told me the same type of formation - BULLISH FLAG. In case you don't know, flags are not always descending like the textbook ones: they form in 3 directions - ascending, descending or flat.
Conclusion: BTC was clearly showing a bullish formation and it paid off.
I wish I could add pics or links to show the before and after but TradingView does not allow it. I hope you enjoyed it and please engage if you did!
Long 
APARINDS - Pole & Flag BreakoutAPAR Industries is one of India's largest manufacturers of conductors, cables, and specialty transformer oils — a direct beneficiary of India's accelerating power transmission and grid modernisation capex cycle.
📊 Key Numbers (TTM / Latest):
Revenue: ₹24,389 Cr (+24% YoY)
Net Profit: ₹1,182 Cr (+34% YoY)
Q1 FY27 PAT: ₹467 Cr (+77.8% YoY) ← accelerating
ROCE: ~29.8% | ROE: ~18.1%
Operating Margin: 8.85% (expanding)
Conductor Order Book: ₹10,190 Cr (strong revenue visibility)
💰 Valuation:
TTM P/E: ~63x (elevated vs. 5Y avg of ~37x)
PEG: ~1.9x — growth is priced in, but earnings trajectory justifies the premium
🏦 Ownership (Constructive):
Promoter: 55.42% | Zero Pledge ✅
Mutual Funds: 22.28% (+2.76% YoY)
FII: 11.36% (+2.30% YoY) — rising
Total Institutional: 36.24% (+5.4pp YoY) — smart money accumulating
⚠️ Risk: High valuation leaves little room for an earnings miss. Monitor operating cash flow vs. profit growth and working capital as scale increases.
📈 TECHNICAL SETUP — Daily Chart
Pattern: Pole & Flag (Bullish Continuation)
CMP: ₹18,858 | +5.94% breakout today on elevated volume (271.8K)
The stock formed a strong impulse pole in late July–early August, followed by a consolidating flag channel drifting slightly lower through August–September. Today's breakout above the upper flag boundary on high volume is the confirmation signal.
🎯 Targets:
R1: ₹20,000 (first resistance / round number)
R2: ₹21,150 (prior swing resistance)
R3: ₹23,130 (pole projection / extended target)
🛡️ Support & Stop:
Flag Base / Stop Loss: ₹17,075
Reversal Zone (strong demand): ₹16,015 – ₹17,075
Invalidation: Sustained close below ₹16,015
🔑 SUMMARY
Fundamentally strong business (ROCE ~30%, PAT +77% in Q1 FY27, rising institutional ownership) breaking out technically from a classic Pole & Flag on strong volume. The convergence of quality fundamentals and a clean chart setup makes this a high-conviction idea for positional traders.
Watch ₹20,000 closely — how price reacts at R1 will signal whether this breakout has legs for R2 and R3.
Disclaimer: aliceblueonline.com  Long
Long

USD/CAD: Bullish Flag After the NewsAfter last night’s news and speeches, FX:USDCAD USD/CAD continued its previous bullish trend.
The move was strong, but since the Asian session, price has entered a period of consolidation and is now forming a Bullish Flag on the M15 timeframe.
For me, this is an important part of the setup.
A strong move followed by a controlled correction can create the conditions for another continuation. But the flag itself is not an entry signal.
I want the market to prove that buyers are still in control.
Trading Setup
Main Scenario — Bullish Continuation
I’m watching for a clean breakout from the upper boundary of the flag.
The preferred sequence is:
Breakout → Retest → Bullish Price Action → Entry
A strong breakout without a retest can still work, but chasing the first candle is not the approach I prefer.
If price breaks the flag and successfully holds the broken resistance as support, the continuation setup becomes more interesting.
Alternative Scenario
If the flag breaks to the downside and price starts accepting below the structure, the bullish continuation setup loses strength.
In that case, I would rather reassess the market than force a long position.
A corrective flag can become a reversal structure if buyers fail to defend it.
Why the Market Is Interesting Now
The latest move came after the Federal Reserve raised its policy rate by 25 basis points to 3.75%–4.00%. The decision initially strengthened the U.S. Dollar, with the Dollar reaching a seven-week high before giving back part of the move.
CXM:DOLLAR USD/ BMFBOVESPA:CAD1! CAD is also sensitive to oil because Canada is a major oil exporter. Recent weakness in oil prices has removed some support for the Canadian Dollar, while the Fed's more hawkish stance has supported the U.S. Dollar.
That gives us an interesting combination to watch:
Fed → USD strength
Oil → CAD strength/weakness
Price Action → Confirmation
The fundamental picture can support the directional idea, but the entry still comes from the chart.
My Approach
I don't want to buy simply because the trend is bullish.
I want to see the correction finish.
Bullish Flag
→ Breakout
→ Retest
→ Confirmation
If that sequence appears, the setup becomes much cleaner.
If the structure breaks down, we reassess.
The market has already made its move.
Now I want to see what it does with the consolidation.
Risk Warning: This analysis is for educational purposes only and is not financial advice. Forex trading involves substantial risk, particularly when leverage is used. Always define your risk before entering a position. Gold: H4 Head & Shoulders Is Now Becoming a Real Trading BiasTwo days ago, we published the H4 Head & Shoulders structure on Gold and highlighted the neckline breakdown as an important signal for the larger direction.
Now, after the Federal Reserve's decision and Chair Kevin Warsh's press conference, the setup deserves another look.
The Fed raised rates by 25 basis points to 3.75%–4.00%, while its latest projections pointed to the possibility of another hike this year.
Policymakers also raised their 2026 inflation projection to 3.7%, keeping the focus firmly on persistent inflation.
From our reading of the statement and the tone of the press conference, the short-term environment has become more supportive of the bearish Gold scenario.
But there is one important problem:
The market is extremely volatile right now.
This is exactly the type of environment where being directionally correct does not automatically mean having a good entry.
Gold can move hundreds of points, retrace sharply, and then continue in the original direction.
So I don't want to chase the first reaction.
H4 Structure
The larger technical picture remains:
Head & Shoulders → Neckline Break → Bearish Bias
The structure we identified two days ago remains active.
Short-Term Target: 4111
Pattern Target: 3900
Invalidation: 4454
The 4111 area remains the first major downside objective, while 3900 is the measured target of the H4 pattern.
Current Trading Plan
For now, I would divide the plan into two parts:
H4:
Defines the main direction → Bearish
H1 / Lower Timeframes:
Defines the actual trade → Look for Sell setups
The ideal situation would be a pullback after the initial reaction , followed by bearish price action, rejection, liquidity sweep or a clear lower-timeframe structure.
That gives us a much better risk/reward opportunity than simply selling into a fast candle.
The Important Scenario
If Gold continues lower and the H1 structure confirms the bearish move, we can continue looking toward 4111.
If the larger H4 structure continues to play out, 3900 remains the pattern target.
But if Gold strongly reclaims the broken structure and eventually breaks 4454, the bearish idea is invalid and we reassess.
Don't marry the analysis. Trade the structure.
What Changed After the Fed?
The Fed's decision itself was largely expected by markets.
Before the announcement, traders had already priced a very high probability of a 25bp hike.
The more important part for traders was the message about what comes next.
The new projections show another possible hike in 2026, while inflation is expected to remain above the 2% target for longer.
That combination can keep pressure on Gold through the Dollar and Treasury yields, particularly in the short term.
However, Gold's reaction has also shown why we should not simplify the market to “ higher rates = Gold down. ” Earlier today, Gold actually rallied as yields and oil declined, and it later remained relatively resilient despite the Fed hike.
So the macro picture supports the bearish scenario but does not guarantee the path.
Final View
The H4 Head & Shoulders that we identified two days ago has now become more relevant from a directional perspective.
Bias: Bearish
Target 1: 4111
Pattern Target: 3900
Invalidation: 4454
But right now, patience matters more than prediction.
The market is emotional after the Fed.
If you want to act, use smaller risk.
If you want better execution, wait for the volatility to settle and let H1 confirm the entry.
The H4 chart tells us where the market may be going.
The lower timeframe tells us when we should participate.
⚠️ Risk Warning: This is educational market analysis, not financial advice. Gold can experience extreme volatility around central-bank decisions and macroeconomic releases. Use appropriate position sizing and define your invalidation before entering a trade.  Short
Short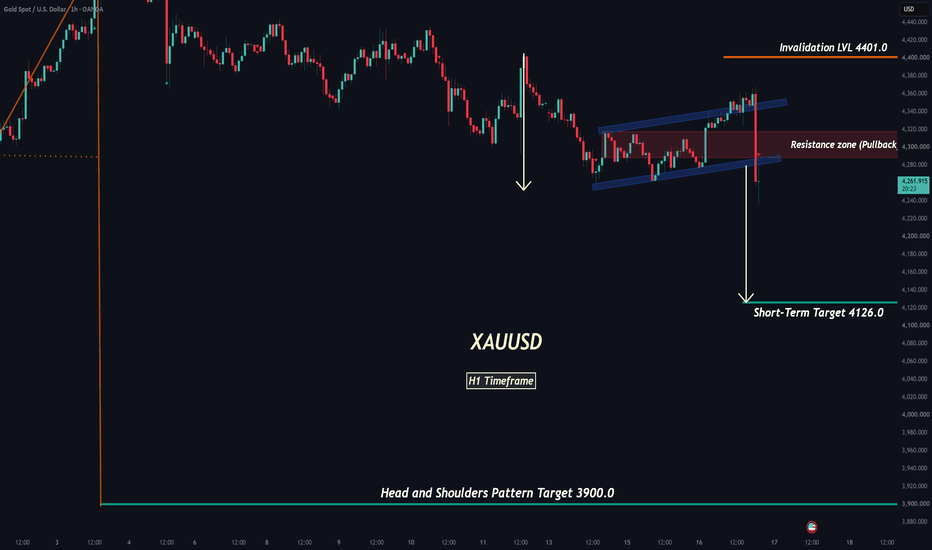
 Long
Long
 Long
Long

 Long
Long

 Short
Short

 Long
Long