Gann
Fibo backward Count (Weekly)Counting backwards from last week, we find these curious alignments with Fibo intervals.
I'm not expecting a big reversal yet because bigger cycles come due more towards December and January 2027, but a short-term reaction or acceleration could be seen.
October is also a Fibo projection from several Hs and ls on a monthly level (see my other idea).
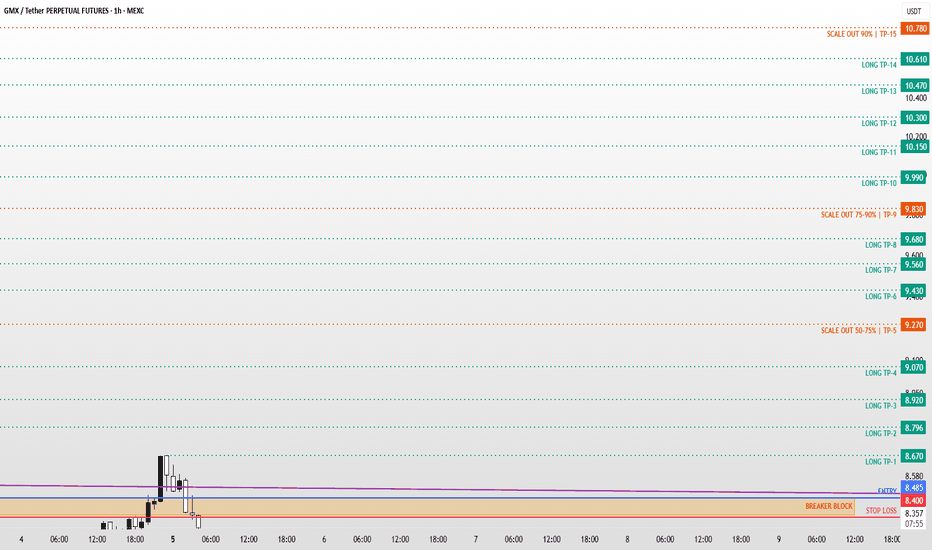
GMX / GMXUSDT Long Setup | Breaker Block ReclaimMARKET ANALYSIS
GMX is currently reacting from a key technical area highlighted on the chart.
As long as the protected support zone remains intact, the bullish market structure remains valid and higher liquidity targets may continue to attract price action.
A breakdown below the invalidation level would weaken the current bullish scenario and require a reassessment of market conditions.
📍 Entry, Stop Loss and Take Profit levels are marked directly on the chart.
━━━━━━━━━━━━━━
⚠️ DISCLA
BIGTIME / BIGTIMEUSDT Long Setup | Breaker Block ReclaimMARKET ANALYSIS
BIGTIME is currently reacting from a key technical area highlighted on the chart.
As long as the protected support zone remains intact, the bullish market structure remains valid and higher liquidity targets may continue to attract price action.
A breakdown below the invalidation level would weaken the current bullish scenario and require a reassessment of market conditions.
📍 Entry, Stop Loss and Take Profit levels are marked directly on the chart.
━━━━━━━━━━━━━━
⚠️ DI
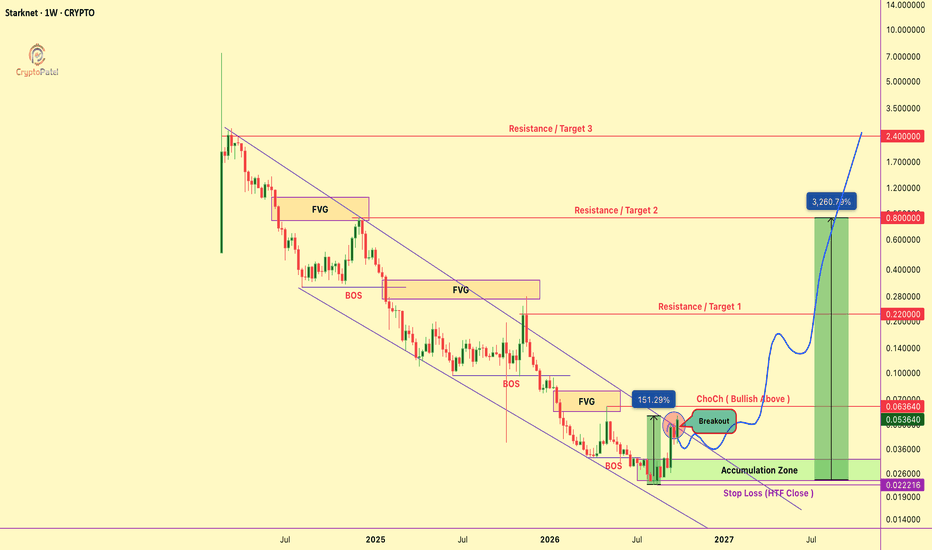
$STRK PRICE PREDICTION: Massive Weekly Breakout Signals 3,000% ?NASDAQ:STRK PRICE PREDICTION: Massive Weekly Breakout Signals 3,000%+ Rally?
NASDAQ:STRK just smashed its 2.5-year descending channel with +150% Rally in Just Months. Is the Starknet bottom finally IN?
✅ Accumulation zone $0.032–$0.023 holding
✅ 151% rally from lows
✅ Weekly close above $0.0636 = bullish ChoCh
STRK targets: $0.22 → $0.80 → $2.40
SL: $0.022 (HTF close)
TA Only. NFA. DYOR.
BTC Trendline Break | A Gann-Inspired PerspectiveBitcoin’s lower channel boundary supported the major lows in 2018, March 2020, and late 2022. In 2026, price slipped below it and is now testing that boundary again.
I think this trendline will fail, and this retest will lead to another leg lower. My expectation is that former support becomes resistance, confirming the breakdown.
Gann warned about a fourth test breaking through after previous tests held. His original rule referred to the same price level; I’m applying that concept here to a ri
Trading Roadmap | Gann · Lesson 07 — Price and Time in BalanceLesson 07 - Price and Time in Balance
Difficulty: (Intermediate)
Six lessons have measured price and time separately. This one puts them on the same scale and asks the question Gann considered the most important on any chart: has this move travelled as far as it has lasted? A leg where the two match is in balance. A leg where one runs ahead of the other is telling you something about its character — and the point where they come back into balance is, in Gann's framework, where a move most
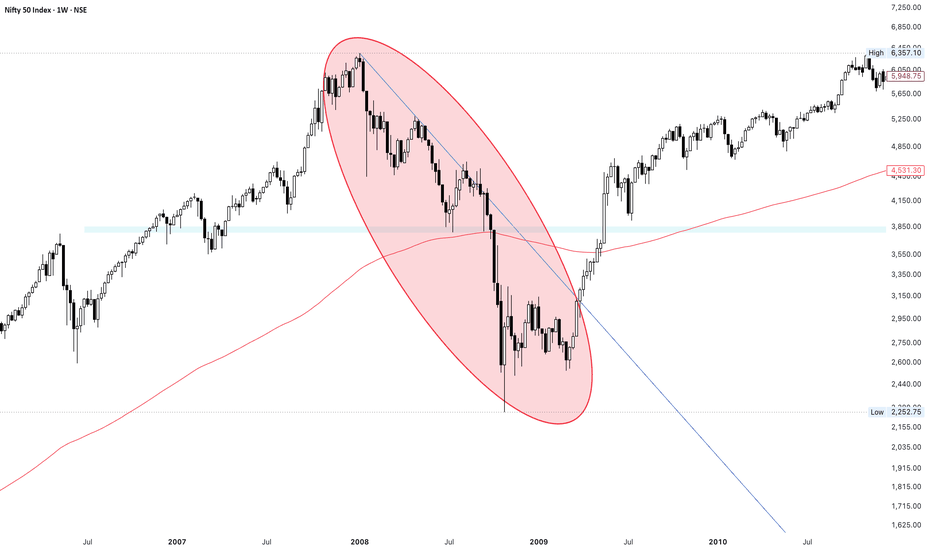
Risk Management is the Key in TradingToday i had a chance to explain about the 2008, One year crash which is like yesterday, where traders were very optimistic and was expecting the market to touch 10,000 levels. Many bought with out knowing the risk, took loans, borrowed money and added in to the trades. within. period of 6-8 weeks the market tumbled down and tons of people exited trading during that time. I was a trader during that time and could still remember how important Risk management is in trading. Manage your risk and tra
Daily Gann Fan 1x1 to Reference this cycleDaily Gann Fan 1x1 to Reference this cycle
Calculation
high − low = full range:
0.000061000−0.000000268=0.000060732
Bars between them: 529
Price change per bar for the 1×1 line:
0.000060732 / 529 = 0.0000001148
Lock the price-to-bar ratio at 0.0000001
1×1 is the 45° line (1 price unit per bar)
__
Weekly 1x1
Weekly Gann Fan 1x8 to Reference this cycleWeekly Gann Fan 1x8 to Reference this cycle
Calculation
Weekly high − weekly low = full range:
0.000061000−0.000000268=0.000060732
Weekly Calculation
* Weekly low: 0.000000268
* Weekly high: 0.000061000
* Full range: 0.000060732
* Bars between them: 75 (weeks)
Price change per bar for the 1×1 line:
0.000060732 / 75 = 0.0000008097
Lock the price-to-bar ratio at 0.00000080
1×1 is the 45° line (1 price unit per bar)
(1×8 is the 7.5° line (1 price unit per 8 bars)
__
1x1
www.tradingview.com
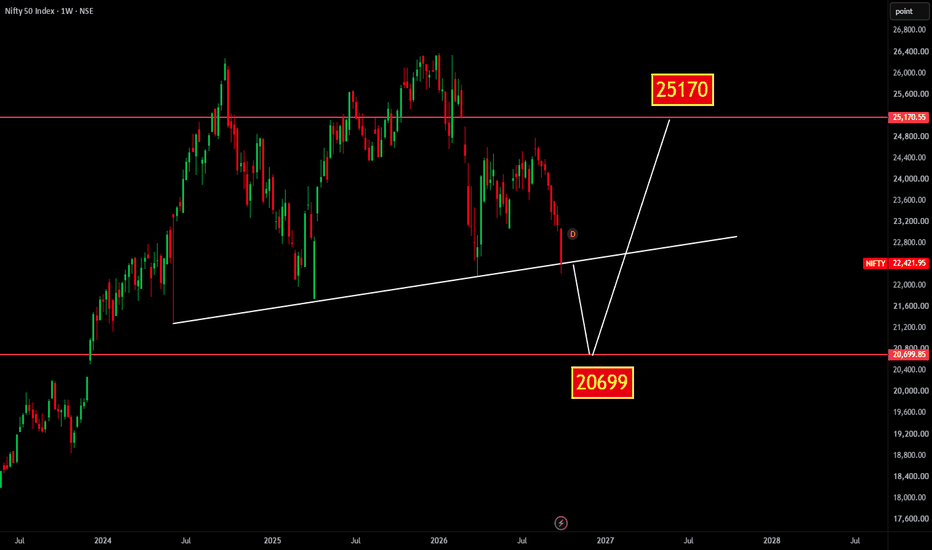
OKTOBER 2026 TDX LevelsOktober 2026 TDX Levels
Dear Colleagues,
Please find attached the TDX analysis for October.
Last week, the Nifty index declined below 22,222, completing its bearish cycle. However, Nifty futures reached a low of 22,321, which does not confirm the end of the bearish phase. For the cycle to be considered complete, Nifty futures would need to fall below 22,222. Otherwise, any subsequent recovery may be viewed as a short-covering rally unless the index manages to stay above 22,500 and later cross
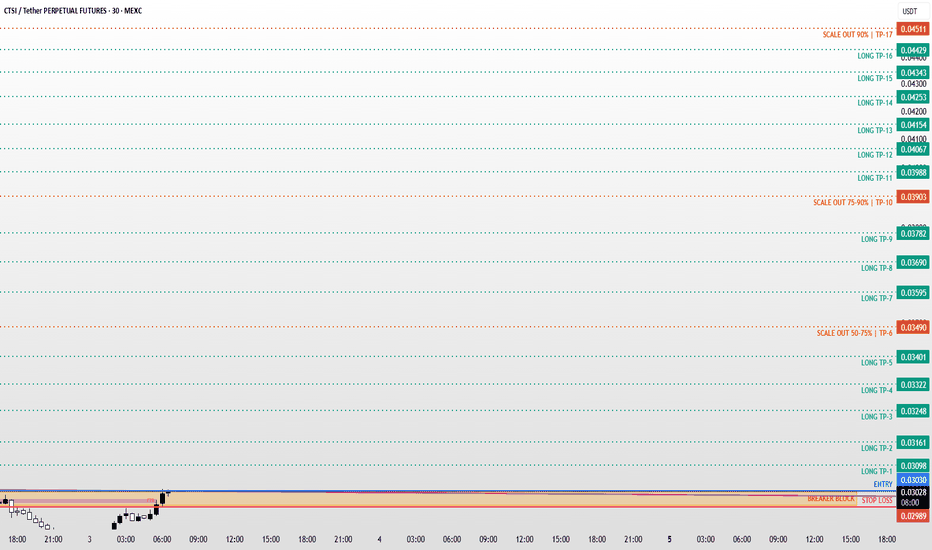
CTSI / CTSIUSDT Long Setup | Breaker Block ReclaimMARKET ANALYSIS
CTSI is currently reacting from a key technical area highlighted on the chart.
As long as the protected support zone remains intact, the bullish market structure remains valid and higher liquidity targets may continue to attract price action.
A breakdown below the invalidation level would weaken the current bullish scenario and require a reassessment of market conditions.
📍 Entry, Stop Loss and Take Profit levels are marked directly on the chart.
━━━━━━━━━━━━━━
⚠️ DISCL
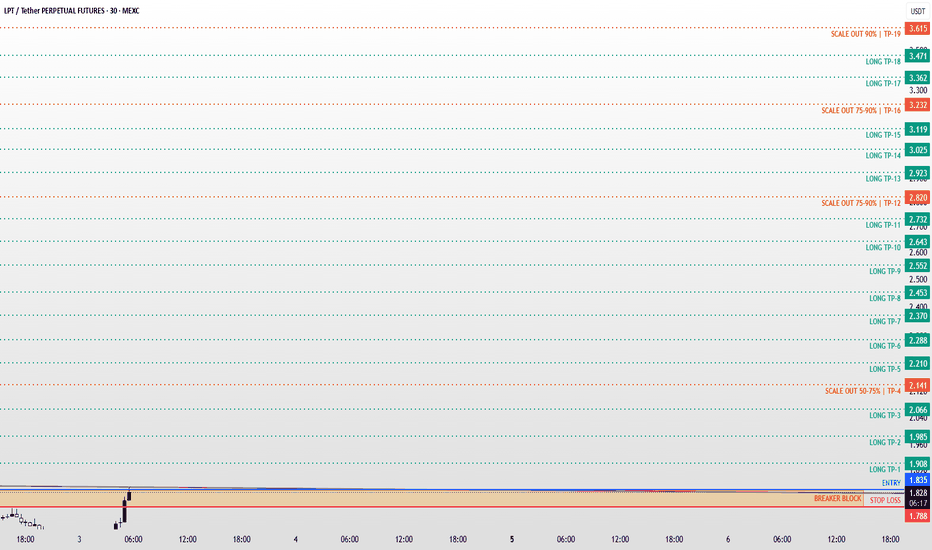
LPT / LPTUSDT Bullish Setup | Futures Trade IdeaMARKET ANALYSIS
LPT is currently reacting from a key technical area highlighted on the chart.
As long as the protected support zone remains intact, the bullish market structure remains valid and higher liquidity targets may continue to attract price action.
A breakdown below the invalidation level would weaken the current bullish scenario and require a reassessment of market conditions.
📍 Entry, Stop Loss and Take Profit levels are marked directly on the chart.
━━━━━━━━━━━━━━
⚠️ DISCLA
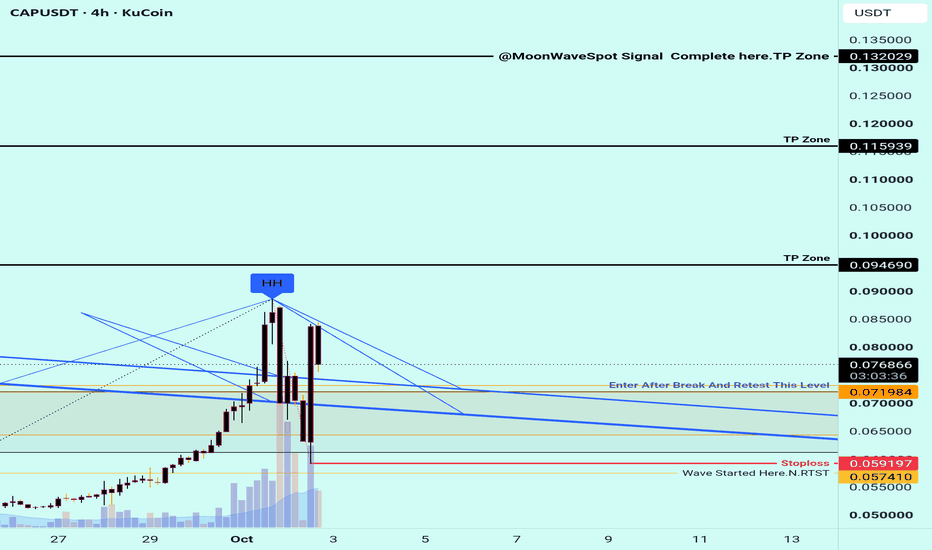
CAP — Key Market Structure After Strong ExpansionCAP — Key Market Structure After Strong Expansion | Breakout or Consolidation?
CAP is the native token of Cap, an Ethereum-based DeFi credit protocol designed to connect on-chain capital with real-world borrowers through a system of collateralized underwriters and financial guarantees. The protocol focuses on stablecoin yield and private credit infrastructure.
From a fundamental perspective, Cap reported $272M TVL and $41.9M in outstanding loans in Q2 2026, with active borrowers increasing 33%
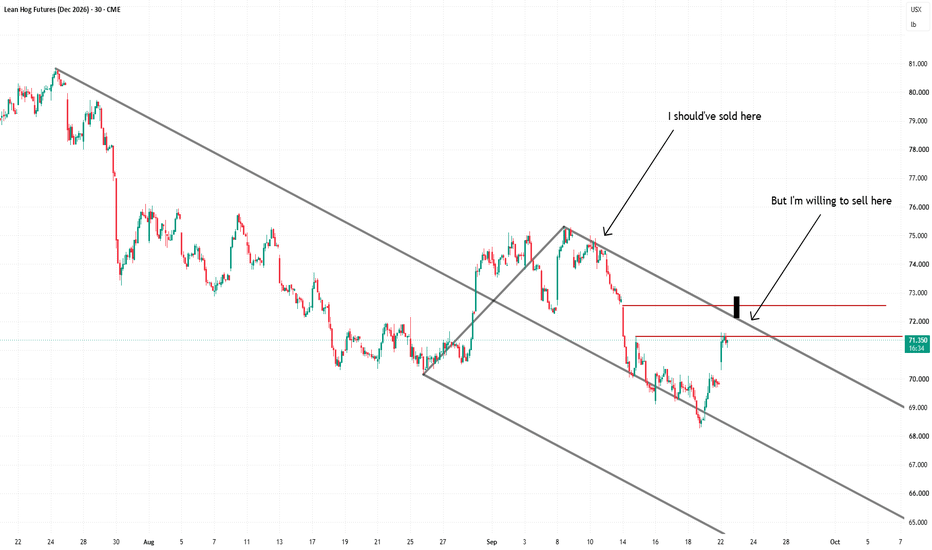
If it goes up, I sell – Lean Hogs 30mThe stop loss is the black rectangle. That is 30 ticks = $300.
That is the maximum stop. The minimum is 15 ticks = $150.
The take profit is a minimum of 3:1.
The price needs to move up toward resistance to sell, and a stop needs to be placed above a previous high.
The trade aims to follow the trend and trade it; fade the pullback against the trend.
Trading with the trend gives an inherent edge.
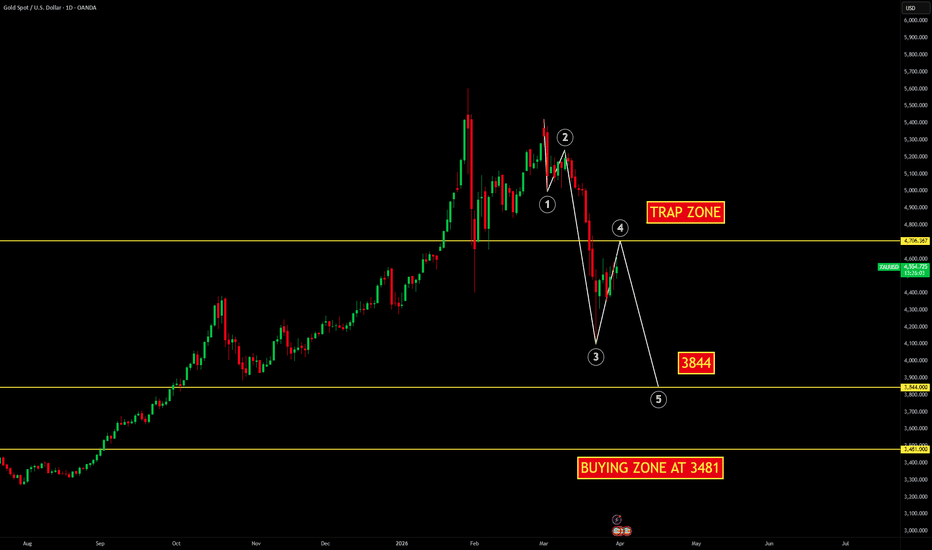
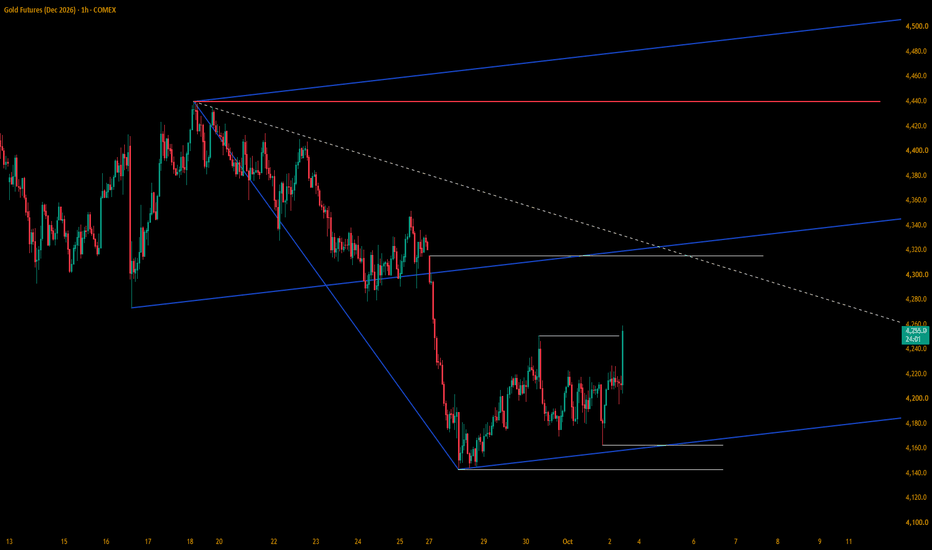
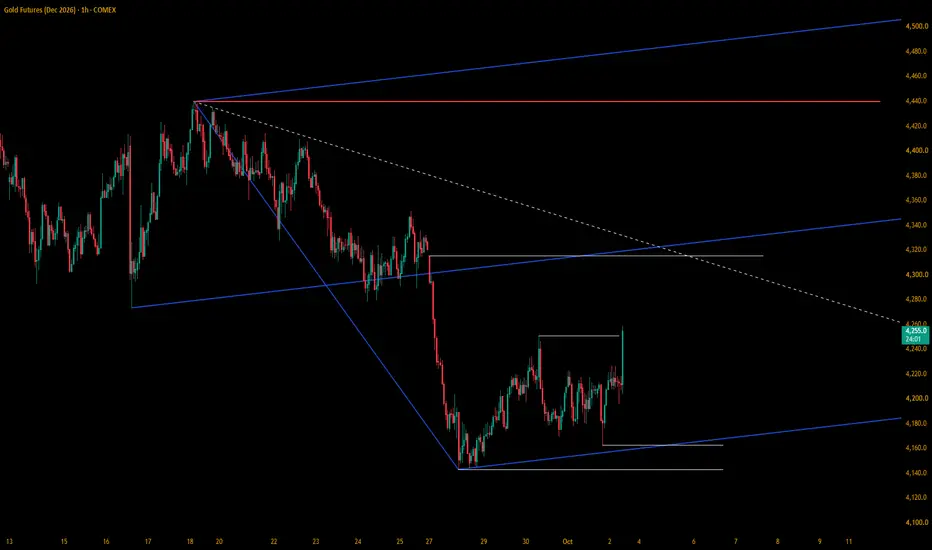
Gold ReversalTo me, the downside directional energy is exhausted and this market is ready to go up or for it to be viable to buy a pullback at support.
At the same time, I doubt it will reach the gap and drop back down.
At least now with this information I maintain a "bullish" outlook that "promises" to have chances of reaching the upper red line.
EURAUD Bullish – Strong Support Inside Ascending ChannelEURAUD at 1Hour time frame is trading inside an Ascending Channel and currently at its dynamic support trendline, which also aligns with the 0.618 Fibonacci pocket. This gives a strong technical area for a potential bullish continuation.
Seasonals
Seasonality is bullish until 10th October, supporting the current bullish bias.
This is not financial advice. Do your own research. Position sizing and managing risk is key even after strong analysis.
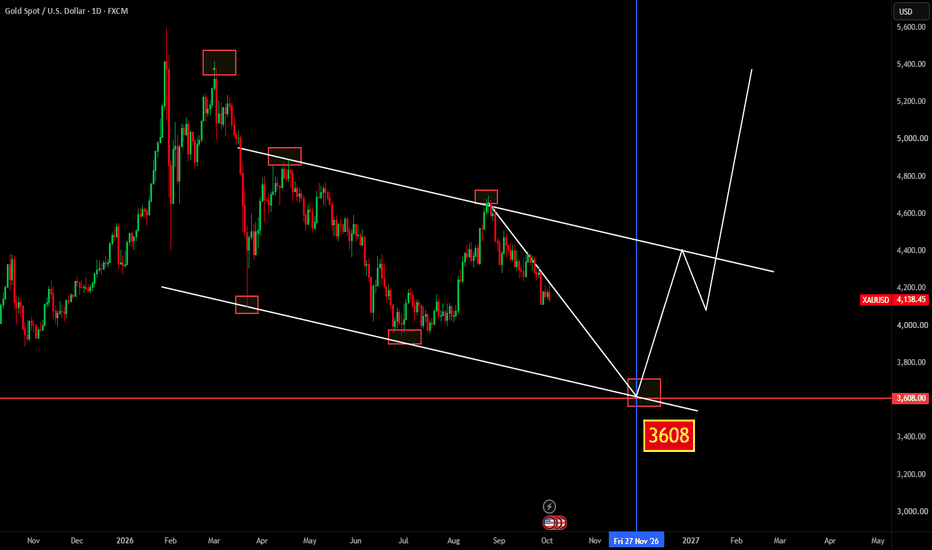
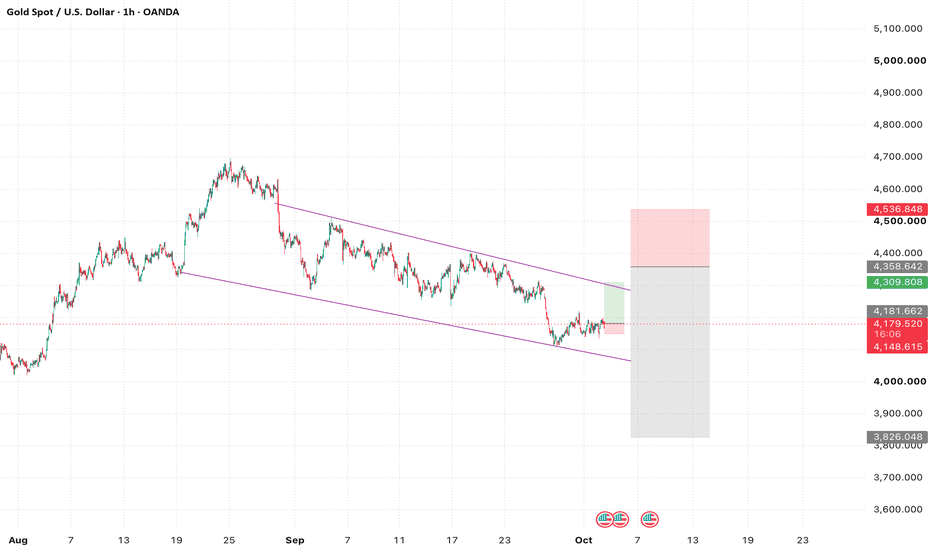
XAUUSD — NFP Liquidity Sweep Before Bearish ContinuationXAUUSD | 1H — NFP Setup
Gold remains within a broader descending channel, and the current structure continues to favor bearish continuation.
The idea is to use the high volatility expected from the NFP release to create a temporary bullish expansion.
The scenario:
1. NFP triggers a strong bullish move in Gold.
2. Price pushes higher to fill the unfilled Monday gap / imbalance.
3. The bullish move takes liquidity above the recent highs and reaches the upper area of the descending channel.
4.
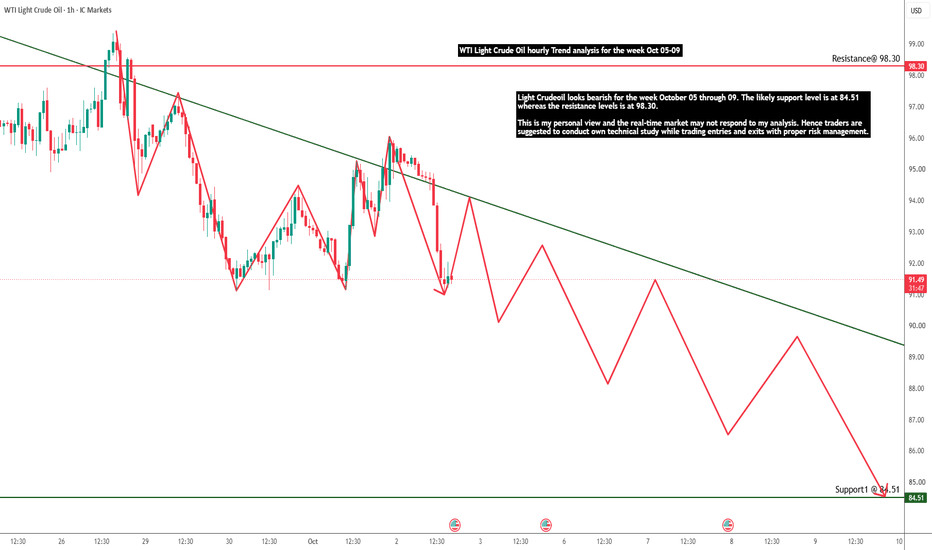
Light Crude Oil hourly trend analysis for the week Oct 05-09WTI Light Crude oil looks bearish for the week October 05 through 09. The likely support level is at 84.51 whereas the resistance levels is at 98.30.
This is my personal view and the real-time market may not respond to my analysis. Hence traders are suggested to conduct own technical study while trading entries and exits with proper risk management.
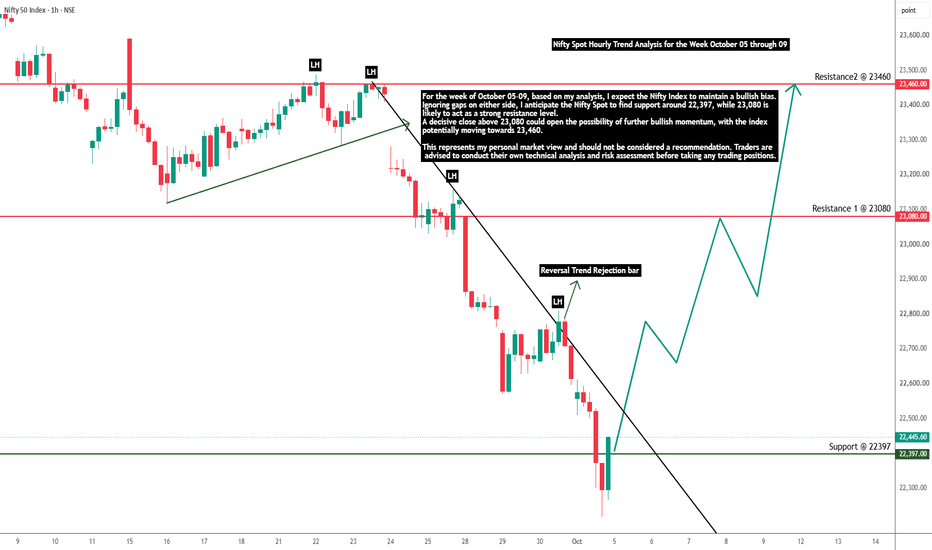
Nifty Spot Index hourly analysis for the week Oct 05-09For the week of October 05–09, based on my analysis, I expect the Nifty Index to maintain a bullish bias. Ignoring gaps on either side, I anticipate the Nifty Spot to find support around 22,397, while 23,080 is likely to act as a strong resistance level. A decisive close above 23,080 could open the possibility of further bullish momentum, with the index
potentially moving towards 23,460.
This represents my personal market view and should not be considered a recommendation. Traders are advised