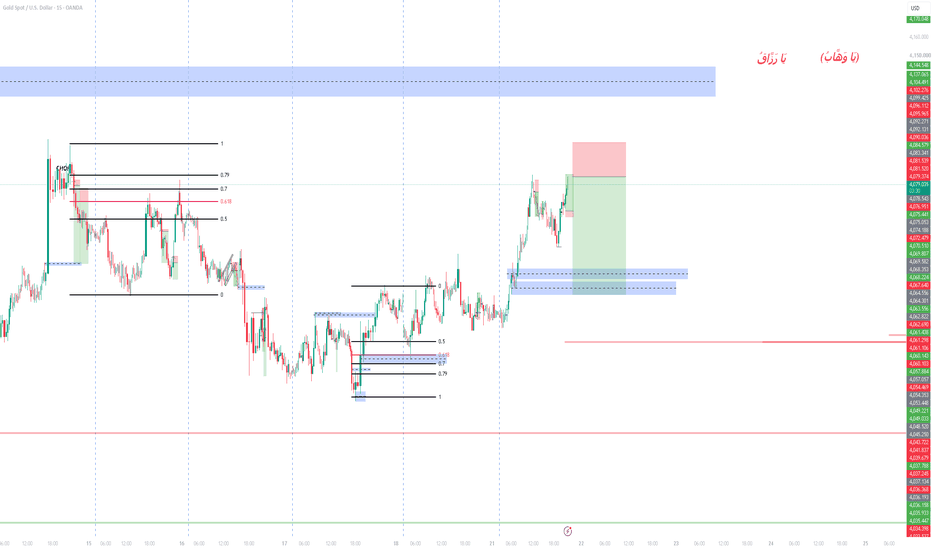
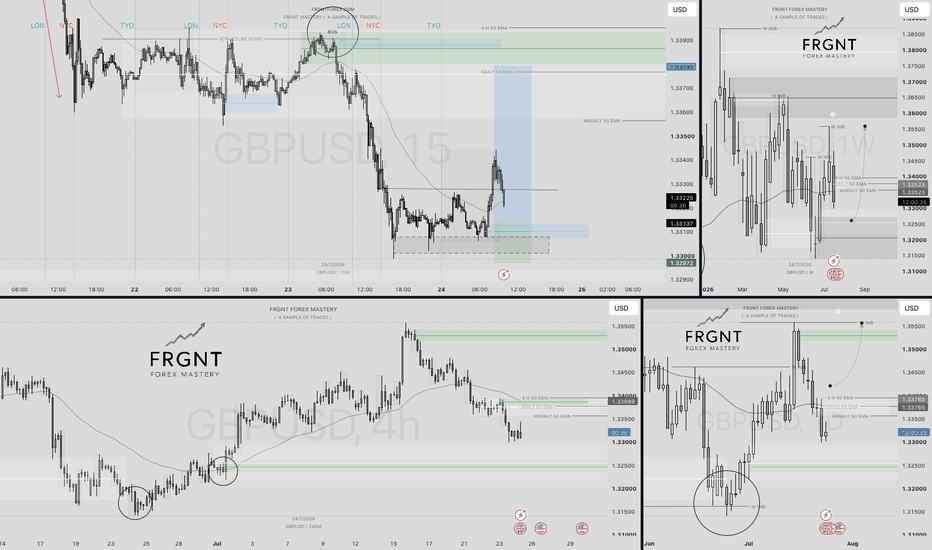
| THINK BEFORE YOU TRADE | FRGNT DAILY CHART ANALYSIS📈| Q3 | W30 | D24 | Y26 |
📊| THINK BEFORE YOU TRADE | FRGNT DAILY CHART ANALYSIS
This forecast is built using an advanced adaptation of Smart Money Concepts, with a structured and disciplined approach:
• Marking Key Points of Interest (POIs) on Higher Time Frames (HTFs) 🕰️
• Defining a clear, controlled trading range from those zones 📐
• Refining entries on Lower Time Frames (LTFs) 🔎
• Waiting for confirmed Break of Structure (BoS) before execution ✅
This process ensures precision, removes emotional decision-making, and keeps me aligned with the overall market narrative.
💡 Core Philosophy
“Capital management, discipline, and consistency create longevity.”
A strong risk-to-reward model, paired with high-probability execution, is the foundation of sustainable trading 📈🔐
⚠️ Understanding Losses
"Losses are part of the game" — a mathematical certainty 🎲
They don’t define performance. Nor do they define you as a Trader.
They are managed, reviewed, and used as evidence for growth 📊
🙏 Final Note
Appreciate you taking the time to review today’s forecast.
Stay disciplined 🎯
Protect your capital 🔐
— FRGNT 🚀📈
📌 Disclaimer
This content is provided for educational purposes only and does not constitute financial advice.
It reflects my personal approach to the markets — a tested framework that has supported my own journey toward consistent profitability in currency trading.
Please understand that any forecasts shared are not financial advice. I will be looking for confirmation in line with my setup model and specific entry criteria from the key areas identified on the chart.
All analysis, whether presented via image or video, is shared strictly for educational insight and is not intended to breach any TradingView House Rules.
 Long
Long
BTC Rejects 65.5K - Risk-Off Cascade - Jul 24 AMCurrent Price & Time:
BTC is trading at 65133 USDT as of 2026-07-24 02:16 UTC.
Multi-Timeframe Structure:
Daily structure remains bullish with price above the MA30 at 63054 and the EMA55 not yet in play, but momentum divergence is evident as RSI sits at 54.76 after a rejection from the 66K zone. The 4H timeframe is bearish: price is below the MA5 and MA10, with RSI at 28.99, deep into oversold territory. The 1H structure is bearish: price is below the EMA55 at 65493.61, with only 0 out of 8 hourly closes above that line, confirming a trending bearish regime. The 15M shows a minor bounce attempt with MA5 crossing above MA10, but RSI at 45.99 remains below 50, indicating weak momentum. The overall structure is bearish with a potential for a liquidity cascade if key support fails.
Chart Signals:
The 4H MACD histogram is deeply negative at -178.67, with DIF at 27.77 and DEA at 206.44, signaling strong bearish momentum divergence from the daily uptrend. The 1H MACD histogram is positive at 40.73, but DIF remains negative at -172.72, suggesting a short-term bounce within a larger downtrend. RSI on the 4H at 28.99 is below 30, indicating oversold conditions that could trigger a mean reversion, but price action shows a long upper wick on the 1H candle at 65250, confirming resistance at the EMA55 zone. The daily chart shows a bearish engulfing pattern from the 66.5K rejection, with a long upper wick on July 22, reinforcing the momentum failure at the supply zone.
Key Liquidity Levels (Demand/Supply):
Demand (Support): 64800 (prior 4H swing low), 64200 (July 21 low)
Supply (Resistance): 65493 (1H EMA55), 65800 (4H MA5/MA10 confluence)
Chart Markup Guide for this setup:
- Draw a horizontal dashed line at 65493.61 — this is your bull/bear pivot on the 1H.
- Mark the Demand zone between 64800 and 64200 with a green rectangle.
- Mark the Supply zone between 65493 and 65800 with a red rectangle.
- Watch for a 15m close below 64800 as the trigger for the short scenario.
Scenario Analysis (If-Then):
- If BTC holds above 64800 and reclaims the 1H EMA55 at 65493 with two consecutive hourly closes, then upside target is 65800, then 66500. This would require a momentum divergence on the 4H RSI rising from below 30, which is currently oversold.
- If BTC breaks below 64800, then downside target is 64200, then 63500. A break below 64800 would confirm a liquidity cascade, as stop-losses from long positions accumulate below the prior swing low.
Trading Plan:
Direction: Bearish bias below 65493
Entry: Short on a 15m close below 64800 with confirmation of a long upper wick or topping pattern on the 5M.
Stop-Loss: 65550 (above the 1H EMA55 and recent rejection zone)
Target-1: 64200
Target-2: 63500
Risk-Reward Ratio: 1:2.5 (assuming entry at 64800, stop at 65550, target at 63500)
Invalidation Level:
A 1H close above 65550 would invalidate the bearish setup, as it would indicate a false breakdown and a potential positioning squeeze back toward 66500. Additionally, if the 4H RSI rises above 35 without a new low, the momentum divergence would favor a bullish reversal.
Disclaimer:
This analysis is for informational and educational purposes only. It does not constitute financial advice. Past performance is not indicative of future results. All trading decisions carry risk and are your sole responsibility.
📊 QilanX Backtest Reference
🕒 Last Backtest: 07-24 07:00:02
Total Signals: 3167 Backtested: 2387 Accuracy: 77% (1837/2387)  Short
Short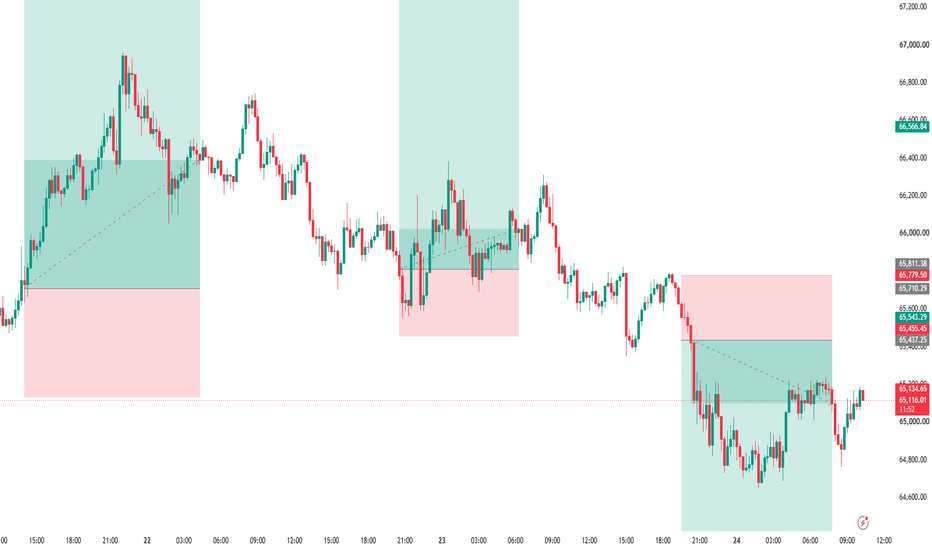
Gold 4H Trendline Test and Bullish Structure
The chart starts with a clearly defined bearish phase. Price continues to move downward through a sequence of lower highs and lower lows, showing that sellers had strong control during the earlier part of the move. The bearish candles are not random; each downward push confirms that supply was active and that buyers were not yet strong enough to reverse the broader direction.
After this decline, the market begins to show its first attempt at recovery. Several bullish candles appear, creating a corrective move against the previous bearish trend. However, this early recovery does not immediately change the full market direction. The price fails to break the major lower high, which shows that the move is still more of a reaction than a confirmed reversal. This is an important lesson for traders: a bullish candle inside a downtrend does not automatically mean that the trend has changed.
The first bullish shift in structure appears when price begins to break above a minor swing point. This is an early sign that selling pressure may be weakening. Buyers start defending lower price areas more actively, and the market begins to create the first signs of stronger demand. Still, this stage requires patience. Experienced traders usually do not rely on one isolated structural change; they wait for more confirmation from candle behavior, higher lows and reaction around key levels.
The first Change of Character marks an important transition in short-term order flow. It shows that the market is no longer moving with the same clean bearish rhythm as before. This type of shift often happens after liquidity has been collected below previous lows. Once liquidity is taken, price may begin to reverse if buyers step in with enough strength. However, a Change of Character becomes more useful when it is supported by strong bullish closes, demand defense and continuation above important internal levels.
Following this shift, price forms a Higher Low. This part of the chart is important because the candle behavior begins to change. Bearish candles become less aggressive, while bullish candles start closing with better strength. This suggests that sellers are losing control and buyers are gradually becoming more active. The Higher Low becomes a sign that demand is starting to build beneath the market.
Price then pushes upward toward the previous Lower High. Even though buyers show improvement, the broader descending trendline continues to act as resistance. This shows that higher-timeframe structure still matters. A short-term bullish move can be strong, but if price remains below a major trendline, the market may still reject and return to a corrective phase.
After reaching the Lower High area, gold reacts lower again. Bearish candles return, and the market continues to respect the internal bearish structure for a period of time. The failure to create a clean higher high confirms that sellers are still present near trendline resistance. This is why trading directly into a major trendline without confirmation can be risky.
In the middle part of the chart, price moves into a more compressed range. Candle bodies become smaller, while wicks appear on both sides. This type of movement often reflects indecision, liquidity building or position accumulation before a larger move develops. The market is no longer trending aggressively, but it is preparing for a potential expansion once enough liquidity has been collected.
Later, another Change of Character appears as buyers regain short-term control. Bullish candles begin closing above previous candle highs, which shows a stronger reaction from demand. This stage suggests that buyers are no longer only reacting from lows; they are beginning to challenge internal resistance and shift momentum back to the upside.
The next Higher Low confirms that demand is being defended again. This matters because a bullish structure requires more than one strong candle. It needs buyers to protect pullbacks and prevent price from forming new bearish lows. When higher lows begin to appear consistently, the probability of bullish continuation improves.
Near the right side of the chart, another bullish market structure shift develops as price breaks internal resistance. This is a more important signal because buyers are now doing more than creating temporary recoveries. They are beginning to change the structure of the market itself. This kind of shift is often watched closely by traders who study Smart Money Concepts and liquidity-based price action.
The recent bullish candles are also stronger than the earlier recovery candles. Their size and closing strength suggest that demand has increased. Instead of weak buying or uncertain movement, the candles show more decisive participation. This creates a stronger bullish narrative, especially while price remains above the latest protected demand area.
Price is now moving toward the long-term descending trendline. This trendline has acted as dynamic resistance for several weeks and remains one of the most important areas on the chart. A professional approach would be to wait for confirmation instead of assuming that price will break it immediately. A clean close above the trendline would provide stronger evidence that the market is shifting into a broader bullish phase.
The projected pullback shown on the chart represents a common continuation scenario. If price breaks above resistance, it may return to test the breakout area before continuing higher. This type of retest often removes weak positions and gives stronger participants a better area to build or add exposure. In educational analysis, this is one of the cleaner ways to study continuation after a structural breakout.
The 4,112 area is an important confirmation level. If price breaks above this region and continues to hold it as support, the bullish scenario becomes stronger. Previous resistance turning into support is often one of the clearest signs that market structure is improving.
The 4,204 level is the next major resistance zone. This area may create a pause, rejection or temporary consolidation if sellers defend supply there. However, if strong bullish candles close above 4,204, it would suggest that buyers still have control and that the market may continue toward higher liquidity areas.
The 4,374 level is the main bullish objective shown on this educational chart. This area represents a higher-timeframe liquidity target where profit-taking or institutional activity may appear. Price often reacts around such levels because they attract attention from both buyers and sellers. Whether the market continues beyond that point or rejects from it will depend on the strength of the price action at the time.
This type of structured analysis is also why many traders prefer to study the relationship between candles, liquidity and market structure rather than focusing only on indicators. In the context of royalispower Reviews, this kind of educational breakdown can help users understand why platform clarity, chart structure and market tools matter when analyzing price behavior.
Every candle on this chart adds something to the broader story. Large bearish candles show periods of strong selling pressure. Strong bullish candles show where buyers regain confidence. Small candles with long wicks often reveal indecision, liquidity collection or temporary balance between both sides. None of these candles should be studied in isolation. The stronger approach is to read how they interact with support, resistance, trendlines, liquidity pools, Higher Lows, Lower Highs, BOS, CHoCH and major confirmation levels.
The main lesson from this XAUUSD 4H chart is that market structure should guide the analysis. Rather than predicting every move, traders can wait for confirmation, respect the higher-timeframe trendline, observe how price reacts around important levels and manage risk with discipline.
If gold holds above 4,112, the bullish case remains more constructive. A move into 4,204 would be the next area to watch, while 4,374 remains the larger upside target if momentum continues. As always, the strongest setups usually come from patience, confirmation and a clear understanding of where the trade idea becomes invalid.
Educational content only. This analysis is not financial advice. Market conditions can change quickly, and every trader should use personal research, risk management and independent judgment before making decisions. For readers comparing platform-based educational content through royalispower Reviews, structured market analysis like this shows the value of clear chart interpretation, disciplined planning and realistic expectations. Short 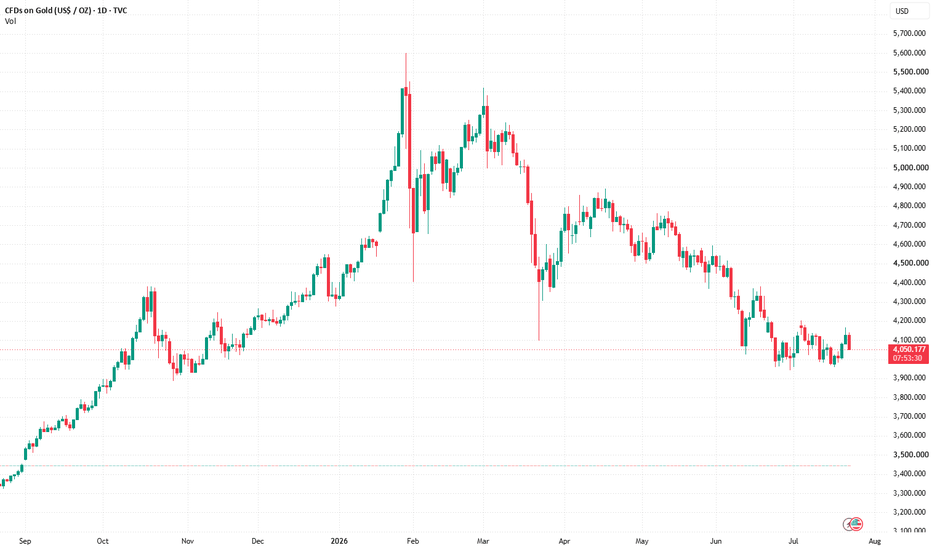
 Long
Long
BTC Holds 66K - Momentum Divergence - Jul 22 PMCurrent Price & Time:
BTC is trading at 66231 USDT as of 2026-07-22 17:04 UTC.
Multi-Timeframe Structure:
Daily structure remains bullish. Price is trading above the 1D EMA55 at 62844, with the MA5 at 65519 acting as near-term dynamic support. The 4H timeframe shows a mixed structure. Price is above the 4H EMA55 at 65181, but the MACD histogram is negative at -11.33, indicating waning bullish momentum. The 1H timeframe is the key pivot. Price is above the 1H EMA55 at 65837, with 6 out of the last 8 hourly closes above this line. However, the 1H MACD histogram is negative at -4.37, and the RSI sits at a neutral 50.44. This suggests a consolidation phase within a broader bullish trend, but with a clear risk of a short-term pullback if momentum fails to re-accelerate.
Chart Signals:
The 1H MACD histogram is contracting from a negative reading, which can be interpreted as a potential bullish divergence if price makes a lower low while the histogram prints a higher low. The 15M timeframe shows a positive MACD crossover with a rising histogram, indicating short-term buying pressure. The RSI on the 15M is at 61.88, not yet overbought, allowing room for further upside. The key signal to watch is whether the 1H MACD can cross above its signal line, which would confirm a shift from bearish to neutral momentum. The price action is currently forming a tight range between the 1H MA5 and MA30, suggesting a coiled spring setup.
Key Liquidity Levels (Demand/Supply):
Demand (Support): 65837 (1H EMA55), 65181 (4H EMA55)
Supply (Resistance): 66255 (4H MA10), 66700 (recent rejection zone from Jul 21)
Chart Markup Guide for this setup:
Draw a horizontal dashed line at 65837 — this is your bull/bear pivot for the 1H timeframe.
Mark the Demand zone between 65837 and 65519 (1D MA5) with a green rectangle.
Mark the Supply zone between 66255 and 66700 with a red rectangle.
Watch for a 15m close above 66255 as the trigger for the long scenario.
Scenario Analysis (If-Then):
If BTC holds above the 1H EMA55 at 65837 and produces a 15M close above 66255, then the upside target is the 66700 resistance zone, followed by a potential liquidity cascade toward 67500.
If BTC breaks below 65837 with two consecutive hourly closes, then the downside target is the 4H EMA55 at 65181, and then the 1D MA5 at 65519. A break below 65181 would signal a positioning squeeze, targeting the 64000 area.
Trading Plan:
Direction: Bullish bias above 65837, bearish bias below 65837.
Entry: Long on a 15M close above 66255 with confirmation of momentum divergence on the 1H MACD.
Stop-Loss: 65750 (below the 1H EMA55 and recent swing low).
Target-1: 66700.
Target-2: 67500.
Risk-Reward Ratio: 1:2.5 (based on entry at 66255, stop at 65750, target-1 at 66700).
Invalidation Level:
A 1H close below 65500 would invalidate the bullish setup. This would indicate a failure of the mean reversion pattern and a shift to a bearish regime on the 4H timeframe. The data suggests that a break below this level would create a risk-reward asymmetry favoring shorts.
Disclaimer:
This analysis is for informational and educational purposes only. It does not constitute financial advice. Past performance is not indicative of future results. All trading decisions carry risk and are your sole responsibility.
📊 QilanX Backtest Reference
🕒 Last Backtest: 07-22 07:00:01
Total Signals: 3119 Backtested: 2354 Accuracy: 76.6% (1804/2354) Long 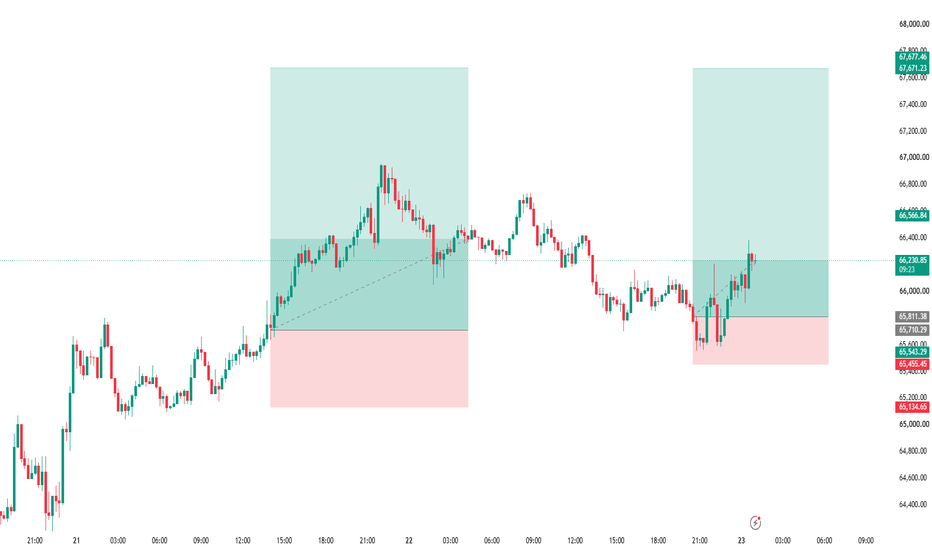
 Short
Short
Long 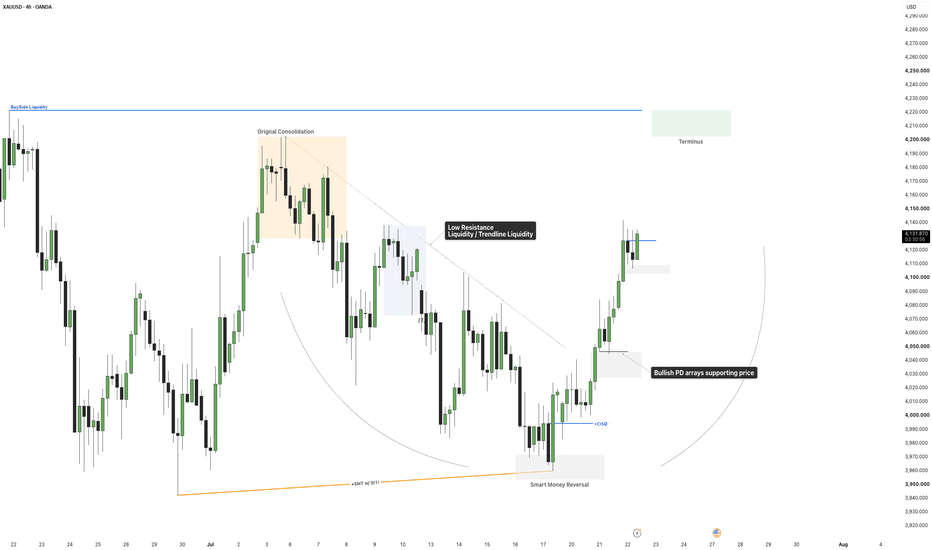
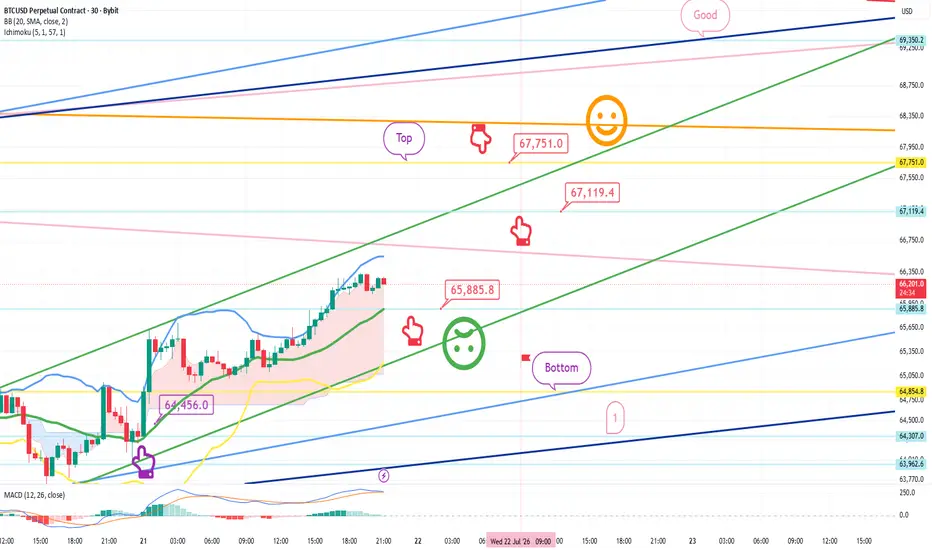
JULY 21 Bitcoin chart analysisHello
It's a Bitcoin Guide.
My analysis is optimized for TradingView.
If you press the Replay button, you can check real-time movements.
This is the Bitcoin 30-minute chart.
In the bottom left, marked by the purple finger, I have connected the strategy exactly to the entry point of the long position I entered yesterday, which was $64,456.
Currently, the price has touched the resistance line on the daily Bollinger Bands for the first time. I proceeded with an aggressive trend-following strategy.
*Long Position Strategy (based on the red finger's movement path)
1) $65,885.8 Long Position Entry Point / Stop Loss if broken below the green support line
2) $67,751 Long Position 1st Target -> Good 2nd Target Price
If the strategy is successful, $67.1K is a zone to utilize for re-entering the long position.
If broken below the green support line, the Bottom indicated at the bottom is open up to a maximum of Zone 1.
Please use my analysis post merely as a reference and for practical application.
I hope you operate safely by strictly adhering to trading principles and using stop loss limits.
Thank you. Long 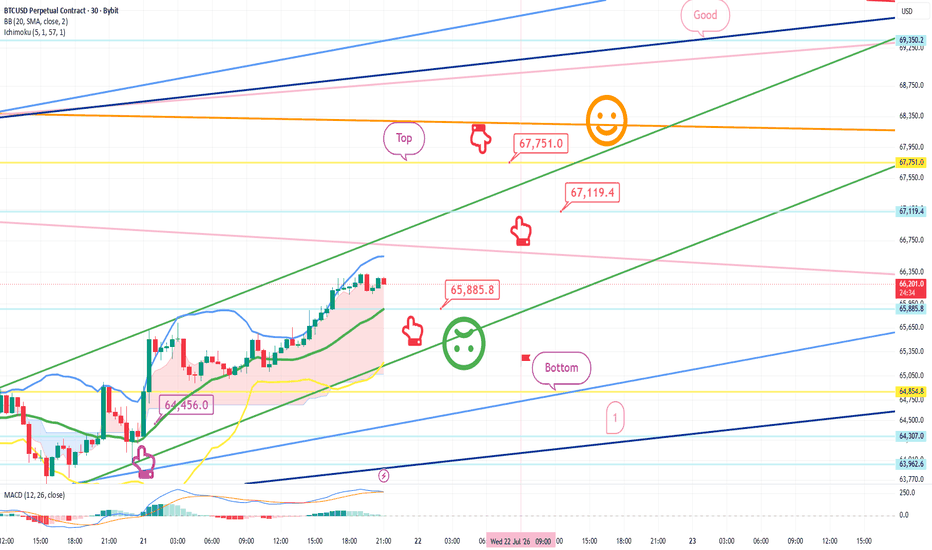
Will gold prices fall after reaching a resistance zone?Yesterday, gold retraced to $4000 before continuing its upward trend. It surged to $4084 in the European session before pulling back, then fell to $4045 in the US session before rising again, closing at $4077, resulting in a significant gain on the daily chart. Today, gold continued its upward trend, breaking above $4100 and currently trading around $4130. The KDJ indicator shows a golden cross, with accompanying indicators turning upwards. The MACD indicator shows a significant increase in upward momentum, indicating a bullish bias on the daily chart.
On the hourly chart, gold retraced to $4074 in the Asian session before rising sharply again. Moving averages are in a bullish alignment, and the MACD indicator's fast and slow lines have crossed above the zero line with an expanding crossover. The MACD histogram is increasing, and the trend indicator is in overbought territory, suggesting that the short-term upside potential for gold may be limited, and a pullback is possible. Given the bullish daily trend, intraday trading should focus on buying on pullbacks, with short-term holdings and selling opportunities. Support levels to watch are the $4100 level.
My recommendations:
BUY: 4085-4090, SL: 4075, TP: 4120-4130
SELL: 4134-4139, SL: 4150, TP: 4110-4100 NIFTY 50 | Weekly Chart | Long-Term Market Analysis📊 The BTR Sell Signal accurately identified the major market correction, with both Target 1 and Target 2 successfully achieved.
This weekly chart demonstrates the importance of following a disciplined trading system. After the BTR Sell Signal appeared near the market highs, NIFTY experienced a sharp decline, validating the bearish setup.
Trade Review
🔴 BTR Sell Signal Triggered
✅ Target 1 Achieved
✅ Target 2 Achieved
🎯 Potential Target 3: 20,799.10 (Only if fresh bearish momentum develops)
🛡️ Stop Loss: 26,373.20
Current Market Outlook
After the correction, NIFTY has entered a broad consolidation phase. The market is attempting to build a base, but it is still trading well below the previous sell zone. Until a fresh bullish confirmation appears, traders should remain patient and allow price action to dictate the next major trend.
💡 Key Lesson:
The biggest profits often come from holding high-probability positions, not from trading every market swing. A disciplined strategy with predefined entries, stop losses, and targets removes emotion and improves consistency over the long run.
⚠️ This analysis is for educational purposes only and should not be considered investment or trading advice.  Short
Short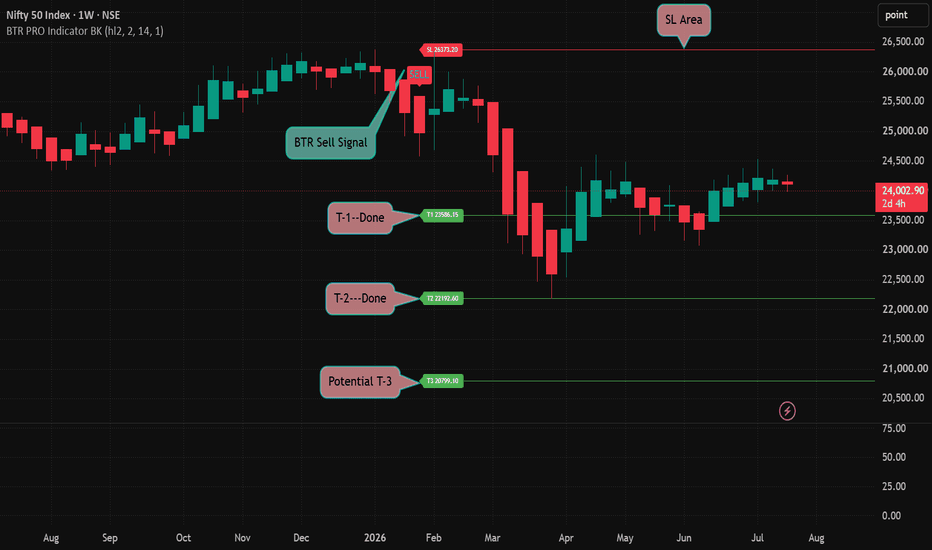
NIFTY SENTIMENT ANALYSIS FOR 22/07/2026📊 NIFTY Daily Sentiment Analysis | 22 July 2026 | Bullish Opening vs Bearish Structure
Most traders see the opening.
Very few try to understand the structure beneath it.
Today's analysis is interesting because the market is presenting two completely different narratives.
Opening Character
🟢 Bullish
⚠️ Trap / Conflict
📉 PE Dominant
The opening may look constructive, but options positioning is already hinting that participants are preparing for a different outcome.
Underlying Direction
🔴 STRONG BEARISH
This doesn't guarantee a bearish day.
It simply tells us that the underlying force is not supporting the optimism created by the opening.
These are the sessions where traders often get trapped chasing the first move.
Market Behaviour
⚡ Explosive
Expect:
• Sharp intraday reversals
• False breakouts
• Liquidity sweeps
• High volatility around key levels
Confirmation is likely to be more important than anticipation.
Key Price Levels
Resistance
🎯 24,201.80
🚧 24,257.80
Opening Anchor
📍 24,145.80
Support
🛡️ 24,033.80
🛡️ 23,977.80
🛡️ 23,960.00
Sector Leadership
🥇 PSU
🥈 Leadership Stocks
🥉 Pharma
Critical Time Windows
🕤 09:25 AM — Opening Decision Window
🕝 02:40 PM — Final Expansion / Reversal Window
The second window is the one I'll be watching most closely.
If the market continues to defend the Opening Anchor (24,145.80) into this period, buyers may attempt another push towards 24,201.80 and 24,257.80.
If the Opening Anchor fails decisively, the bearish structure could accelerate the move towards 24,033.80, followed by 23,977.80.
Trading Roadmap
23,960.00 → 23,977.80 → 24,033.80 → 24,145.80 → 24,201.80 → 24,257.80
Final View
🟢 Opening Character: Bullish
🔴 Underlying Direction: Strong Bearish
⚡ Behaviour: Explosive
⚠️ Market Condition: High Probability of a Bull Trap / Conflict Day
The opening tells you who won the first battle.
The underlying structure tells you who is likely to win the war.
Today, I'm less interested in predicting every candle and more interested in seeing whether Time validates Price.
This analysis is shared before the outcome and is intended purely for educational purposes. It reflects my proprietary Time & Price framework and should not be considered investment advice.  Long
Long
 Short
Short
Short