Long
Long
Gold 4H Trendline Test and Bullish Structure
The chart starts with a clearly defined bearish phase. Price continues to move downward through a sequence of lower highs and lower lows, showing that sellers had strong control during the earlier part of the move. The bearish candles are not random; each downward push confirms that supply was active and that buyers were not yet strong enough to reverse the broader direction.
After this decline, the market begins to show its first attempt at recovery. Several bullish candles appear, creating a corrective move against the previous bearish trend. However, this early recovery does not immediately change the full market direction. The price fails to break the major lower high, which shows that the move is still more of a reaction than a confirmed reversal. This is an important lesson for traders: a bullish candle inside a downtrend does not automatically mean that the trend has changed.
The first bullish shift in structure appears when price begins to break above a minor swing point. This is an early sign that selling pressure may be weakening. Buyers start defending lower price areas more actively, and the market begins to create the first signs of stronger demand. Still, this stage requires patience. Experienced traders usually do not rely on one isolated structural change; they wait for more confirmation from candle behavior, higher lows and reaction around key levels.
The first Change of Character marks an important transition in short-term order flow. It shows that the market is no longer moving with the same clean bearish rhythm as before. This type of shift often happens after liquidity has been collected below previous lows. Once liquidity is taken, price may begin to reverse if buyers step in with enough strength. However, a Change of Character becomes more useful when it is supported by strong bullish closes, demand defense and continuation above important internal levels.
Following this shift, price forms a Higher Low. This part of the chart is important because the candle behavior begins to change. Bearish candles become less aggressive, while bullish candles start closing with better strength. This suggests that sellers are losing control and buyers are gradually becoming more active. The Higher Low becomes a sign that demand is starting to build beneath the market.
Price then pushes upward toward the previous Lower High. Even though buyers show improvement, the broader descending trendline continues to act as resistance. This shows that higher-timeframe structure still matters. A short-term bullish move can be strong, but if price remains below a major trendline, the market may still reject and return to a corrective phase.
After reaching the Lower High area, gold reacts lower again. Bearish candles return, and the market continues to respect the internal bearish structure for a period of time. The failure to create a clean higher high confirms that sellers are still present near trendline resistance. This is why trading directly into a major trendline without confirmation can be risky.
In the middle part of the chart, price moves into a more compressed range. Candle bodies become smaller, while wicks appear on both sides. This type of movement often reflects indecision, liquidity building or position accumulation before a larger move develops. The market is no longer trending aggressively, but it is preparing for a potential expansion once enough liquidity has been collected.
Later, another Change of Character appears as buyers regain short-term control. Bullish candles begin closing above previous candle highs, which shows a stronger reaction from demand. This stage suggests that buyers are no longer only reacting from lows; they are beginning to challenge internal resistance and shift momentum back to the upside.
The next Higher Low confirms that demand is being defended again. This matters because a bullish structure requires more than one strong candle. It needs buyers to protect pullbacks and prevent price from forming new bearish lows. When higher lows begin to appear consistently, the probability of bullish continuation improves.
Near the right side of the chart, another bullish market structure shift develops as price breaks internal resistance. This is a more important signal because buyers are now doing more than creating temporary recoveries. They are beginning to change the structure of the market itself. This kind of shift is often watched closely by traders who study Smart Money Concepts and liquidity-based price action.
The recent bullish candles are also stronger than the earlier recovery candles. Their size and closing strength suggest that demand has increased. Instead of weak buying or uncertain movement, the candles show more decisive participation. This creates a stronger bullish narrative, especially while price remains above the latest protected demand area.
Price is now moving toward the long-term descending trendline. This trendline has acted as dynamic resistance for several weeks and remains one of the most important areas on the chart. A professional approach would be to wait for confirmation instead of assuming that price will break it immediately. A clean close above the trendline would provide stronger evidence that the market is shifting into a broader bullish phase.
The projected pullback shown on the chart represents a common continuation scenario. If price breaks above resistance, it may return to test the breakout area before continuing higher. This type of retest often removes weak positions and gives stronger participants a better area to build or add exposure. In educational analysis, this is one of the cleaner ways to study continuation after a structural breakout.
The 4,112 area is an important confirmation level. If price breaks above this region and continues to hold it as support, the bullish scenario becomes stronger. Previous resistance turning into support is often one of the clearest signs that market structure is improving.
The 4,204 level is the next major resistance zone. This area may create a pause, rejection or temporary consolidation if sellers defend supply there. However, if strong bullish candles close above 4,204, it would suggest that buyers still have control and that the market may continue toward higher liquidity areas.
The 4,374 level is the main bullish objective shown on this educational chart. This area represents a higher-timeframe liquidity target where profit-taking or institutional activity may appear. Price often reacts around such levels because they attract attention from both buyers and sellers. Whether the market continues beyond that point or rejects from it will depend on the strength of the price action at the time.
This type of structured analysis is also why many traders prefer to study the relationship between candles, liquidity and market structure rather than focusing only on indicators. In the context of royalispower Reviews, this kind of educational breakdown can help users understand why platform clarity, chart structure and market tools matter when analyzing price behavior.
Every candle on this chart adds something to the broader story. Large bearish candles show periods of strong selling pressure. Strong bullish candles show where buyers regain confidence. Small candles with long wicks often reveal indecision, liquidity collection or temporary balance between both sides. None of these candles should be studied in isolation. The stronger approach is to read how they interact with support, resistance, trendlines, liquidity pools, Higher Lows, Lower Highs, BOS, CHoCH and major confirmation levels.
The main lesson from this XAUUSD 4H chart is that market structure should guide the analysis. Rather than predicting every move, traders can wait for confirmation, respect the higher-timeframe trendline, observe how price reacts around important levels and manage risk with discipline.
If gold holds above 4,112, the bullish case remains more constructive. A move into 4,204 would be the next area to watch, while 4,374 remains the larger upside target if momentum continues. As always, the strongest setups usually come from patience, confirmation and a clear understanding of where the trade idea becomes invalid.
Educational content only. This analysis is not financial advice. Market conditions can change quickly, and every trader should use personal research, risk management and independent judgment before making decisions. For readers comparing platform-based educational content through royalispower Reviews, structured market analysis like this shows the value of clear chart interpretation, disciplined planning and realistic expectations.  Short
Short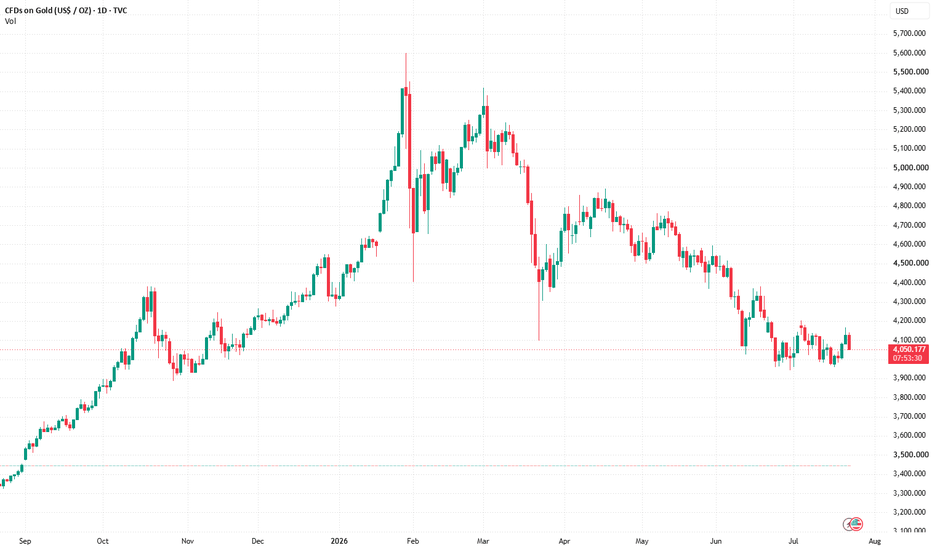
 Long
Long
Long 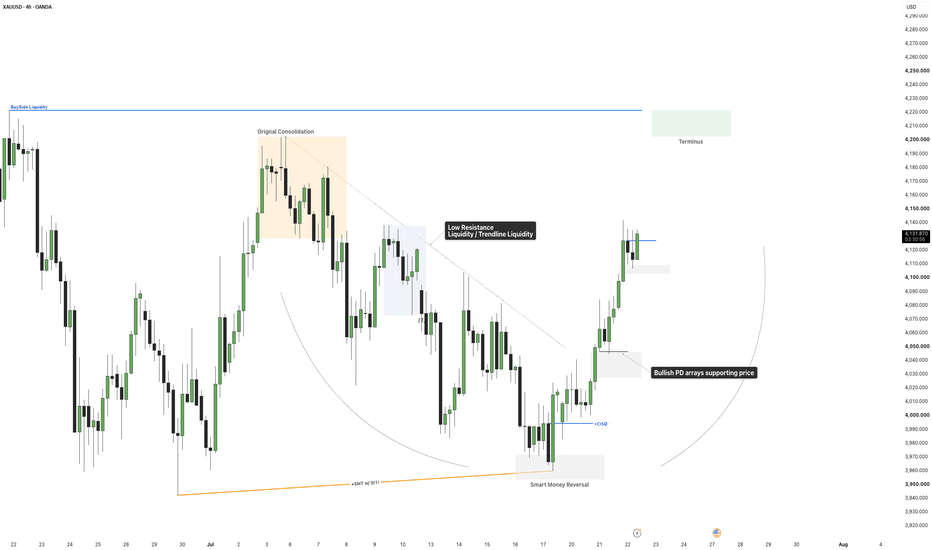
Gold Rebuilds Bullish Momentum Near 4,058.90Gold is starting to show renewed strength around 4,058.90 after forming a clear reversal from the lower support area. The recent reaction suggests that sellers are losing momentum, while buyers are beginning to take control of the structure again.
On the 4-hour OANDA chart, spot gold has respected its major support zone and moved out of the short-term descending wedge. This breakout shifts attention back to the upside, especially while price continues to hold above the key demand area.
At the moment, gold is testing supply near 4,060. A short pause or consolidation here would be normal after the recovery move. If buyers continue defending the current structure, the next upside objective remains the major resistance area around 4,200.
The important point now is patience. Chasing short positions after a clean breakout from higher-timeframe support may carry additional risk, especially while price action continues to build higher. A more balanced approach is to wait for confirmation, manage risk carefully and watch how gold reacts around the current zone.
Trade Parameters:
🛒 Long Zone: 4,040 - 4,065
🛑 Stop-Loss: 4h close below 3,980
💰 Take-Profit: 4,200
If gold keeps holding above the current support structure, the bullish continuation scenario remains active. The move toward 4,200 is still on the table, but disciplined risk management is essential while the market works through this breakout phase. Long 
 Long
Long
 Short
Short
Short 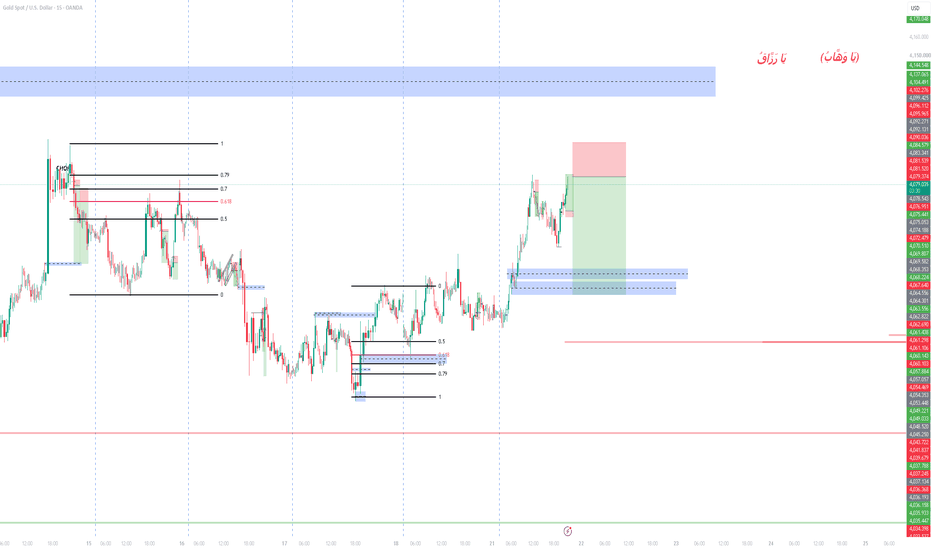
BTC Rejects 67K - Momentum Fading - Jul 21 PMCurrent Price & Time:
BTC is trading at 66591 USDT as of 2026-07-21 15:31 UTC.
Multi-Timeframe Structure:
Daily structure is bullish, with price well above the 1D MA5 at 65066 and the 1D MA30 at 62772. The 4H structure is also bullish, with price above the 4H MA5 at 65989 and the 4H MA30 at 64581. The 1H structure is bullish, with price above the 1H EMA55 at 65324. The oscillation assessment confirms trending behavior, with 8 of the last 8 hourly closes above the EMA55 and zero crossings. The distance from the EMA55 is 1.94%, exceeding the 0.3% threshold for range-bound conditions. The overall multi-timeframe structure is bullish, but the 1H RSI at 81.21 signals overbought conditions, introducing convexity risk.
Chart Signals:
The 1H MACD histogram is positive at 62.55 but has flattened from a recent peak, indicating momentum divergence. The 1H RSI at 81.21 is in overbought territory, suggesting a potential mean reversion. The 15M MACD histogram is negative at -20.60, with the DIF crossing below the DEA, confirming short-term momentum exhaustion. The 15M RSI at 55.72 is neutral, but the divergence between the 1H overbought reading and the 15M negative histogram creates a risk-reward asymmetry favoring a short-term pullback. The recent price action shows a long upper wick on the 1H candle near 66700, which is a topping pattern.
Key Liquidity Levels (Demand/Supply):
Demand (Support): 65324 (1H EMA55), 64581 (4H MA30)
Supply (Resistance): 66717 (15M MA5), 67000 (psychological round number)
Chart Markup Guide for this setup:
- Draw a horizontal dashed line at 65324 (1H EMA55) — this is your bull/bear pivot.
- Mark the Demand zone between 65324 and 64581 with a green rectangle.
- Mark the Supply zone between 66717 and 67000 with a red rectangle.
- Watch for a 15m close below 66456 (15M MA30) as the trigger for the short scenario.
Scenario Analysis (If-Then):
- If BTC holds above 65324 (1H EMA55) and reclaims 66717 (15M MA5), then upside target is 67000, then 67500.
- If BTC breaks below 65324 (1H EMA55), then downside target is 64581 (4H MA30), then 64000.
Trading Plan:
Direction: Bearish bias above 66717, with a short trigger on a 15m close below 66456.
Entry: Short on a 15m close below 66456 (15M MA30), with confirmation from a 15M MACD histogram deepening below -20.
Stop-Loss: 66800 (above the recent 1H high).
Target-1: 65324 (1H EMA55).
Target-2: 64581 (4H MA30).
Risk-Reward Ratio: 1:2.8 (risk 209 points to target 1143 points).
Invalidation Level:
A 15m close above 66800 would invalidate the short setup, as it would signal a rejection of the topping pattern and a continuation of the bullish momentum. A 1H close above 67000 would also invalidate, as it would break the supply zone and suggest a liquidity cascade to the upside.
Disclaimer:
This analysis is for informational and educational purposes only. It does not constitute financial advice. Past performance is not indicative of future results. All trading decisions carry risk and are your sole responsibility.
📊 QilanX Backtest Reference
🕒 Last Backtest: 07-21 07:00:39
Total Signals: 3095 Backtested: 2345 Accuracy: 76.5% (1795/2345)  Long
Long
Gold Breakout Watch: 4100, 4200 and 4350Gold has spent a considerable amount of time moving without a strong directional impulse. Recent price action has remained choppy, with the market shifting between short-term gains and pullbacks rather than forming a clean trend.
Still, the reaction around the 3960–3940 area is important. Over the past week, Gold returned to this zone and buyers responded clearly, showing that this level remains a key area of demand. The market appears unwilling to let price move significantly lower from there, which keeps the broader bullish scenario active.
At the same time, oil prices have continued to rise and reached around $90 overnight. This adds pressure to inflation expectations and may increase interest in assets that are traditionally watched during uncertain economic periods.
With global conditions still unstable and the long-term outlook unclear, Gold may continue attracting attention as traders look for protection and stability. The current structure looks like accumulation, and a confirmed move above the Triangle could open the way toward 4100, 4200, and 4350.
Long 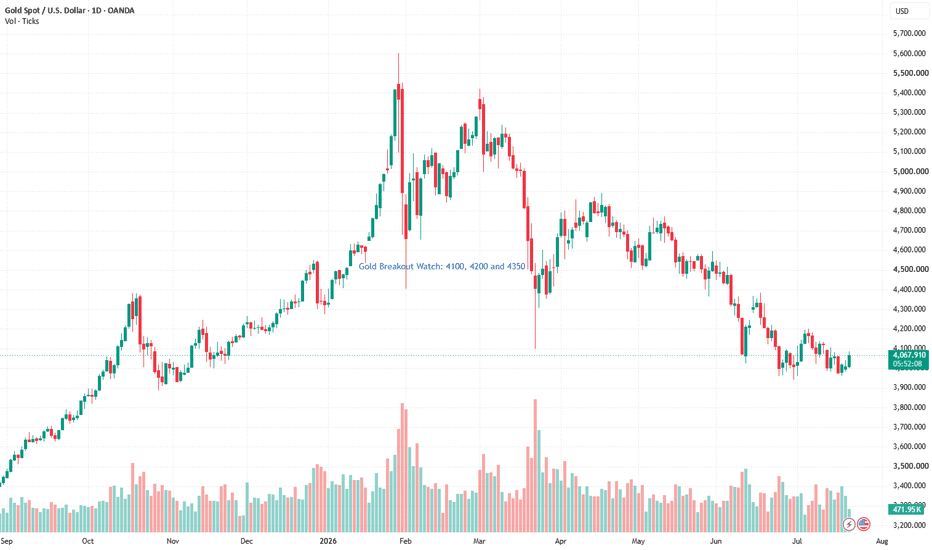
Ripple News: Court Clears $130M Ripple Share SaleLinqto has received U.S. Bankruptcy Court approval to sell approximately $130 million worth of private Ripple shares. The pre-IPO investment platform continues its Chapter 11 restructuring. This deal is part of a wider recovery process for thousands of customers who invested in private companies through the platform.
Major Institutions Buy Ripple Shares
The reported transaction includes Galaxy Digital buying $60 million in Ripple shares. Arrington Capital is buying $50 million. The Private Shares Fund is buying $16 million, and GAM Alternatives Lux is buying $4 million.
Ripple has reportedly waived its right of first refusal, allowing the transfers to proceed. The deal reflects continued institutional demand for exposure to Ripple’s private-market valuation. However, it does not mean Ripple is going public. The transaction has no direct impact on XRP holders or XRP ownership.
The proceeds will support customer recoveries as Linqto winds down its operations.
Linqto Bankruptcy Plan Was Backed by Customers
Linqto filed for Chapter 11 in July 2025 after new management uncovered potential securities-law violations dating back to 2020. This included issues involving the structure of special-purpose vehicles used for customer investments.
The platform had already shut down in March 2025. Its bankruptcy case involves investments linked to around 111 private companies, with the portfolio valued at more than $500 million.
On February 6, 2026, the court approved Linqto’s restructuring plan after roughly 95% of voting customers supported it. The plan offered customers recovery through a liquidating fund holding indirect private-company interests. Alternatively, it offered a publicly listed closed-end fund holding private shares, or a combination of both options.
Forge Dispute Threatens to Delay Customer Recoveries
The recovery process has now run into another legal challenge. According to Bloomberg Law, Linqto and its creditors have sued Forge Global Holdings. The private-market platform allegedly attempted to withdraw as trustee of the customer recovery trust just five days before Linqto planned to launch the trust on July 20.
Forge was expected to hold customer assets, manage transfers and help administer the recovery plan. According to the complaint, Forge cited demands from its new parent company, Charles Schwab, for its decision to back out.
Linqto and the Official Committee of Unsecured Creditors are asking the bankruptcy court to force Forge to honor its agreement. They want Forge to continue serving as trustee.
The dispute could delay asset transfers, increase legal costs and slow customer recoveries. For Linqto users with indirect exposure to Ripple, the case is about how and when their assets are administered. It is not about the validity of Ripple shares or the value of XRP itself.  Short
Short
Liquidity Has Been Taken. Now Watch These Key LevelsMU has recovered well from the 827 demand zone, where buyers absorbed heavy selling and pushed price back above short-term support. The recovery is encouraging, but the real test is still ahead.
What I'm Watching
> Demand Zone: 827-877 remains the strongest buying area.
> Supply Zone: 995-1,010 is where sellers are likely waiting.
> Trendline: Price is still below the descending trendline. A breakout would improve the bullish outlook.
> Volume: Buying volume has increased during the bounce, showing fresh interest from buyers.
> Order Flow: Buyers are becoming more aggressive, while sellers are gradually losing momentum.
Buyer vs Seller
> Buyers are defending higher lows and absorbing sell pressure.
> Sellers still control the higher-timeframe trend until 995 is reclaimed.
> A high-volume breakout above 995 would signal buyers are taking control.
Fundamental View
> AI memory demand and HBM growth continue to support Micron's long-term outlook.
> Data center spending remains a strong catalyst.
> Recent weakness looks more like profit-taking than a deterioration in fundamentals
Key Levels
Support: 877 , 827
Resistance: 995 , 1096
My Plan: I'm not chasing the rally. I'll be watching how price reacts around the 995 supply zone. If buyers absorb the supply with strong volume, i expect momentum to continue toward 1,096. Otherwise, another pullback into demand remains possible.
 Long
Long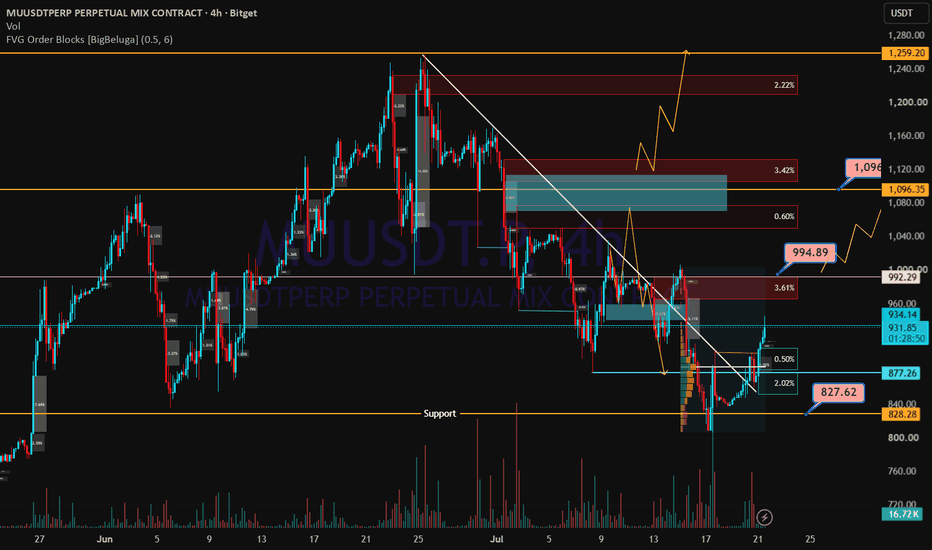
 Long
Long
Long 
Long 
 Long
Long
Long 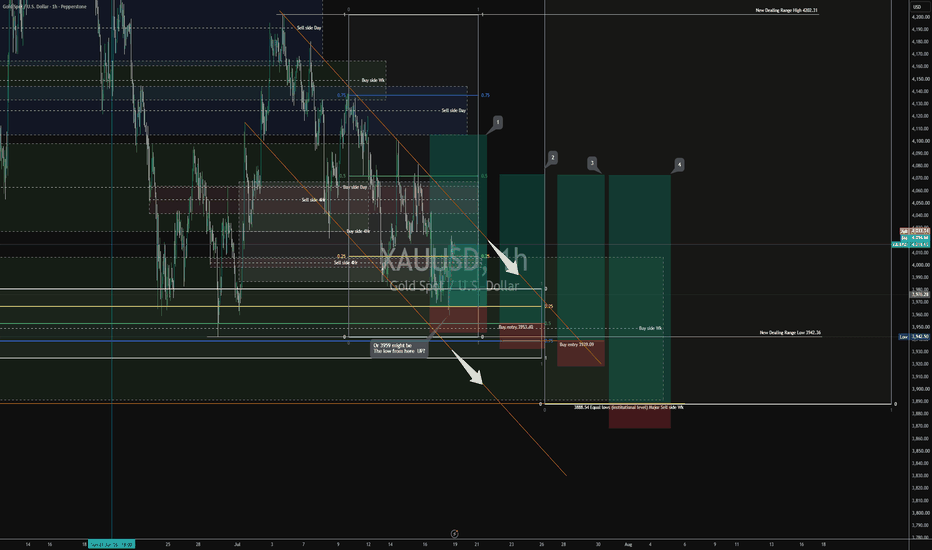
Solana Eyes $93 Rally: Why Current Consolidation Next Signals Solana (SOL) is at a critical point that could signal a buying opportunity, with a potential rise to $93.
As seen in the 4-hour chart below, SOL continues to consolidate in a rising channel, with the lower boundary set at $76. Maintaining prices above this level would signal a buying opportunity, with a potential rebound to $93.
Why the next target for Solana could be $93
According to Ali, several on-chain metrics support this theory:
Add Coinpedia as a trusted source in Google News
In the past week, fewer SOL tokens have been deposited into exchanges for selling. The reduction in selling pressure has also set up a stronger macro price floor for SOL at around the $75 mark.
Additionally, as that week ended, spot SOL ETF flows turned positive, recording $948,200 for the week ending July 17.
Even more, the number of new Solana addresses has risen by 0.5 million since July 18, indicating increasing network activity.
Key levels to watch for
SOL faces a major volume barrier between the $76 and $85 mark on the UTXO Realized Price Distribution (URPD). Users traded about 125 million SOL in this region, making $85 the next ceiling to break through if SOL should target $100 and beyond.
Breaking below the $70 mark would turn the trend bearish, exposing the coin to a deeper correction near the next highly traded URPD baseline of $53.
Just recently, a hacker managed to drain $1.65 million from a Solana cross-chain bridge protocol. While highlighting the inherent security vulnerabilities in on-chain bridges, the event had little to no impact on SOL, with the coin gaining 2.2% in the past 24 hours to trade at $77.43 at press time.

 Short
Short Long
Long