Gann
CLS Method 2/9 - The False Break Was the Construction for Entry.Hey what's up guys, part 1 gave you the rule. No manipulation, no trade. This is part 2 of 9, and it is the reason that rule exists.
The mistake is thinking a large player just presses Buy. At that size, the market runs away from the order. The fill is worse than the idea. So the position is not loaded first. The liquidity is built first.
🏭 Size Cannot Just Click
A big operator cannot lift an institutional position into a thin market and get the price he wants. Price would leave. The order
Descending Trendline Breakout & Support ReclaimBTCUSDT 1H: (Long Setup)
1. Market Context
On the 1H chart, Bitcoin (BTC/USDT) executed a clean liquidity sweep near the 82,541.45 horizontal support floor (low at 82,646.60). Price has now broken out above the red descending trendline and is consolidating near 83,923.36, preparing to confirm a breakout above 84,057.08.
2. Sentiment & House Trap Analysis
• Where Traders Place Orders: Retail shorters opened late SELL positions along the red trendline, expecting BTC to breakdown toward the lower
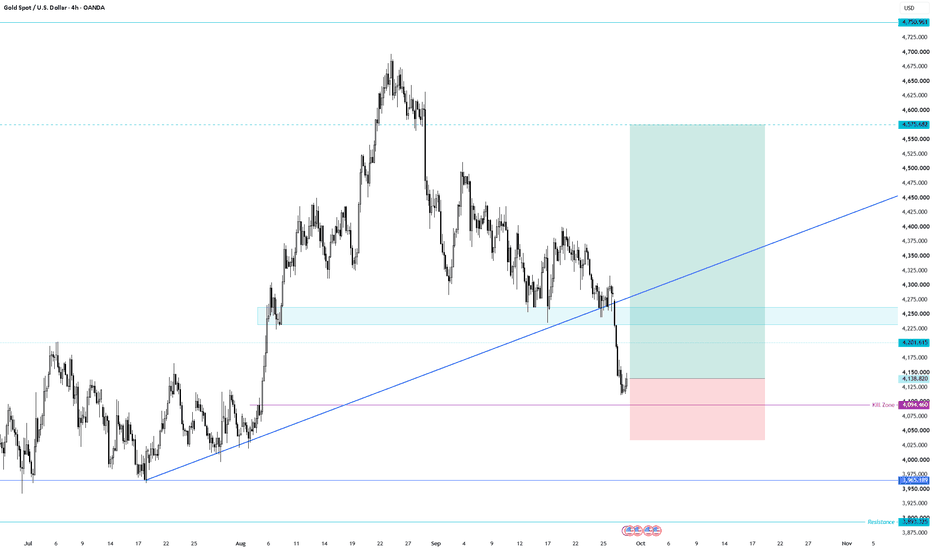
"Kill Zone" 4,094 Liquidity Sweep & Bullish Reversal XAUUSD 4H: (Long Setup)
1. Market ContextOn the 4H chart, Gold Spot (XAUUSD) underwent a steep markdown from above 4,700.000, breaking down through the ascending blue trendline and the 4,259.324 horizontal support. However, the sell-off was completely halted right at the purple "Kill Zone - 4,094.460" support floor. Price is now printing a strong bullish rejection wick, rebounding from 4,094.460 up toward 4,141.225, officially activating a high-probability bullish reversal plan.
2. Sentimen
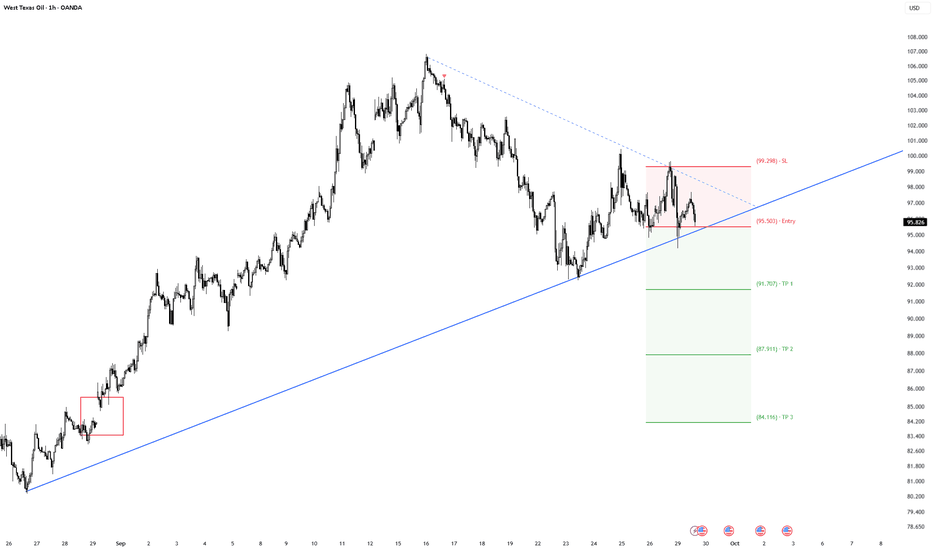
Ascending Trendline Breakdown & Macro Liquidity SweepWTICOUSD 1H:
1. Market Context
On the 1H chart, WTI Crude Oil (WTICOUSD) has completed a markdown structure from above the 106.600 peak, forming a series of Lower Highs bounded by a descending dotted blue trendline. Price is currently breaking down below both the major ascending blue trendline support (extending from the 80.200 base) and the horizontal support level at 95.503, triggering a bearish reversal short setup.
2. Sentiment & House Trap Analysis
• Where Traders Place Orders: Seeing the
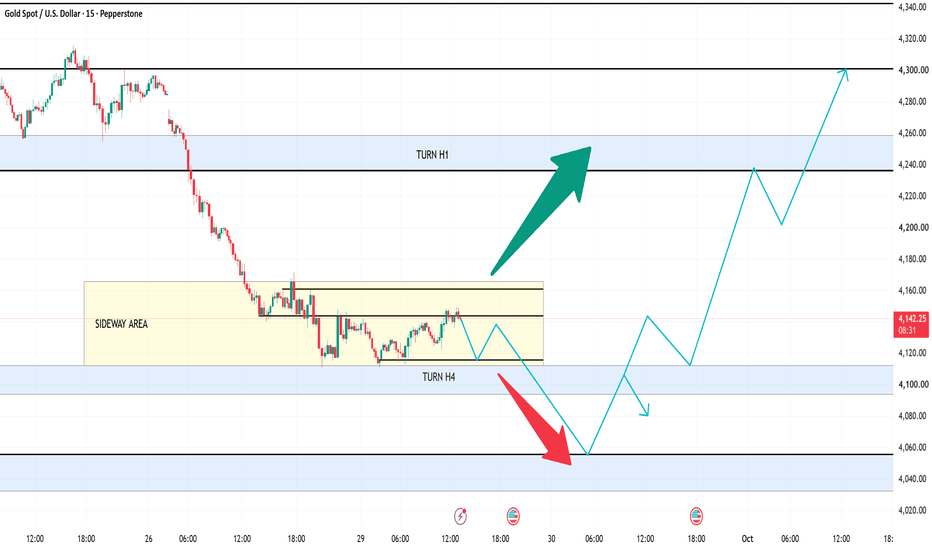
XAUUSD – TAGGING TURN H4, COMPRESSED 4,111–4,166!
Live price on chart: 4,144.7 (countdown 14:32). The chart is cropped – no timeframe is visible and there's no EMA/RSI/Volume; confirm your timeframe before applying the scenario.
📊 WHAT THE CHART SAYS
The H4 trend is clear: candles break from the wick high at ~4,300 top-left, fall in one run to ~4,245, then enter a sideways accumulation. This is a downtrend with no confirmed end – merely a pause.
Turn zones Leo reads:
🔵 TURN H1: 4,240 – 4,255 – upper blue band, tied to the 4,240 line
🟡
What’s Behind a New HighA new high looks bullish, but the number of assets participating in the move can tell you much more about its quality.
Consider an index reaching a record high. If 70–80% of its components are also advancing, many sectors and individual stocks are contributing to the move. Demand is distributed across the market rather than concentrated in a few names.
Now imagine the index reaches another record several weeks later, but only 40% of its components are advancing. A handful of heavily weighted s
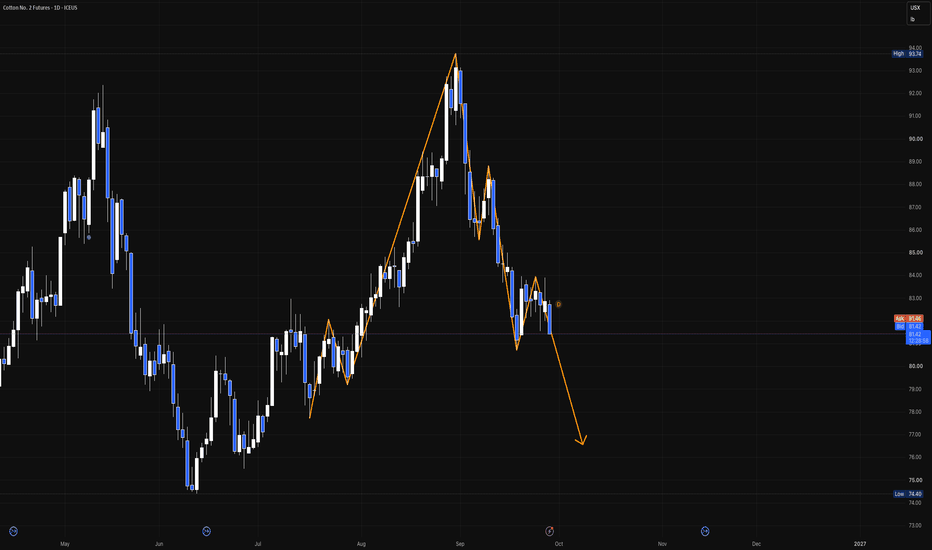
Cotton: failed at 84.18, short below 80.66Cotton topped at 93.74 at the end of August after a 54% rally from the February low. The top came with a weekly key reversal, and the daily swing chart has been stepping down since: a sharp drop, a lower high near 89 below the 88.70 level (3/8 of the range), then a slide to the 80.80 swing low on September 22.
The bounce from there stalled exactly at 84.18, the old breakout level from August, and price is rolling over again. Price has also lost 82.89, the quarterly HRC 5/8 level, so resistance
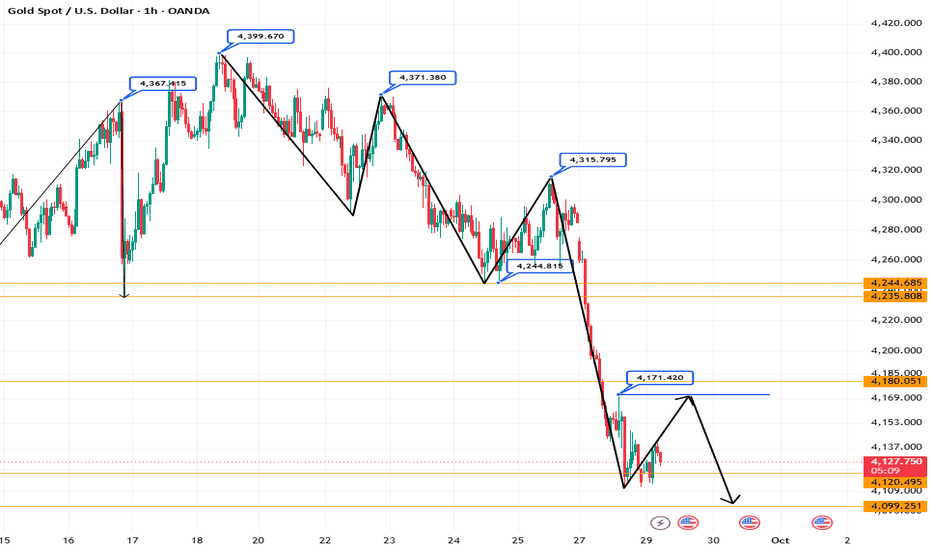
XAU/USD: Market Analysis and Strategy for September 29Gold opened near $4,280 yesterday and trended steadily downward; during the European and US trading sessions, the price dropped sharply to a low near $4,110—a daily decline of over $170—before closing at $4,114. On the daily chart, the MA5 and MA10 moving averages are sloping downward, the KDJ indicator has formed a "death cross," auxiliary indicators are turning down, and the MACD bearish momentum bars are expanding; the daily trend is dominated by bears. A drop below $4,100 is highly likely to
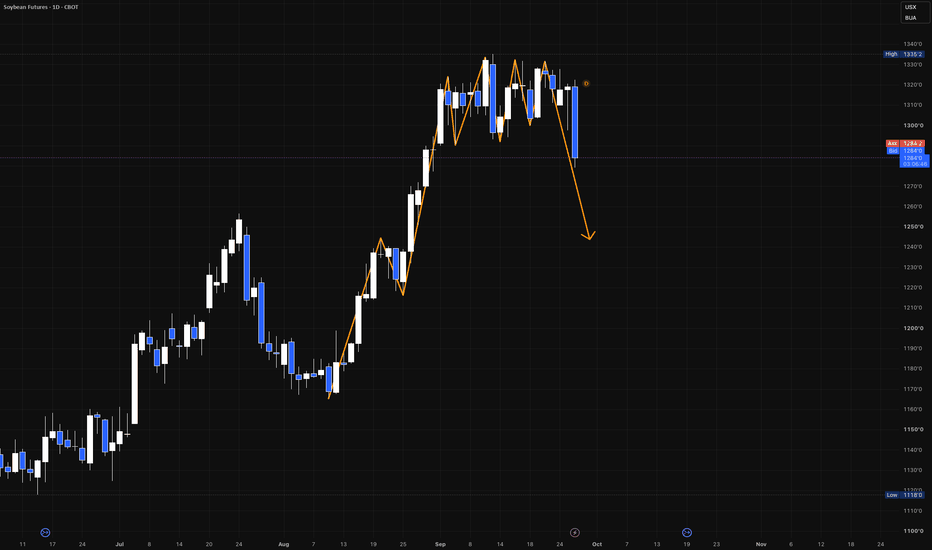
Soybeans: three weeks of topping, short below 1300Soybeans rallied from the 1165 August low to 1335'2 in mid September, about 15% in five weeks. Then the market stalled. For three weeks it went sideways between roughly 1295 and 1335, with three failed pushes at the highs. Today's wide range down bar broke through the floor of that box, and the daily swing chart has turned down.
Plan
Entry: 1299'0, on the break of the range floor. The trade is live.
Stop: 1335'2, above the triple top and the contract high.
First profit taking: one third of the
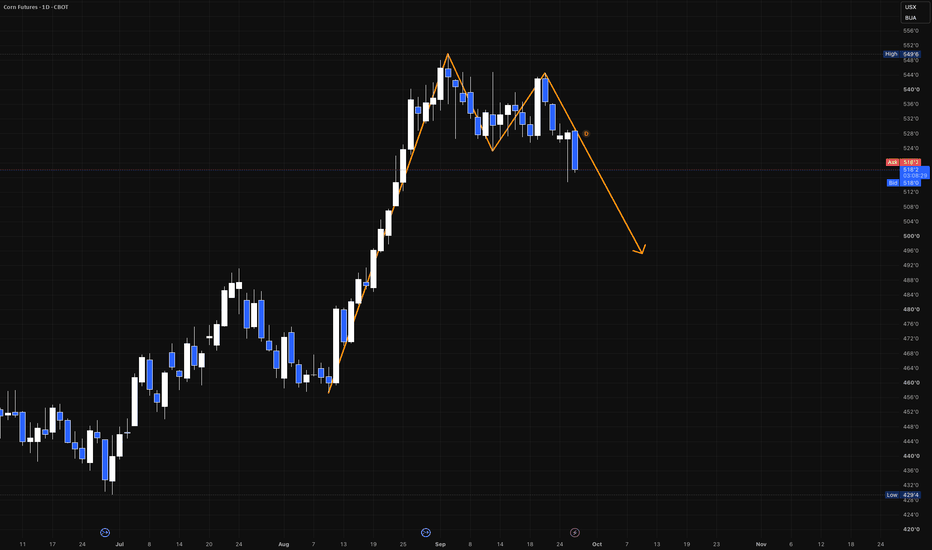
Corn: double top at 549, short below 525Corn rallied from the 456 August low to 549'6 in early September, about 20% in four weeks. The follow through never came. Price pulled back to the 525 area, rallied again into a lower high near 545 on September 22, and has now broken below the mid September swing low. That completes a double top on the daily swing chart, with the swing direction turned down.
Plan
Entry: 521'6, on the break of the 525 swing low. The trade is live.
Stop: 545'2, above the second top.
First profit taking: one thir
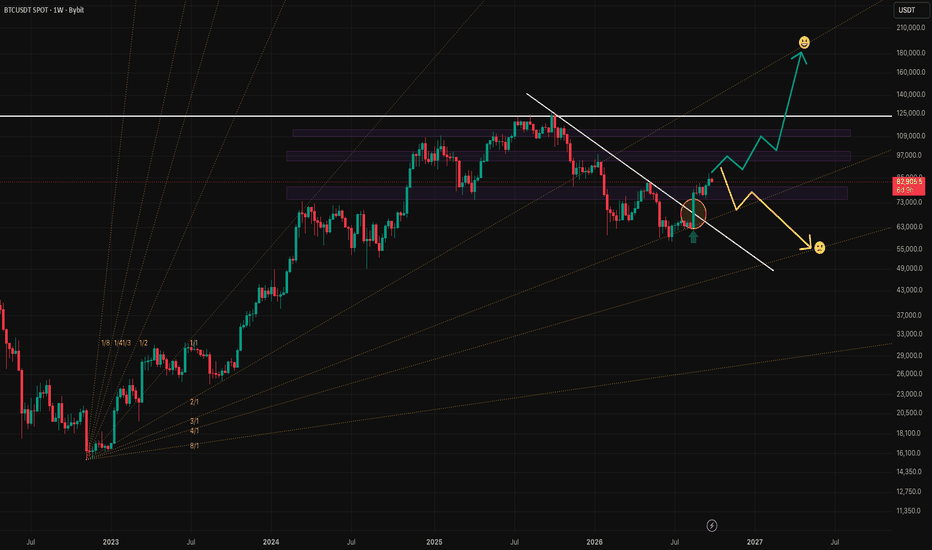
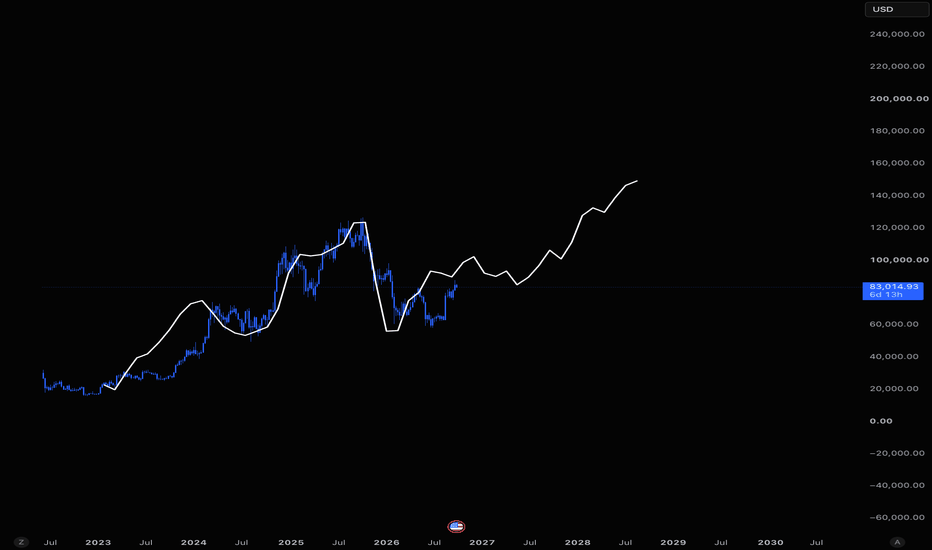
Bitcoin Gann Fan Analysis: Is BTC Entering a New Bullish Phase?
Bitcoin’s weekly chart is at an interesting point.
Instead of trying to forecast exactly where BTC will trade months from now, this analysis uses a Gann Fan to map the larger structure and identify the areas where price may give us the next important piece of information.
What makes the current setup especially interesting is that the structure isn’t new. The Gann Fan has been drawn from the major market low around November 2022, and Bitcoin has interacted with its different levels several t
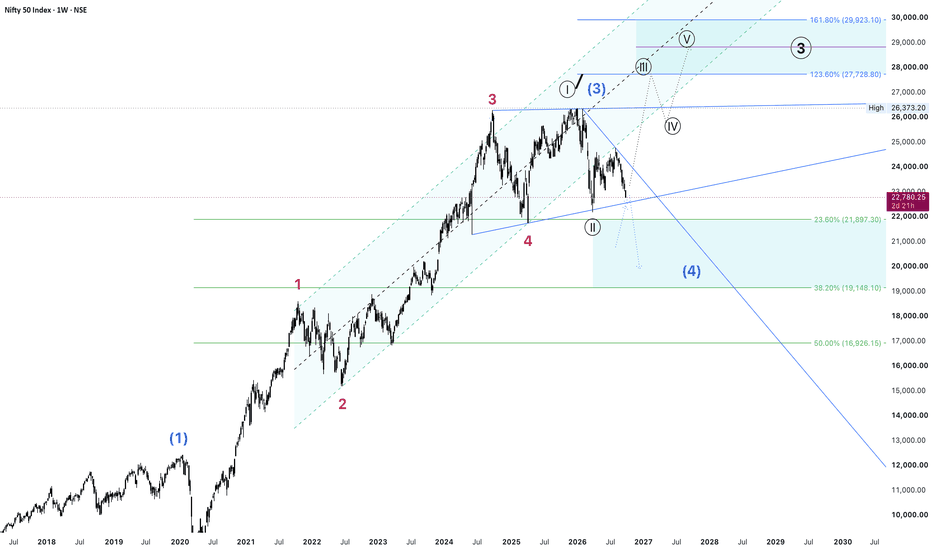
#NIFTY50 At crucial Junction! Is it preparing for 20000 Levels? #NIFTY50 Hello Everyone, post our last video we were expecting some sort of positive news or a gap up to start with which could support a bull run. However we ended up with a gap down, with 7-8 weekly dark candle we could see the market turning to give a negative returns before multiple years of positive returns.
Technically:
The market sits at a crucial junction where a break below the Neckline could definetly retest 20000 Levels. Its not a sell guys, We are trend buyers and we could see an o
GOLD-XAUUSD | This Week’s Key Zone| Prof.TraderTilkiMy dear friends,
For this week, I have set the key level for XAUUSD-GOLD at 4257–4280.
Currently, gold is at 4146, far from my key zone, but during the week I expect price to revisit this area. If sellers appear at 4257, I will consider opening a sell trade; however, if 4280 is broken, I will look for buy opportunities.
These levels are not chosen randomly. On the chart you only see a few things, but I determine them with my own private strategies. That’s why my key levels work with pinpoint
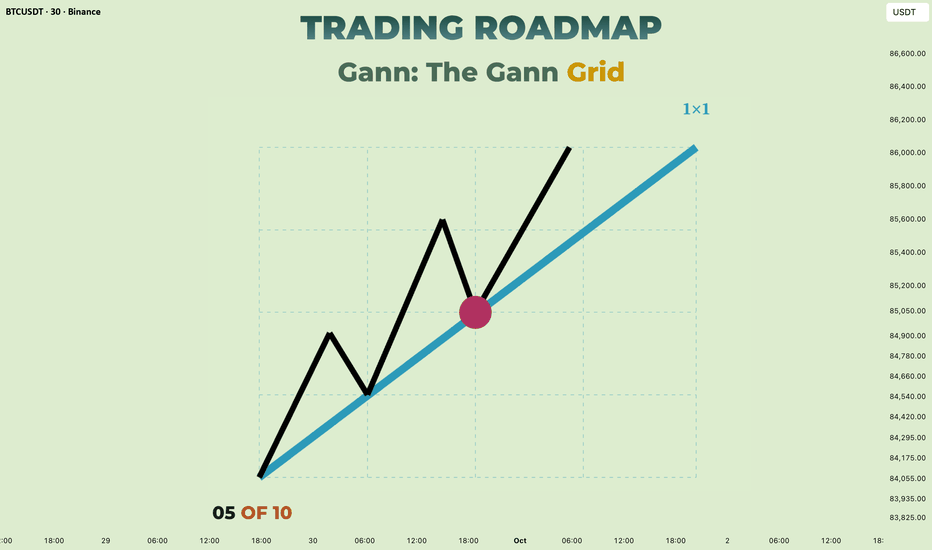
Trading Roadmap | Gann · Lesson 05 — The Gann GridLesson 05 - The Gann Grid
Difficulty: (Intermediate)
The fan takes one anchor and sends lines out from it. The grid takes the same anchor and the same unit and repeats it — across the chart and up it — until the whole screen is divided into cells of equal price and equal time. It is the most literal expression of the idea this course started with, and the easiest tool in the toolkit to ruin with too many lines.
One anchor, one unit, repeated in both directions. The horizontal lines
AAL — 200-SMA Reclaim Attempt
Bias: Early Bullish Reversal Watch
Timeframe: Daily Swing
Reference Price: $13.87
AAL is attempting an important trend transition near its 200-day moving average.
Momentum is improving and MACD has produced a bullish crossover, but I would classify this as a reclaim attempt rather than a confirmed trend reversal.
Levels
Reference Entry: $13.87
Support 1: $13.31
Support 2: $13.17
Stop / Invalidation: $13.00
Target 1: $14.76
Target 2: $15.21
Confirmation I Want
I want to see price establis
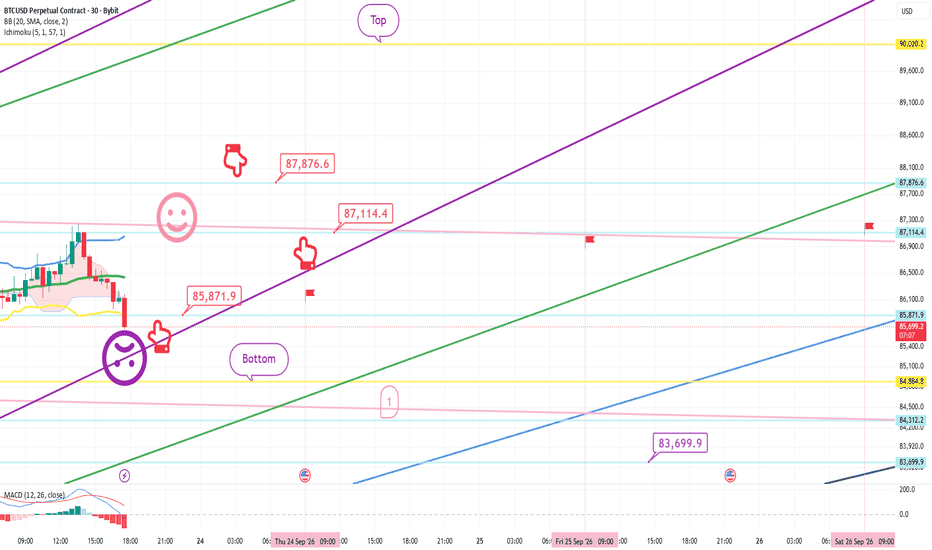
SEPTEMBER 23 Bitcoin chart analysis.Hello
It's a Bitcoin Guide.
My analysis is optimized for TradingView.
If you press the Replay button, you can check real-time movements.
This is the 30-minute Bitcoin chart.
While a correction is likely for the Nasdaq,
Bitcoin appears highly likely to move sideways at this level.
I have disregarded the MACD "death cross" on the 6-hour chart.
Also, I am interpreting the monthly chart as not having touched the middle line of the Bollinger Bands.
*If the price follows the path indicated by t
AUDUSD-SELL strategy weekly chart Reg. Channel - 3 mountain topsAUDUSD feels starting to look heavy on the top side. we have tried twice to trade above the reg.channel, and clearly "3 mountain tops" pattern, suggest we may see a decline towards 0.6550 medium-term.
Strategy SELL between @ 0.7000-0.7050 and watch the 0.6900 neckline area. Overall on break we will move towards 0.6500.