Long
Long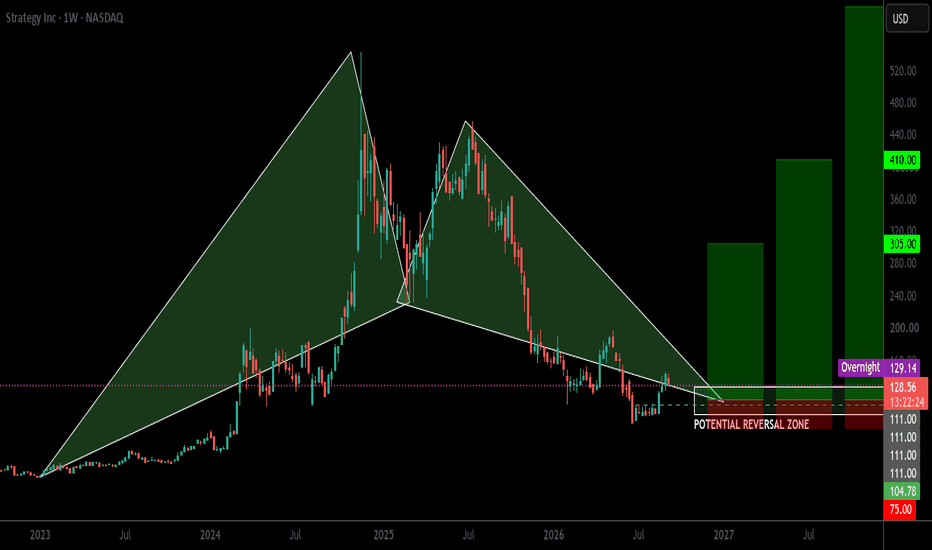
 Long
Long
 Long
Long
 Long
Long
 Long
Long
2 Timeframes, 2 Patterns, 1 BIG Opportunity! I’m seeing TWO different technical patterns developing on TWO different timeframes — and they may be telling the same story.
Let’s start on the weekly chart.
Price has recently collapsed from the 2.1680 area all the way down toward 1.8480 before finding a previous level of structure support.
And rather than simply putting in a V-shaped reversal, price has started forming something much more interesting:
A potential Head & Shoulders pattern.
But here's where things get really interesting…
If we drop down to the daily chart, another pattern starts to appear.
A bullish Gartley.
And the potential completion zone for that Gartley lines up remarkably well with the area where we could see the right shoulder form on the weekly chart.
Think about what that means.
Instead of waiting for the weekly Head & Shoulders to completely develop and break its neckline, an aggressive trader could potentially use the Gartley completion as an early entry into the right shoulder.
That's the connection.
Now, that doesn't mean we should blindly jump in and bet everything on it.
The Head & Shoulders isn't technically confirmed until the neckline breaks.
And that's an important distinction.
This is where trading becomes less about predicting the future and more about managing possibilities.
Personally, rather than putting all of my eggs in one basket, I'd look at this as a trade where I can potentially take some profits at my normal target levels while still maintaining a small position in case that larger move actually develops.
Because here's something I've learned after years of trading:
The really big winners are rare.
The internet makes it look like every trader is catching massive moves every week.
That's not reality.
Most of the time, trading looks more like:
Win small. Lose small. Win small. Lose small. And then, every once in a while…
You catch the big one.
Those are what I like to call home run trades.
You don't need dozens of them every year.
A handful of properly managed trades with significant upside potential can have a meaningful impact on your results.
The goal isn't to swing for the fences on every trade.
It's to manage your risk well enough that when one of those rare opportunities with genuine home-run potential comes along…
You're still around to take the swing.
And GBPAUD may be giving us one of those opportunities right now.
Please leave any questions, comments or trading ideas below and I wish you a safe and profitable trading week!
Akil  Long
Long
 Long
Long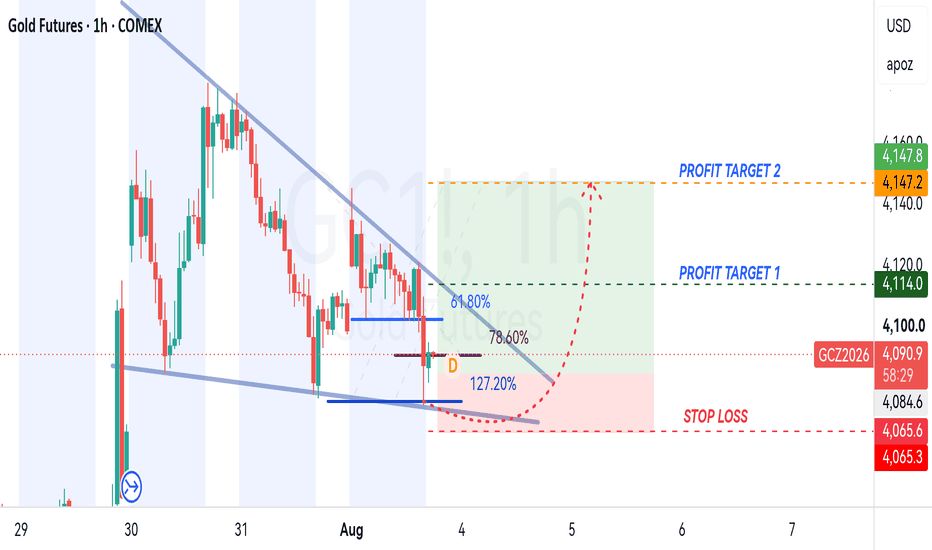
Bitcoin at a Critical Resistance: Bearish Gartley is formingBitcoin ( BINANCE:BTCUSDT ) is once again testing the 50_EMA(Daily), the resistance zone, and the Resistance Lines.
The recent recovery has been supported by the decline in the U.S. Dollar Index(DXY), alongside gains in the S&P 500 and Gold.
Can this macro support push Bitcoin above $66,000, or is another correction about to begin?
Macro Outlook
The decline in DXY and the rally in U.S. stock indices—particularly the S&P 500—have supported Bitcoin’s recent upward move.
Gold has also strengthened, reflecting broader weakness in the U.S. dollar. However, Bitcoin is now approaching an important technical resistance area that could limit further upside.
Technical Analysis
On the 4-hour time frame, Bitcoin appears to be completing a Bearish Gartley Harmonic Pattern near the Resistance Lines, indicating a potential bearish reversal.
💡 Educational Note: A Bearish Gartley Pattern identifies a potential reversal area through specific Fibonacci ratios, but confirmation from resistance and bearish price action remains essential.
I expect Bitcoin to resume its bearish movement over the coming hours and decline at least toward the key trading level of $64,000. If $64,000 is broken, the correction could extend toward the Cumulative Long Liquidation Leverage zone.
Trade Setup
First Target: $64,000
Second Target: Cumulative Long Liquidation Leverage zone($63,400-$62,550)
Stop Loss(SL): $65,803(Worst)
Cumulative Short Liquidation Leverage: $66,100-$65,200
Which level do you think Bitcoin will reach first?
🔴 $63,000
🟢 $66,000
📌 Bitcoin Analysis (BTCUSDT), 4-hour time frame.
🛑 Always use proper risk management and set a Stop Loss(SL) for every position.
🚀 If this analysis helps your trading plan, a BOOST would help more traders discover it.
 Short
Short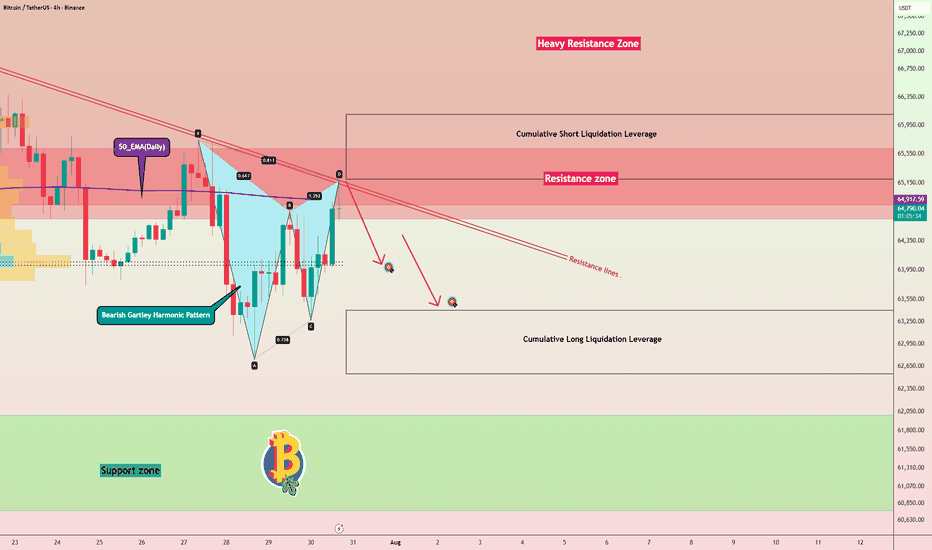
Long 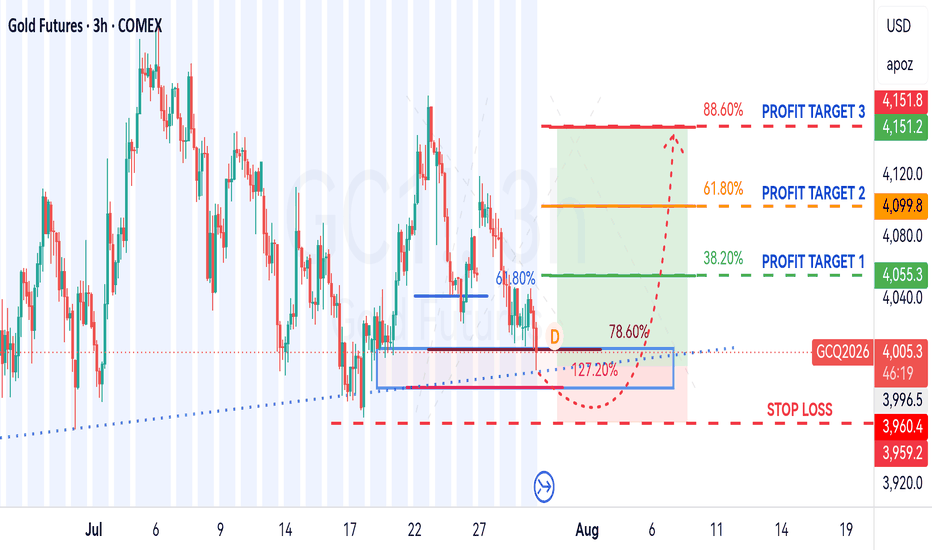
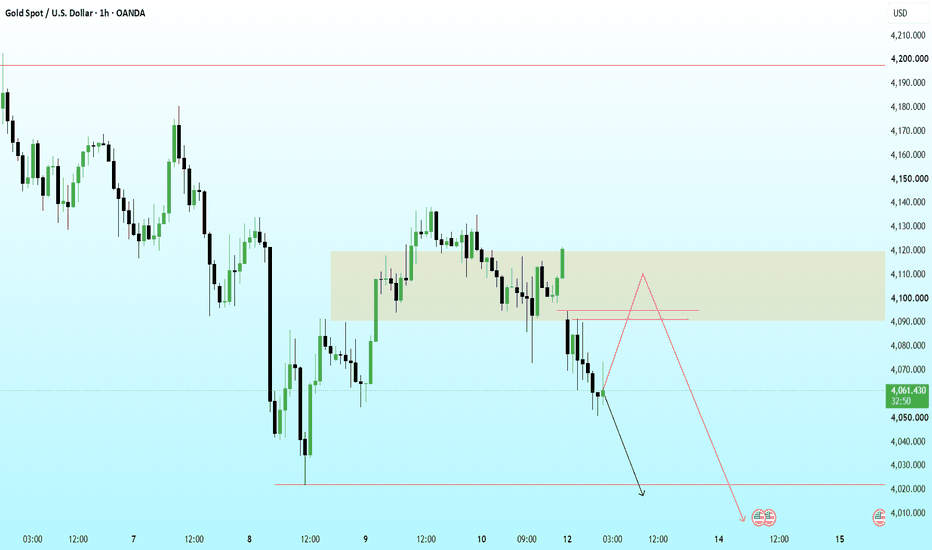
Daily Outlook || 13th July || CPI EveMarkets are sitting on a knife's edge heading into tomorrow's CPI print. Liquidity has been building on both sides of the market across forex, indices, gold, and Bitcoin — a setup that typically precedes a sharp directional resolution. Today's session is about mapping where that liquidity sits, not predicting which way it breaks.
In this video, we break down EURUSD, GBPUSD, XAUUSD (Gold), S&P 500, Nasdaq 100, and Bitcoin through the lens of:
Market Structure
Liquidity Mapping
Institutional Order Flow
ICT Concepts & Smart Money Concepts
Premium & Discount Zones
Fair Value Gaps
Order Blocks
Daily Bias Framework
With CPI on the calendar, this is a two-sided market — and knowing where the resting liquidity is matters more than guessing the headline number.
Why you should watch:
✔ Key liquidity pools above and below current price
✔ Areas where institutions are likely to react
✔ Risk management going into a high-impact news event
✔ Bullish and bearish scenarios mapped for both outcomes
✔ Confirmation levels to validate direction post-CPI
This analysis is for educational purposes only and does not constitute financial advice. Always manage risk and trade your own plan.
CPI tomorrow means big moves are coming — but which side gets swept first? Drop your bias below: are you leaning long or short into the print? Let's compare notes before the data hits.
 Long
Long
Long 
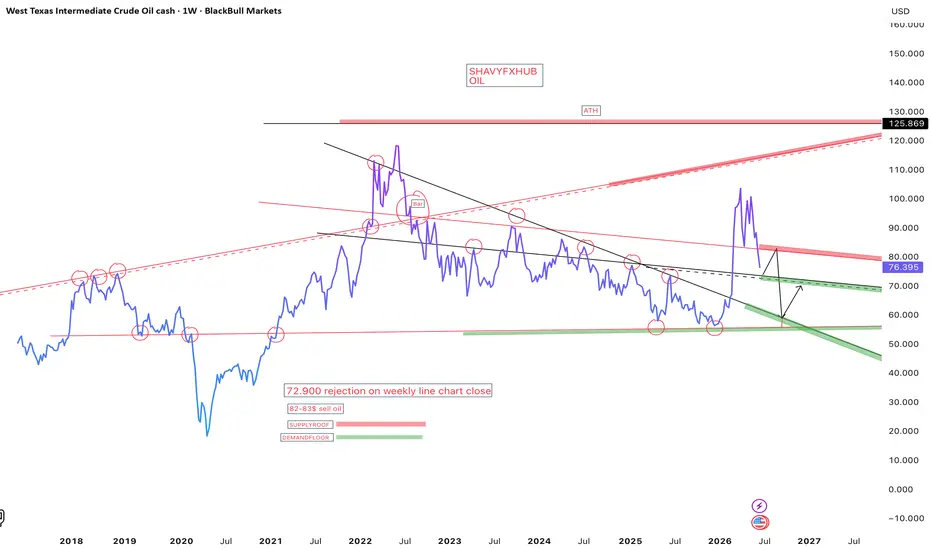
WTI OIL LINE CHART ON WEEKLYOil is retesting a weekly sell zone 82-80$ per barrel,sell oil on retest.
The weekly TF structure is broken,peace deal reached between United States and Iran,global tension reduced and maritime security assured and soon insurance companies will return to providing services at normal rate.
Oil rally is struggling to print a higher high,the best high will be 82$-80$ zone and if price does get to this zone sell target will be 68-62$ zone.
Further escalation will be watched,the energy price is dependent on demand and supply,supply rely on logistics routes,any disruption will course increase in price,
Oil maritime security plays a vital role in the price of crude oil,insurance companies and risk premiums.
Key Oil Chokepoints
According to the U.S. Energy Information Administration (EIA) and other sources, the most critical ones by volume include:
• Strait of Hormuz (Persian Gulf to Gulf of Oman/Arabian Sea): The single most important. It carries ~20-21 million barrels per day (b/d) in recent years, equivalent to about 20% of global petroleum liquids consumption and ~25% of seaborne oil trade. Primarily exports from Saudi Arabia, Iraq, UAE, Iran, Kuwait, etc., heading to Asia (China takes a huge share), Europe, and beyond. No easy alternatives for much of this volume; pipelines help only partially. 
• Strait of Malacca (between Indian Ocean and South China Sea, via Indonesia/Malaysia/Singapore): ~22-24 million b/d. Links Middle East/African oil to major East Asian importers (China, Japan, South Korea). Very high volume but has some alternative routes (though longer/costlier). 
• Suez Canal and SUMED Pipeline (Egypt): Connects Red Sea/Mediterranean. Around 5-9 million b/d depending on the year. Important for Gulf oil to Europe/North America. 
• Bab el-Mandeb Strait (between Red Sea and Gulf of Aden, near Yemen): ~4-9 million b/d. Links to Suez route; vulnerable to attacks (e.g., Houthi incidents). 
• Others: Turkish Straits (Black Sea exports, e.g., Russian oil), Danish Straits, Panama Canal (smaller volumes for oil).
These routes together handle a massive share of global seaborne oil (~60%+ of traded oil moves by sea). Even temporary threats can reroute tankers (adding thousands of miles, fuel, and time) or halt flows. 
Why Risk Premiums Go High During Conflicts
Risk premiums in oil markets refer to the extra compensation (higher prices) that buyers and traders demand to account for potential future supply disruptions, uncertainty, and volatility. Conflicts elevate this premium through several mechanisms: 
1. Perceived Supply Risk: Conflicts in oil-producing regions (e.g., Middle East) or near chokepoints raise fears of direct attacks on infrastructure, blockades (like threats to Hormuz), sanctions, or production halts. Even if current supply is intact, the probability of future shortages spikes. Traders price this in via futures markets, increasing the “convenience yield” (value of holding physical oil now). 
2. Higher Costs and Disruptions: Insurance premiums for tankers skyrocket in risky areas. Shipping companies avoid routes, causing delays, rerouting, and effective supply reductions. This happened with recent Hormuz/Bab el-Mandeb tensions. 
3. Speculation and Market Sentiment: Geopolitical events drive speculative buying (hoarding for potential shortages), which amplifies price moves. Media coverage and uncertainty boost volatility. Studies show GPR (geopolitical risk) indices correlate with higher oil price volatility and premiums, especially when involving major producers or chokepoints. 
4. Demand/Supply Channel Imbalance: While broad geopolitical shocks can sometimes dampen global demand (via economic uncertainty), oil-specific conflicts (e.g., in OPEC+ areas or key routes) make the risk/supply channel dominate, pushing prices up. Effects are often short-lived unless prolonged, but can persist with ongoing tensions. 
Examples: Tensions or attacks near Hormuz historically cause immediate spikes (e.g., premiums added during Iran-related incidents). The premium reflects not just actual barrels lost but fear of worse scenarios. 
In summary, these chokepoints act as bottlenecks in a just-in-time global supply chain. Conflicts heighten risk premiums because markets are forward-looking and hate uncertainty—better to pay more now than risk shortages later. Prices can decouple from fundamentals temporarily due to this psychology and hedging behavior. #usoil Short 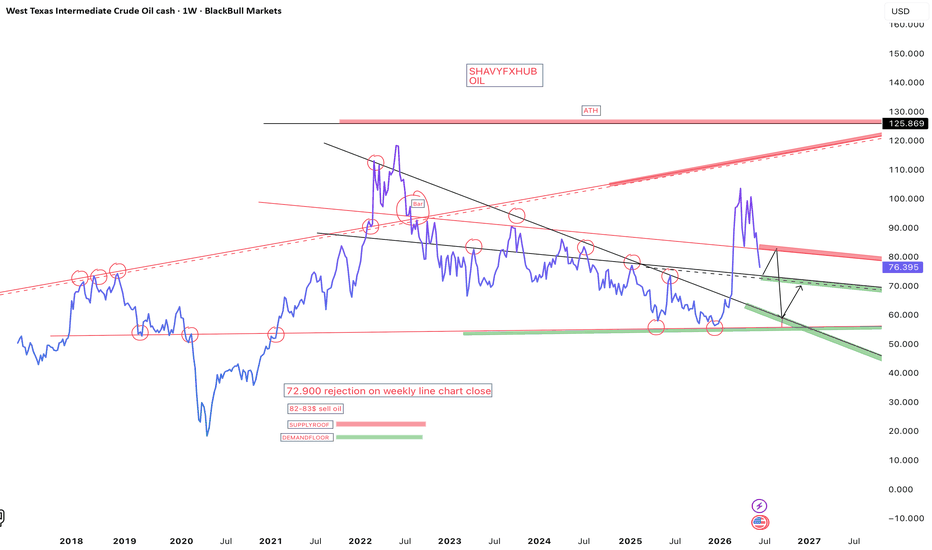
Inside Bitcoin Magazine’s Retweet — Jack Dorsey Pays with BTCA widely shared post on social media highlighted Block CEO Jack Dorsey’s decision to pay with Bitcoin at a counter. This tweet, amplified by Bitcoin Magazine, has sparked significant discussion online and reflects the ongoing interest in cryptocurrency’s real-world applications. The original tweet can be viewed here.
The Key Development
The tweet from Bitcoin Magazine, which garnered 542 likes and 80 retweets, emphasizes a notable moment in cryptocurrency adoption. Dorsey’s action represents not just a personal financial choice but also serves as a symbol of Bitcoin’s increasing acceptance in everyday transactions. This incident resonates within a broader context, where discussions around Bitcoin’s utility are becoming more prevalent, especially amid mixed signals in the broader crypto market.
Key Takeaways
Jack Dorsey utilized Bitcoin for a payment, Bitcoin Magazine amplified the tweet, the tweet received significant engagement from the community.
The Numbers
Currently, the cryptocurrency market is experiencing mixed signals, with variable momentum across different assets. As noted, no specific price movements or trading volumes are reported at this moment. However, the social media buzz surrounding Dorsey’s payment could influence community sentiment and engagement levels in the short term.
Jack Dorsey, a prominent figure in the Bitcoin community, has been a vocal advocate for cryptocurrency adoption. His company, Block, has integrated various cryptocurrency functionalities, pushing for wider acceptance. This recent transaction aligns with Dorsey’s ongoing efforts to promote Bitcoin and reflects the growing trend of cryptocurrencies being used in everyday scenarios.
Key Levels to Watch
Traders and community members are closely watching social media engagement around Bitcoin and its real-world applications. The excitement generated by Dorsey’s payment could lead to increased discussions and potential adoption among businesses. Additionally, this trend of high-profile endorsements might encourage more users to explore Bitcoin payments, especially if they witness practical implementations in their daily lives. Pi Network Sets June 18 Deadline for Protocol 25 Node UpgradePi Network has entered another important phase of its mainnet development. The Pi Core Team announced that all mainnet node operators must complete the upgrade to Protocol 25 by June 18, 2026, or risk losing connection to the network. The update is part of Pi Network’s long-running roadmap that is gradually moving nodes from Protocol 19 through Protocol 26.
In a post on X, the team reminded node operators to plan ahead for the migration. The announcement quickly sparked discussion across the Pi community, with operators preparing for another network-wide transition.
Protocol 25 Marks the Next Step in Pi’s Upgrade Path
The latest upgrade follows the successful rollout of Protocol 24 and continues Pi Network’s sequential migration process. According to the roadmap, nodes must upgrade in order and cannot skip versions. The current path moves from version 24.1 to 25.2, with Protocol 26 expected to follow at a later date.
Unlike some previous migrations, the Protocol 25 upgrade is designed to be relatively quick. Pi Network said most nodes should experience less than five minutes of downtime during the process. However, the team advised operators not to upgrade all nodes simultaneously. Instead, they should redirect traffic to other nodes or use Pi’s mainnet API infrastructure while the migration is underway.
Node Operators Begin Preparing for June 18
The deadline has already caught the attention of the community. Pi advocate PiNetwork DEX said he plans to notify node operators to complete upgrades in batches before June 18 to help ensure a smooth transition across the network.
Questions also surfaced about node participation and network growth. Some community members asked whether the total node count has approached 400,000 and where updated testnet statistics can be viewed. While the Core Team has not commented on those figures, the discussion highlights growing interest in the health and scale of the Pi Network ecosystem.
Upgrade Process Differs by Node Type
For users running Pi Desktop on Windows or macOS, the process is largely automatic. The protocol update will trigger when the node software starts. Linux users operating through the newer Pi Linux Node CLI may not need to take action if auto-updates are enabled. Those without automatic updates must manually run the upgrade command.
Meanwhile, operators using legacy self-managed Docker containers will need to update their Docker image and restart services using the latest Protocol 25 release. Pi Network stressed that operators should monitor synchronization status after upgrading to confirm the migration has completed successfully.
What This Means for Developers and Investors
For developers, Protocol 25 is another sign that Pi Network continues to strengthen its infrastructure ahead of future upgrades. Consistent node participation is critical for network stability, scalability and future ecosystem growth. For investors and community members, the upgrade itself is not a direct price catalyst. But it demonstrates that the project is continuing to execute its technical roadmap despite ongoing market volatility.
That progress comes at a time when Pi Network remains under pressure from large token unlocks and weak market sentiment. Many holders are closely watching whether ecosystem development can eventually offset the additional supply entering circulation. As June 18 approaches, the focus now shifts to node operators. Their ability to complete the Protocol 25 migration on time will help determine how smoothly Pi Network advances toward the next stage of its mainnet evolution.