Gold breakout risk builds into FedDecision day may have arrived for gold, heading into what’s likely to be the first Fed interest rate increase in three years.
The falling wedge structure we highlighted yesterday remains intact, with the price pressing back towards the upper boundary after a third consecutive failure to move convincingly beneath the 50-day moving average earlier today. That keeps the lower end of the structure in play and suggests bids are still lurking around that area.
While the structure is technical in nature, macro may deliver the trigger. Markets are already pricing a pretty hawkish Fed path, with around four hikes favoured by the middle of next year. My inkling is that the Fed may struggle to out-hawk that.
One obvious route would be an updated dot plot that shows fewer hikes this year and next than markets currently have priced. If the decision and guidance amount to a dovish hike relative to current pricing, we could see some relief in Treasury yields and renewed pressure on the US dollar, giving gold a decent crack at breaking higher from the wedge.
There are also more aggressive bullish scenarios. A shock decision to leave rates unchanged may deliver a sharpe twist steepening of the curve, while several influential FOMC members dissenting in favour of holding could have a similar effect. Either outcome could provide a meaningful release valve for bullion.
While the trigger for a breakout is obvious, confirmation is still required. The key area to watch is the confluence of the 23.6% Fib retracement of the Jan-June bear move around $4,333 with the upper boundary of the falling wedge drawn from the late-August high.
A sustained break above that zone would confirm the bullish breakout and bring $4,400 into focus initially, followed by $4,510.80. Beyond that, the 200-day moving average and 38.2% Fib around $4,575 remain the next major hurdles, before the August high at $4,696.80.
On the downside, the 50-day moving average is now found just above the lower boundary of the wedge structure. A successful break beneath the latter would question the merits of the bullish setup and arguably flip directional risks lower, putting $4,200 back in play.
Good luck!
DS  Long
Long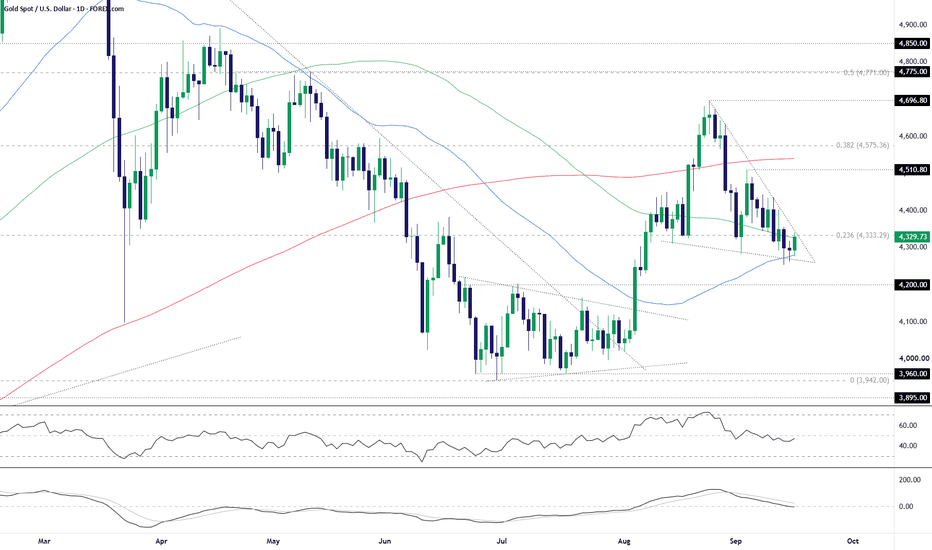
Diamondback Energy Has Been CoilingDiamondback Energy has consolidated as crude oil rallies, and some traders may see potential for a breakout.
The first pattern on today’s chart is the July 2024 high of $214.50. FANG broke the old peak last month before pulling back. Is another push coming?
Second, the oil-and-gas driller made higher lows above its rising 50-day simple moving average after testing the old resistance. That could reflect bullish intermediate-term price action.
Third, Bollinger Bandwidth has narrowed as the stock forms the tighter range. That volatility squeeze may create potential for prices to expand.
Finally, the 8-day exponential moving average (EMA) has mostly stayed above the 21-day EMA since early July. That could be consistent with growing bullishness in the short term.
TradeStation has, for decades, advanced the trading industry, providing access to stocks, options and futures. If you're born to trade, we could be for you. Learn more here about TradingView’s Broker of the Year!
Past performance, whether actual or indicated by historical tests of strategies, is no guarantee of future performance or success. There is a possibility that you may sustain a loss equal to or greater than your entire investment regardless of which asset class you trade (equities, options or futures); therefore, you should not invest or risk money that you cannot afford to lose. Online trading is not suitable for all investors. View the document titled Characteristics and Risks of Standardized Options at www.TradeStation.com . Before trading any asset class, customers must read the relevant risk disclosure statements on www.TradeStation.com . System access and trade placement and execution may be delayed or fail due to market volatility and volume, quote delays, system and software errors, Internet traffic, outages and other factors.
Securities and futures trading is offered to self-directed customers by TradeStation Securities, Inc., a broker-dealer registered with the Securities and Exchange Commission and a futures commission merchant licensed with the Commodity Futures Trading Commission). TradeStation Securities is a member of the Financial Industry Regulatory Authority, the National Futures Association, and a number of exchanges.
TradeStation Securities, Inc. and TradeStation Technologies, Inc. are each wholly owned subsidiaries of TradeStation Group, Inc., both operating, and providing products and services, under the TradeStation brand and trademark. When applying for, or purchasing, accounts, subscriptions, products and services, it is important that you know which company you will be dealing with. Visit www.TradeStation.com for further important information explaining what this means. Stocks Limp into the FedThe S&P 500 has been trying to hold its June high, and some traders may think it will break support.
The first pattern on today’s chart is the price zone between 7,563 and 7,618. It matches the trading range on June 1, an outside reversal day at record highs. The index stayed under that area in June and July, followed by a breakout in August.
SPX bounced near the zone in August and earlier this month. However, there was little follow-through and prices have returned to the range. Is support finally breaking?
Second, the current price action is happening at the 50-day simple moving average. That could reflect a weakening intermediate-term trend.
Third, the 8-day exponential moving average (EMA) is below the 21-day EMA. MACD is also falling. Those signals are potentially consistent with short-term bearishness.
Finally, 7,273 was the high on May 5 before a bullish gap. SPX bounced near that level in June and again in late July. That could make traders expect probing toward the same area, especially with energy prices and yields rising.
TradeStation has, for decades, advanced the trading industry, providing access to stocks, options and futures. If you're born to trade, we could be for you. Learn more here about TradingView’s Broker of the Year!
Past performance, whether actual or indicated by historical tests of strategies, is no guarantee of future performance or success. There is a possibility that you may sustain a loss equal to or greater than your entire investment regardless of which asset class you trade (equities, options or futures); therefore, you should not invest or risk money that you cannot afford to lose. Online trading is not suitable for all investors. View the document titled Characteristics and Risks of Standardized Options at www.TradeStation.com . Before trading any asset class, customers must read the relevant risk disclosure statements on www.TradeStation.com . System access and trade placement and execution may be delayed or fail due to market volatility and volume, quote delays, system and software errors, Internet traffic, outages and other factors.
Securities and futures trading is offered to self-directed customers by TradeStation Securities, Inc., a broker-dealer registered with the Securities and Exchange Commission and a futures commission merchant licensed with the Commodity Futures Trading Commission). TradeStation Securities is a member of the Financial Industry Regulatory Authority, the National Futures Association, and a number of exchanges.
TradeStation Securities, Inc. and TradeStation Technologies, Inc. are each wholly owned subsidiaries of TradeStation Group, Inc., both operating, and providing products and services, under the TradeStation brand and trademark. When applying for, or purchasing, accounts, subscriptions, products and services, it is important that you know which company you will be dealing with. Visit www.TradeStation.com for further important information explaining what this means.  Long
Long
 Long
Long
$QQQ Daily Close — Sep 14NASDAQ:QQQ Daily Close — Sep 14
Gap down reversal. NASDAQ:QQQ opened at 703.33, ran down to 702.74, then recovered all day to close 709.26. Still red on the session at −0.79%, but the shape of the bar is the story.
The 700 psych level held. That shelf has now been defended three times since June.
Why this bar is different from everything else in this range
For two weeks I've been saying the same thing on this chart: no stopping volume anywhere. Every bounce came on below-average volume. Every cloud reclaim was unconfirmed. Price kept holding levels because sellers were absent, not because buyers were present.
Today changed that.
Range came in at 10.21 against a 9.23 ATR — 111%, the first above-average range in two weeks. Volume 34.12M against a 30.64M average — 111% relative volume, the heaviest bar of this entire sequence.
Price broke below the weekly low at 706.86, pushed into the 700 zone, took out the stops sitting under it, and then reversed hard on expanding volume with a close in the upper part of its range.
That's a shakeout, and it carries stopping volume with it.
Here's the distinction that matters. Every prior bounce in this range was sellers stepping back. This one is buyers stepping in. Volume expanded and the range expanded on the recovery — more effort, more result. That's demand actually showing up, and it's the first time we've seen it since this range started.
Two honest caveats. The close finished at 64% of the range, not right at the high — strong, not maximum. And price is still below both @ripster47 EMA clouds. The signal is real; the trigger hasn't fired yet.
What confirms it
Full long confirmation is a close above 714, where the 5-12 and 34-50 clouds both sit. That's a 5-12 Curl and a 34-50 Crossed together.
And I want volume above 31M when it happens. We've had three cloud reclaims in this range on light volume and all three failed. Today's bar earns some benefit of the doubt, but the follow-through has to bring volume too, or we're right back to the same pattern.
The line below is 702.74. Lose it on volume and the shakeout failed — that converts a successful test of 700 into a failed one, and 686.78 opens up underneath.
I'm long from the reversal, managing against 702.74.
One thing worth internalizing from today: heavy volume at a major low is a buy signal, not a sell one. Most people see a gap down into a big level on the highest volume in weeks and read it as the breakdown starting. It's usually the opposite. The volume tells you someone was there to take the other side.  Long
Long
Tesla May Face ResistanceTesla bounced in August, but some traders may think the EV giant faces resistance.
The first pattern on today’s chart is the weekly low of $368.60 on June 26. TSLA held that level before its July 22 earnings report, but fell through it after the numbers hit. The stock has returned to stall at the same price zone, which could mean that old support is becoming new resistance.
Second, the 50-day simple moving average (SMA) is below the 200-day SMA. That may suggest a longer-term downtrend has begun.
Third, the falling 50-day SMA may be consistent with intermediate-term weakness.
Fourth, stochastics are dipping from an overbought condition.
Next, traders may eye the price zone between TSLA’s 52-week low of $297.38 and its 2025 low of $214.25 for potential probing.
Finally, TSLA is a highly active underlier in the options market. (Its average daily volume of 2.7 million contracts ranks second in the S&P 500 behind Nvidia, according to TradeStation data.) That could help traders take positions with calls and puts.
TradeStation has, for decades, advanced the trading industry, providing access to stocks, options and futures. If you're born to trade, we could be for you. Learn more here about TradingView’s Broker of the Year!
Past performance, whether actual or indicated by historical tests of strategies, is no guarantee of future performance or success. There is a possibility that you may sustain a loss equal to or greater than your entire investment regardless of which asset class you trade (equities, options or futures); therefore, you should not invest or risk money that you cannot afford to lose. Online trading is not suitable for all investors. View the document titled Characteristics and Risks of Standardized Options at www.TradeStation.com . Before trading any asset class, customers must read the relevant risk disclosure statements on www.TradeStation.com . System access and trade placement and execution may be delayed or fail due to market volatility and volume, quote delays, system and software errors, Internet traffic, outages and other factors.
Securities and futures trading is offered to self-directed customers by TradeStation Securities, Inc., a broker-dealer registered with the Securities and Exchange Commission and a futures commission merchant licensed with the Commodity Futures Trading Commission). TradeStation Securities is a member of the Financial Industry Regulatory Authority, the National Futures Association, and a number of exchanges.
Options trading is not suitable for all investors. Your TradeStation Securities’ account application to trade options will be considered and approved or disapproved based on all relevant factors, including your trading experience. See www.TradeStation.com . Visit www.TradeStation.com for full details on the costs and fees associated with options.
Margin trading involves risks, and it is important that you fully understand those risks before trading on margin. The Margin Disclosure Statement outlines many of those risks, including that you can lose more funds than you deposit in your margin account; your brokerage firm can force the sale of securities in your account; your brokerage firm can sell your securities without contacting you; and you are not entitled to an extension of time on a margin call. Review the Margin Disclosure Statement at www.TradeStation.com .
TradeStation Securities, Inc. and TradeStation Technologies, Inc. are each wholly owned subsidiaries of TradeStation Group, Inc., both operating, and providing products and services, under the TradeStation brand and trademark. When applying for, or purchasing, accounts, subscriptions, products and services, it is important that you know which company you will be dealing with. Visit www.TradeStation.com for further important information explaining what this means.  Long
Long
HIMS (Hims & Hers): Navigating Regulatory Friction
If you want a textbook example of explosive revenue growth colliding with heavy regulatory overhang, NYSE:HIMS is the chart to watch.
Looking at the 4-hour timeframe, the stock has suffered a brutal markdown from the $60 zone down to a capitulation bottom near $15. This was driven by a combination of a July 2026 FTC lawsuit regarding data privacy practices and an earlier FDA crackdown on compounded GLP-1 weight-loss drugs. However, the price is currently staging a fierce reversal, up 4.73% to $28.81, and successfully reclaiming the dynamic moving average.
The Fundamental Drivers & Moat
Despite the legal headlines, the underlying business is generating massive cash.
Surging Demand: Q2 2026 revenue hit $753 million, representing roughly 40% year-over-year growth. The platform boasts well over 2.5 million subscribers, validating their highly sticky, recurring revenue model.
The GLP-1 Pivot: After the FDA cracked down on compounded semaglutide, Hims pivoted strategically. They ceased promoting compounded GLP-1s and signed a direct distribution partnership with Novo Nordisk to sell branded Ozempic and Wegovy.
The Moat: Their competitive advantage is no longer just being a telehealth disruptor; it is their massive, locked-in distribution network. By transitioning to a certified distribution partner for Big Pharma, they act as the primary digital storefront for highly sought-after treatments, backed by a personalized care ecosystem.
The Technical Structure & Execution Plan
The chart shows a classic accumulation pattern following a capitulation event.
The Setup: The stock has established a solid floor in the low $20s and is currently pressing against local resistance in the $28.00 to $31.50 block. The moving average is curling upward, signaling a shift in near-term momentum.
The Trigger: I am looking for a confirmed 4-hour close above the $31.60 resistance level to signal a definitive structural breakout.
Price Targets: Once the $31.60 resistance is cleared, the immediate liquidity draw is the $36.70 zone. If the broader market absorbs the regulatory noise, the mid-term target is a gap-fill back to the $50.00 structural level shown on the chart.
Risk Management: Because this stock is highly sensitive to FTC and FDA news, keep a hard stop loss below the $25.40 support level.
Are you trading the technical reversal, or staying on the sidelines until the legal dust settles?
Follow us for more insights!  Long
Long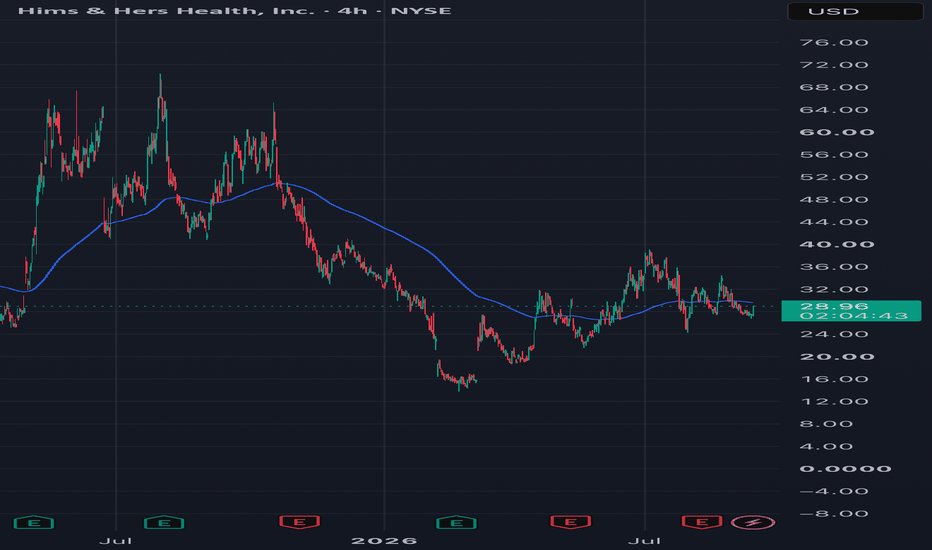
 Long
Long
Zano, solid low cap privacy coin in weekly supportZANO — A Low-Cap Privacy Project to Watch
Zano is a privacy-focused Layer 1 with an approximately $100 million market cap at the time of writing. Its main features include:
Private transactions: sender, receiver and transaction amounts are concealed.
Confidential Assets: users can issue tokens with built-in privacy.
Hybrid PoW/PoS: combines mining with staking to secure the network.
Private staking: Zarcanum conceals staked amounts.
The bullish thesis is that greater demand for financial privacy could drive adoption of both ZANO and its token ecosystem. Its small valuation leaves room for substantial percentage moves.
A sustained revaluation would need growing usage and liquidity—not just attention around privacy coins. Adoption, exchange access and execution remain key risks.
Zano’s latest upgrade, Hard Fork 6, activated on 26 August 2026 at block 3,833,000. Its main addition is Gateway Addresses, which simplify integration for exchanges, bridges and DEXs while preserving privacy for standard wallet transactions.
The release also includes stronger validation rules, improved decoy selection and hardened wallet encryption. It provides infrastructure for broader cross-chain access; further integrations and liquidity growth remain the developments to watch.
MEXC currently accounts for approximately $650K in daily ZANO/USDT spot volume, around 43% of tracked trading volume.
MEXC is showing the highest weekly volume candle since its first initial run in 2024.
The weekly 200 SMA and EMA on the weekly have potential for another bounce or reversal. Wicking to the 4.60 low is a possibility as a liquidity grab, weekly closures below 5 will confirm continuation of the bearish trend on the higher TF.
Low cap coins have thin orderbooks, relatively small orders can cause large spikes in price, Market stops may not fill at your intented price. Treat this one with caution, high risk but potential high reward.
 Long
Long
 Long
Long
 Long
Long
Long 
 Long
Long
 Long
Long