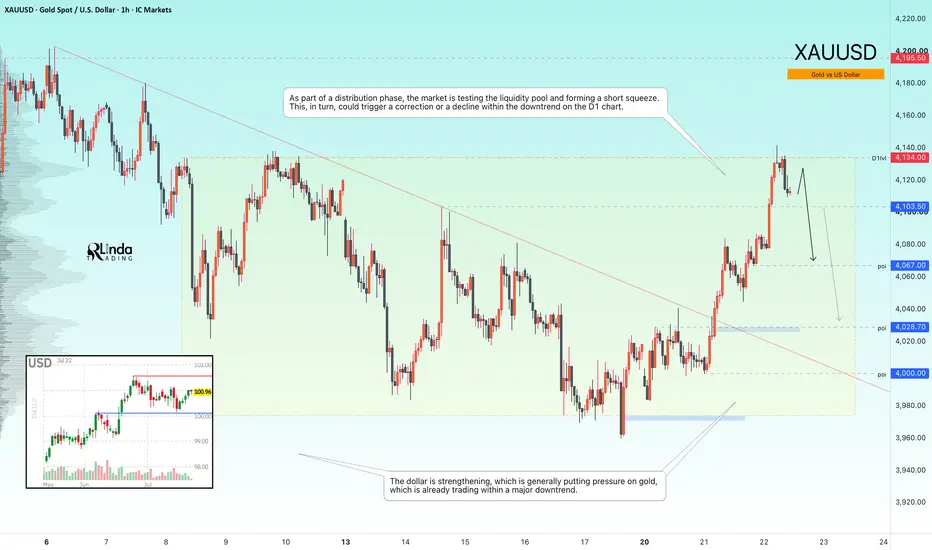
GOLD - A false breakout of resistance within a bearish trendICMARKETS:XAUUSD has broken out of its short-term descending channel within the current distribution phase and is now testing the 4134 liquidity zone while printing fresh intermediate highs. Despite the technical recovery, the broader fundamental backdrop remains weak
Gold remains caught between geopolitical support and pressure from hawkish Federal Reserve expectations and elevated real yields. Analysts note that a sustainable recovery would likely require lower oil prices, declining bond yields, and softer expectations for further monetary tightening. Until then, the upside potential is expected to remain limited.
At the moment, oil prices continue to rise, while the U.S. dollar has strengthened for a fifth consecutive session, maintaining its broader bullish trend.
Bullish drivers: Geopolitical de-escalation, Falling oil prices, A weaker U.S. dollar, Softer expectations for Fed rate hikes
Bearish drivers: Escalation of geopolitical tensions, Rising oil prices, Hawkish Fed rhetoric, Continued U.S. dollar strength
Resistance levels: 4124, 4134, 4195
Support levels: 4103, 4067, 4028
Technically, the market is testing a key liquidity pool within the current distribution phase and may be forming a short squeeze. If bears manage to keep price below the 4124–4134 resistance zone, it could trigger another leg lower in line with the broader daily bearish trend
Best regards,
R. Linda  Short
Short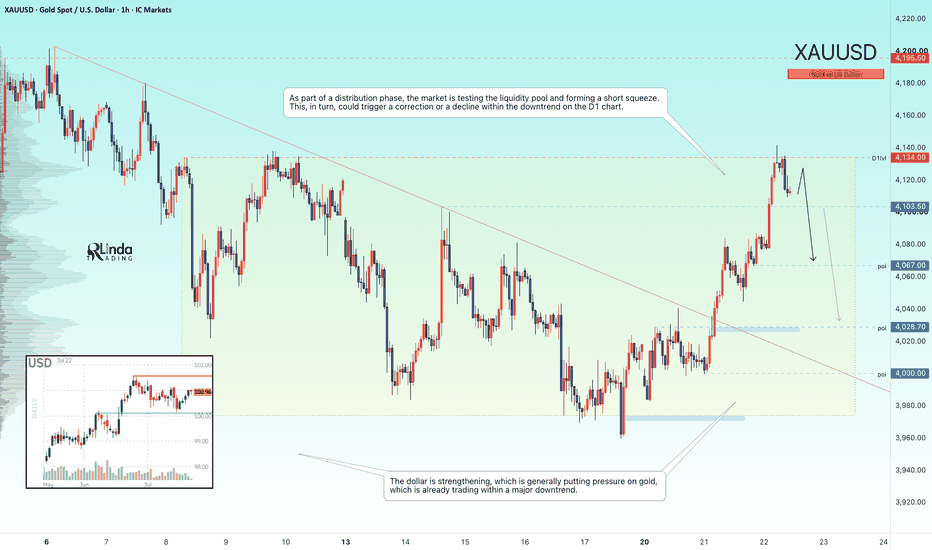
Gold Technical Analysis: Breakout Opens Path Toward 4,200$Hello traders! Here’s my technical outlook based on the current XAUUSD (1H) chart structure. XAUUSD previously traded inside a descending channel before forming a Double Bottom, where buyers regained control and triggered a recovery. Price later broke above a second descending channel, confirming strengthening bullish momentum. Currently, XAUUSD is trading above the 4,100 Buyer Zone while remaining below the 4,200 Seller Zone. The recent breakout and successful retest of support suggest buyers remain in control. As long as XAUUSD holds above the 4,100 Buyer Zone, the bullish scenario remains valid. A continuation higher could push price toward the 4,200 Seller Zone (TP1). However, a move back below the 4,100 Buyer Zone would weaken the bullish outlook. Please share this idea with your friends and click "Boost" 🚀 Long 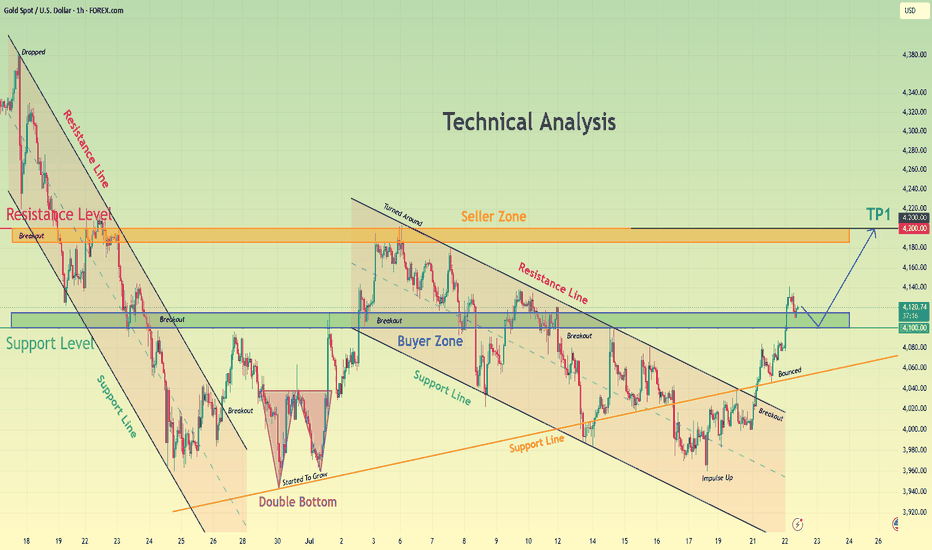
BTCUSDT: Retests Support Before Potential Rally Toward $68KHello everyone, here is my breakdown of the current BTCUSDT chart structure.
Market Analysis
BTCUSDT previously traded inside a broad descending channel before breaking below its lower boundary, confirming a strong bearish move. After finding support near the 64,300 Support Zone, buyers regained control and price formed a large symmetrical triangle, with multiple breakouts and successful retests signaling improving bullish momentum.
Currently, BTCUSDT is trading above the 64,300 Support Zone while remaining below the 68,000 Resistance Zone. The recent rebound from triangle support suggests buyers continue defending higher lows and are attempting to extend the recovery.
My Scenario & Strategy
As long as BTCUSDT remains above the 64,300 Support Zone and continues respecting the ascending triangle support, the bullish scenario remains valid. A continuation higher could push price toward the 68,000 Resistance Zone (TP1).
However, if BTCUSDT breaks below the 64,300 Support Zone and loses triangle support, bullish momentum would weaken and a deeper pullback could develop.
That’s the setup I’m tracking. Thank you for your attention, and always manage your risk.  Long
Long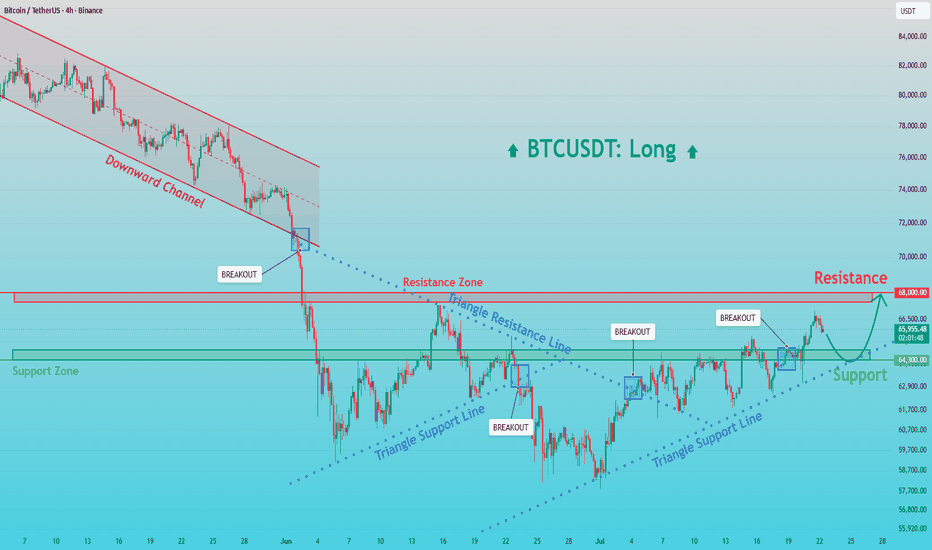
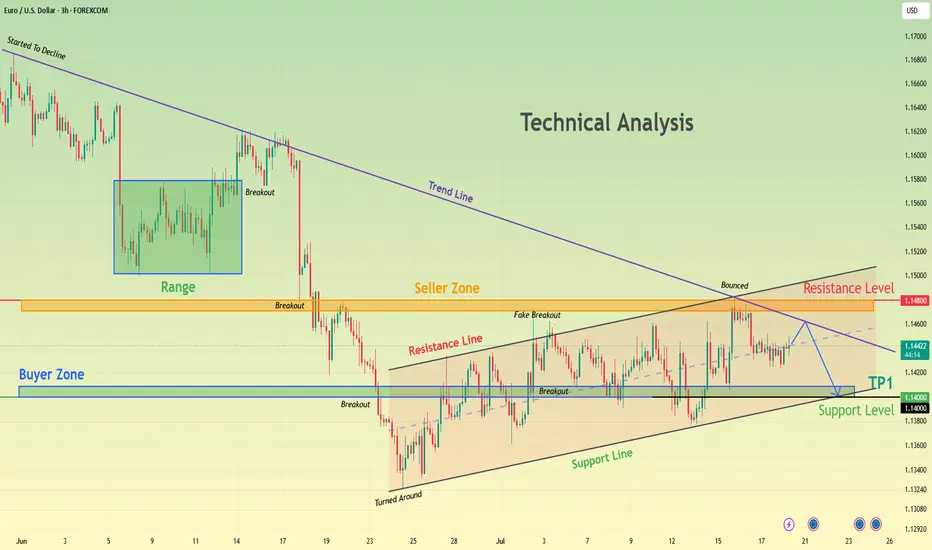
Euro Rebounds From Support — Can Buyers Reach 1.1460?Hello everyone, here is my breakdown of the current EURUSD chart structure.
Market Analysis
EURUSD previously traded inside a descending channel before breaking above the upper boundary, confirming a bullish shift in market structure. After establishing a strong base near the 1.1400 Support Zone, buyers continued to defend higher lows, allowing price to develop inside an ascending channel.
Currently, EURUSD is trading above the 1.1400 Support Zone while remaining below the 1.1460 Resistance Zone. The recent pullback held above channel support, suggesting buyers are still in control as long as the bullish structure remains intact.
My Scenario & Strategy
As long as EURUSD remains above the 1.1400 Support Zone and continues respecting the ascending channel, the bullish scenario remains valid. A continuation higher could push price toward the 1.1460 Resistance Zone (TP1).
However, if EURUSD breaks below the 1.1400 Support Zone and loses the ascending channel, the bullish outlook would weaken, allowing sellers to regain short-term control.
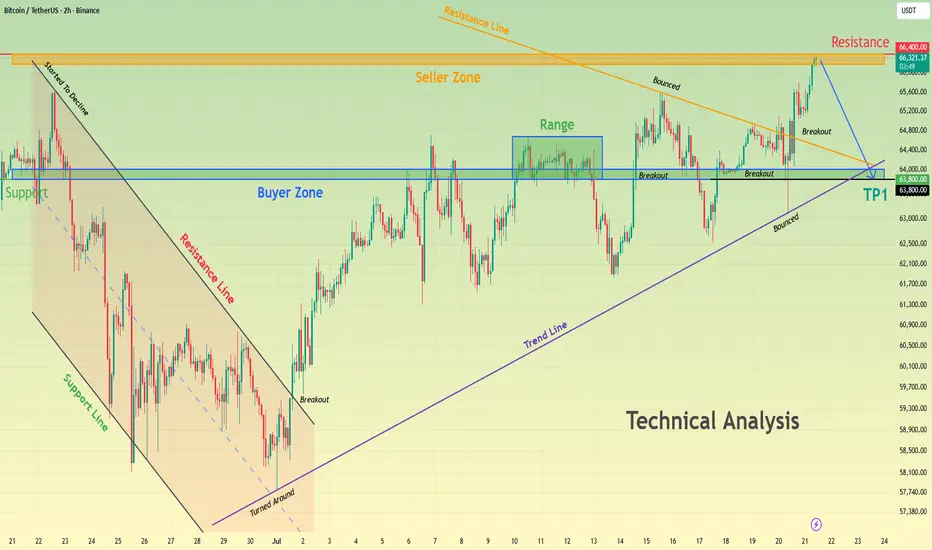
That’s the setup I’m tracking. Thank you for your attention, and always manage your risk. Bitcoin Faces Strong Resistance — Pullback Toward 63,800?Hello traders! Here’s my technical outlook based on the current BTCUSDT (2H) chart structure. BTCUSDT previously broke above a descending channel, confirming a bullish recovery. The rally has now reached the 66,400 Seller Zone, where price is facing strong resistance after an impulsive move higher. Currently, BTCUSDT is trading below the 66,400 Seller Zone while remaining above the 63,800 Buyer Zone. The strong rejection from resistance suggests buyers are losing momentum and sellers may attempt to regain control. As long as BTCUSDT remains below the 66,400 Seller Zone, the bearish scenario remains valid. A rejection from current levels could push price back toward the 63,800 Buyer Zone (TP1), where buyers may attempt to defend support. However, a confirmed breakout above 66,400 would invalidate the bearish outlook and open the door for further upside. Please share this idea with your friends and click "Boost" 🚀 Short 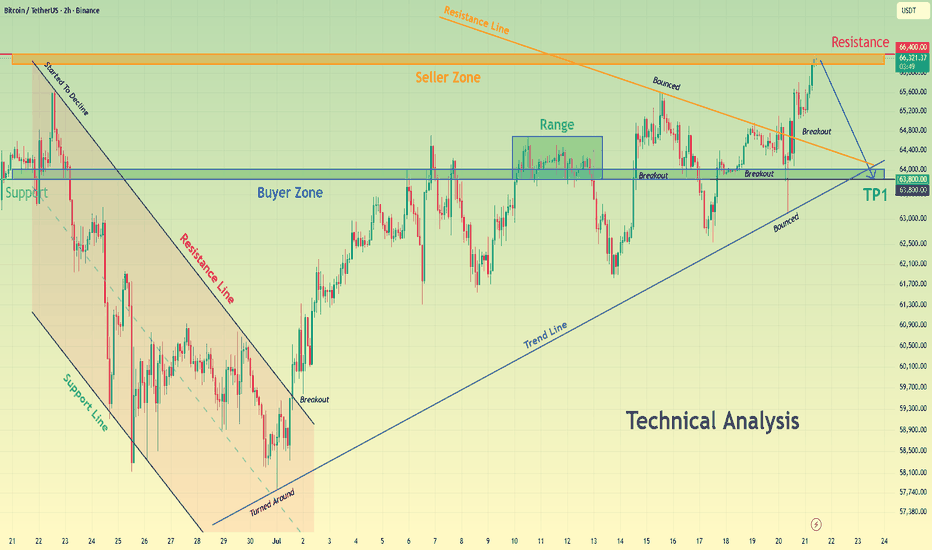
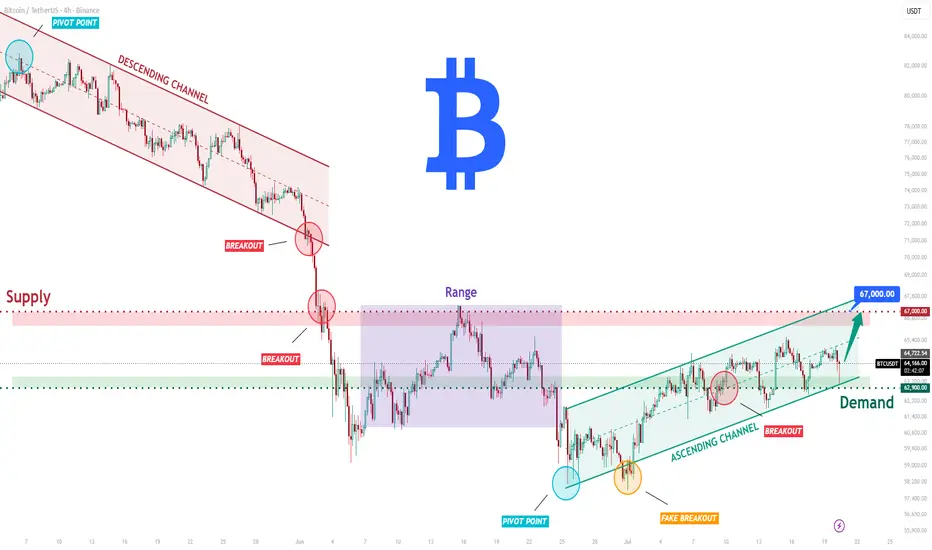
BTCUSDT Long: Climbs Toward $67K Resistance – Bulls in Control?Hello traders! Here’s my technical outlook based on the current BTCUSDT (4H) chart structure. BTCUSDT previously traded inside a broad descending channel before breaking below support, confirming a bearish shift. After consolidating inside a range, buyers regained control from the 62,900 Demand Zone and pushed price into an ascending channel. The recovery has now reached the 67,000 Supply Zone.
Currently, BTCUSDT is trading above the 62,900 Demand Zone while approaching the 67,000 Supply Zone. Price continues to respect the ascending channel, although the nearby supply area may trigger selling pressure.
As long as BTCUSDT remains above the 62,900 Demand Zone and holds within the ascending channel, the bullish scenario remains valid. A continuation higher could push price toward the 67,000 Supply Zone (TP1). Manage your risk! Long 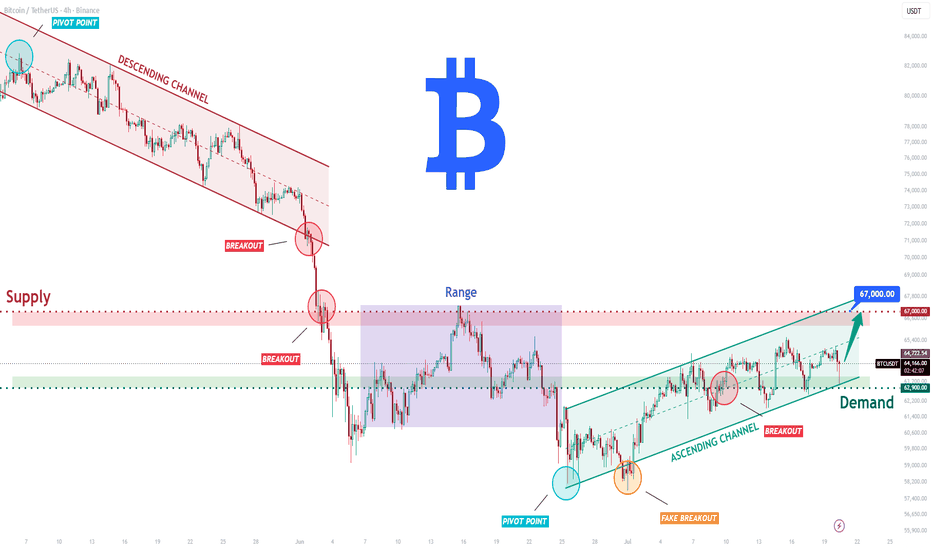
BTCUSDT Short: Rejected at 67,000 - Retest 64,500 Demand ZoneHello traders! Here’s my technical outlook based on the current BTCUSDT (1H) chart structure. BTCUSDT remains inside an ascending channel, keeping the broader bullish structure intact. After a fake breakout below the 64,500 Demand Zone, buyers regained control and pushed price toward the 67,000 Supply Zone, where sellers reacted.
Currently, BTCUSDT is trading above the 64,500 Demand Zone while remaining below the 67,000 Supply Zone. The recent rejection from the upper channel boundary increases the likelihood of a pullback.
As long as BTCUSDT stays below the 67,000 Supply Zone, a correction toward the 64,500 Demand Zone (TP1) remains the preferred scenario. However, a breakout above 67,000 and channel resistance would strengthen bullish momentum and signal another leg higher. Manage your risk! Short 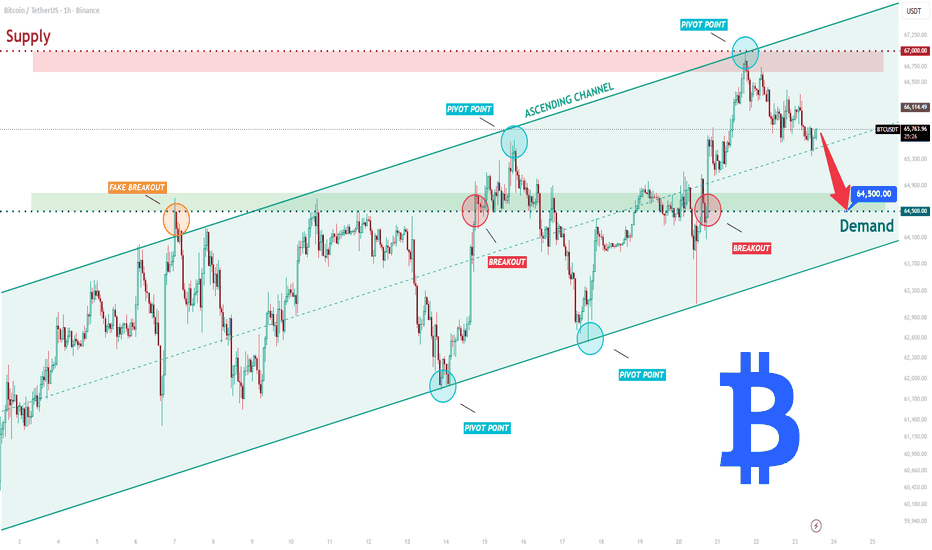
DATAPATTNS is showing a bullish move at an ascending channelNSE:DATAPATTNS has been in a sustained bullish trend for several months and has recently found support at the lower boundary of its ascending channel on the daily timeframe , reinforcing the likelihood of continued upward momentum.
Additionally, the sectoral index , NSE:NIFTY_IND_DEFENCE , has retested its all-time-high with a morning star pattern , providing further confirmation of relative strength among the sectors and supporting the top-down approach.
The Daily RSI(14) at 47.51 is also indicating a bullish reversal signaling a potential formation of a higher low with a fresh leg up . The stock has currently tested its 50-day EMA with a hammer and a support at its previous broken resistance (Change in polarity) reinforcing the bullish setup.
With a move above 4355 , NSE:DATAPATTNS could potentially move towards 4660. Consider entering above the high of the hammer with a stoploss at 3800 on a daily closing basis.
Key Support Levels: 4230,4140,3800.
Targets: 4660,4930.5
Disclaimer:
Investments in the securities market are subject to market risks, read all related documents carefully before investing. Securities quoted here are exemplary, not recommendatory. I am not a SEBI registered financial advisor, please consult your financial advisor before investing. Please note that I do not guarantee any assured returns for the securities quoted here.
Stay updated with my latest trading ideas and market analysis by following me on TradingView.
Hari Narayan N
Chartered Market Technician (CMT – All 3 Levels Cleared)
 Long
Long
Pullback Before the Next Move Higher?Hi everyone!🐻🦬🌴
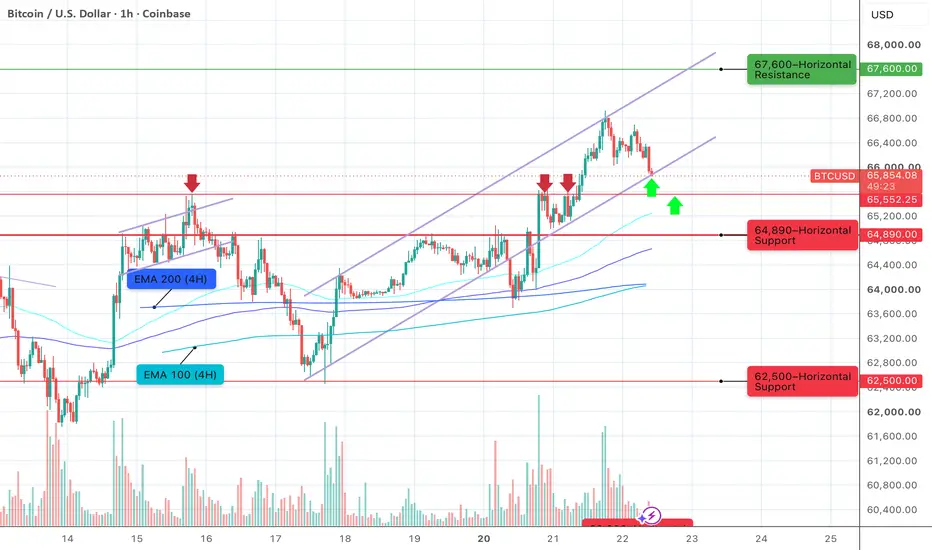
Bitcoin came within just $676 of my 67,600 target yesterday before pulling back 👾
❗️Looking at the way price broke above 65k, I don’t think this rally is over yet. To me, this is only the beginning of the current bullish leg. So far, the move continues to develop inside the ascending parallel channel shown on the chart.
Another important development is the new local support at 66,550. This level acted as resistance several times over the past week and may now provide support on the way up.
The lower boundary of the channel is by no means a “concrete” level. As you can see, price has already produced several false breakdowns below it. The same goes for 65,500.
Still, during a healthy uptrend, local support levels don’t have to be perfect to stop a pullback. That’s exactly why it’s worth keeping them on the chart.
🦬🚀 Bullish scenario.
As long as Bitcoin holds above 65k, I view the current pullback as a healthy pause before another attempt to break through 67,600.
The next leg higher could start either from the lower boundary of the channel around 65,850 or from the horizontal support at 65,500 (green arrows on the chart🟢).
🐻🪓 Bearish scenario.
If Bitcoin fails to regain and hold above 65k, sellers may take back control, opening the door to a much deeper correction toward:
- 62,500 — Key support where price has been consolidating since early June.
- 60,800 — Local horizontal support.
- 60,000 — Strong horizontal support.
Trade safe, and see you in the next update!
Peace 🌄
⚠️ Disclaimer:
All information shared on this channel is for educational and informational purposes only and is not investment advice. The author is not responsible for your trading decisions. Always manage your risk and make your own decisions. Long 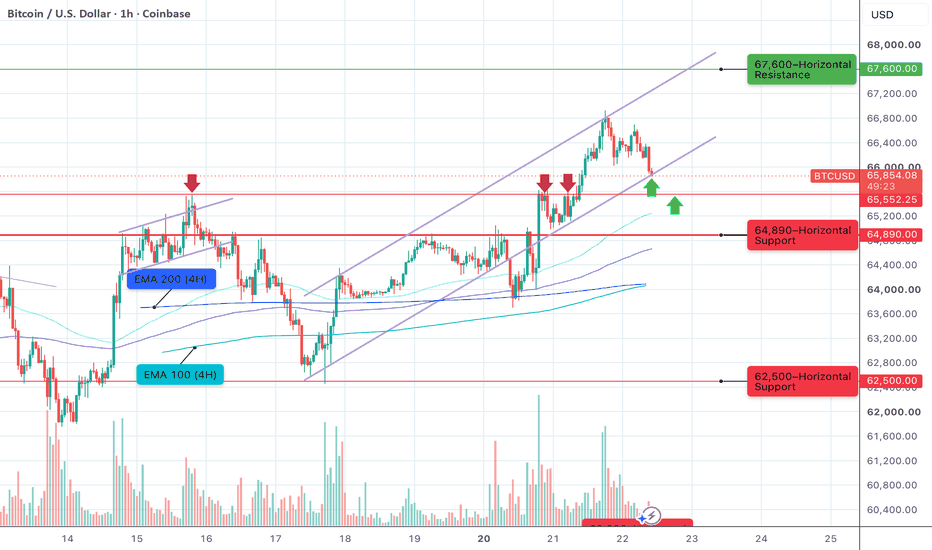
 Long
Long
Bitcoin Fake Breakout — Is a Bigger Correction About to Begin?Bitcoin ( BINANCE:BTCUSDT ) has experienced an upward trend over the past few days, and many traders were expecting Bitcoin to at least reach the 200_EMA(Weekly). However, due to the increasing geopolitical tensions in the Middle East and the possibility that these tensions could intensify in the coming days and nights, the market situation has changed.
At the same time, U.S. stock indices such as the S&P 500 ( CAPITALCOM:SPX500 ), as well as precious metals like Gold ( OANDA:XAUUSD ) and Silver ( OANDA:XAGUSD ), have started to decline, while the Dollar Index ( TVC:DXY DXY) has started to rise. Therefore, it seems unlikely that Bitcoin can continue its rally against this increasing macroeconomic pressure.
Before starting the technical analysis, it is important to mention that any news, statements, or developments related to the Middle East tensions over the next 24 hours could have a significant impact on risk assets such as Bitcoin.
Bitcoin has once again moved below the resistance zone($65,630-$64,650) and the 50_EMA(Daily), which could be considered a potential fake breakout.
From an Elliott Wave perspective, it appears that Bitcoin’s recent upward move could be part of a corrective structure, potentially forming a Double Three Correction(WXY).
Also, we can see a bearish Butterfly Harmonic Pattern in the 4-hour time frame.
Based on the points mentioned above, I expect Bitcoin to continue its bearish trend. After breaking the Ascending Channel support line, Bitcoin could decline at least toward the $63,300 level. If bearish momentum increases, we could expect a deeper correction.
First Target: $63,300
Second Target: $62,180
Stop Loss(SL): $66,400
Key levels: $64,120 _ $62,800 _ $66,000
Cumulative Short Liquidation Leverage: $67,700-$67,100
Cumulative Long Liquidation Leverage: $64,440-$63,460
Cumulative Long Liquidation Leverage: $61,830-$60,550
What’s your view on Bitcoin? Do you think Bitcoin can resume its bullish trend, or should we expect a correction similar to other markets?
Note: Any news, statements, or developments related to the ongoing Middle East tensions could quickly affect Bitcoin’s price action and other risk assets.
💡 Please respect each other's opinions and express agreement or disagreement politely.
📌Bitcoin Analysis (BTCUSDT), 4-hour time frame.
🛑 Always set a Stop Loss(SL) for every position you open.
✅ This is just my idea; I’d love to see your thoughts too!
🔥If you find it helpful, please BOOST this post and share it with your friends. Short 
 Long
Long
XAUUSD - Downward Channel Continues, Target at 3,790XAUUSD is trading around 4,048 and remains entirely within its H4 downtrend channel. Previous rallies have consistently created lower highs, indicating that buyers lack the strength to break the dominant downtrend structure.
The current macroeconomic context also supports a bearish scenario. The USD is maintaining near its one-week high, while the yield on 10-year US Treasury bonds is around 4.59%. High oil prices continue to fuel inflation concerns and expectations that the Fed may keep interest rates high for longer, thereby increasing the opportunity cost of holding gold.
The price is currently approaching the 4,035–4,080 resistance zone, while also being close to the upper trendline of the channel. If this area continues to be rejected, the rebound may only be a pullback before selling pressure returns.
A H4 candle closing below 3,990 would reinforce the possibility of price heading towards 3,900, and further to the target zone around 3,750–3,790. Short 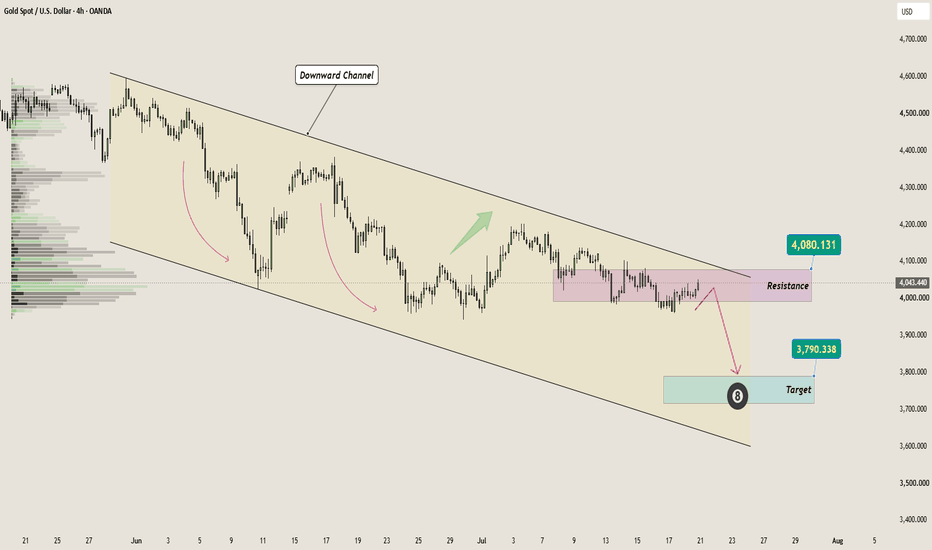
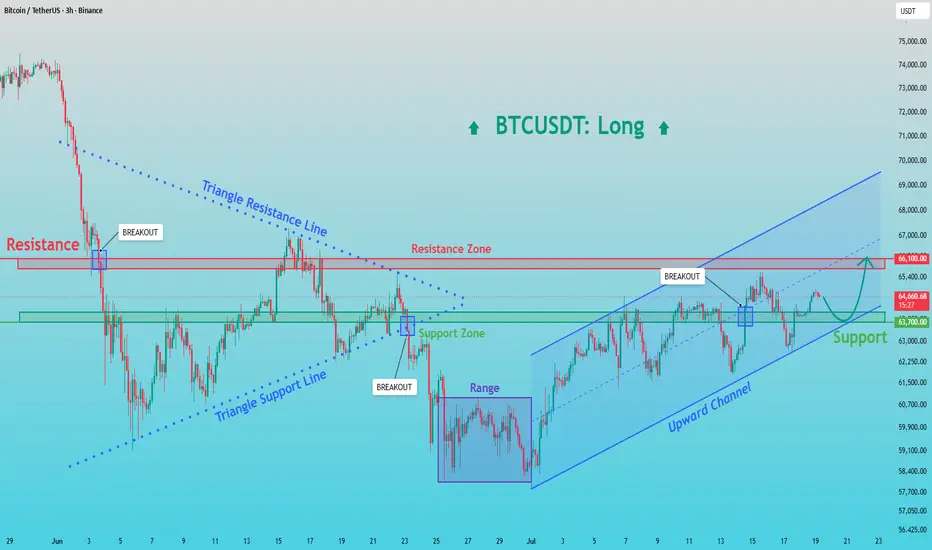
BTCUSDT: Buyers Target $66.1K After Successful Support RetestHello everyone, here is my breakdown of the current BTCUSDT setup.
Market Analysis
BTCUSDT previously traded inside a large symmetrical triangle before breaking below support, confirming a bearish move. After finding support, price consolidated inside a range and later broke higher into an ascending channel, signaling that buyers have regained short-term control.
Currently, BTCUSDT is trading above the 63,700 Support Zone while remaining below the 66,100 Resistance Zone. Price continues to respect the ascending channel, and the recent pullback has successfully retested the former breakout area, where buyers are attempting to resume the uptrend.
My Scenario & Strategy
As long as BTCUSDT remains above the 63,700 Support Zone and continues respecting the ascending channel, the bullish scenario remains valid. A continuation higher could push price toward the 66,100 Resistance Zone (TP1).
However, if BTCUSDT breaks below the 63,700 Support Zone and loses the lower boundary of the channel, bullish momentum would weaken, increasing the risk of a deeper pullback.
That’s the setup I’m tracking. Thank you for your attention, and always manage your risk. Long 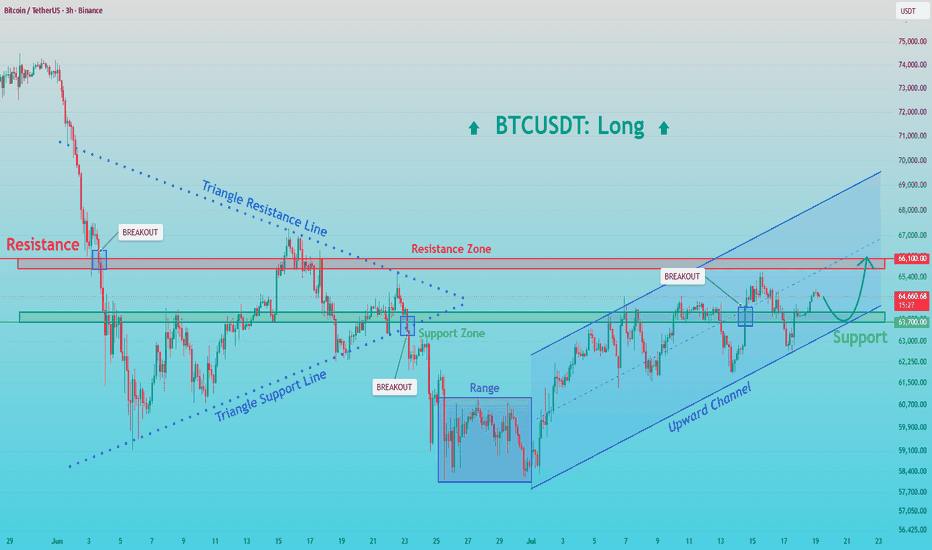
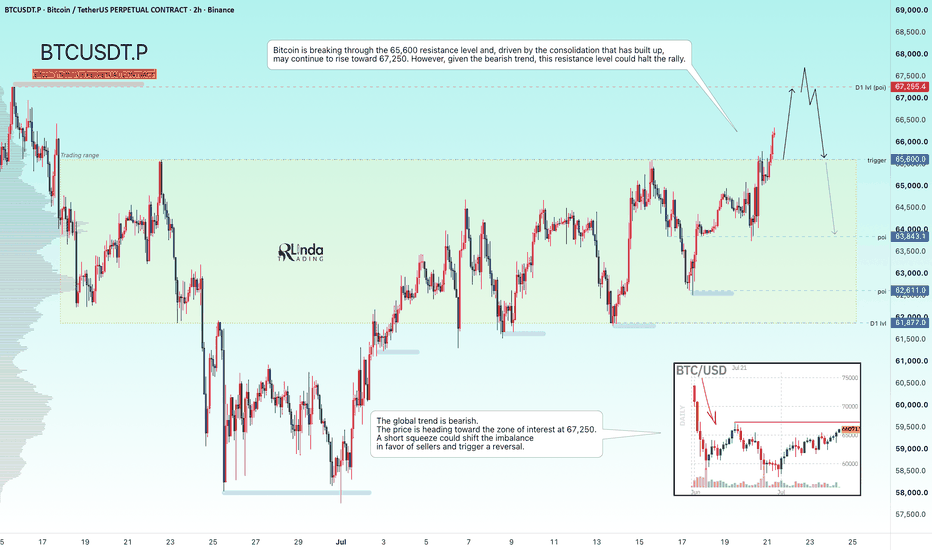
BITCOIN - A distribution toward 67K before a decline?BINANCE:BTCUSDT.P has transitioned from consolidation into a distribution phase following the breakout above resistance and is now advancing toward a key resistance zone within the broader bearish trend
The fundamental backdrop remains relatively weak for the cryptocurrency market. However, spot Bitcoin ETFs have recorded inflows for five consecutive trading sessions, providing short-term support for the current rally.
From a technical perspective, Bitcoin has broken above the 65,600 resistance level, and the momentum built during consolidation could drive price toward the 67,250 resistance zone. Nevertheless, given the prevailing higher-timeframe bearish trend, this area may act as a significant barrier and halt the advance
Resistance levels: 67,250
Support levels: 65,600, 63,800, 61,800
The broader market trend remains bearish. Price is approaching the key 67,250 resistance zone, where a short squeeze could shift momentum back in favor of sellers. If bears regain control at this level, Bitcoin could reverse and resume its primary downtrend toward 65,600, 63,800, and 61,800
Best regards,
R. Linda Short