AAPL : Ascending Channel Breakout & Bullish Flag Continuation
Technical Analysis & Chart Overview
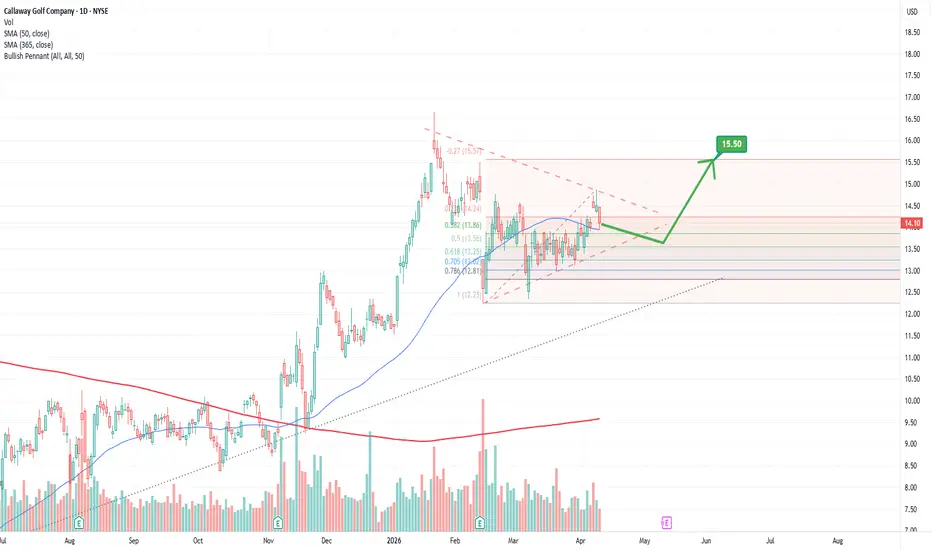
Market Structure: Apple (AAPL) is trading inside a long-term ascending parallel channel on the 4-hour timeframe. The price recently swept lower liquidity near $314.78, forming a clear Hammer reversal candlestick on the daily timeframe at the channel's lower trendline support.
Current Pattern: Price has broken out above the local horizon support/resistance zone ($338.60–$341.93) and is currently consolidating in a tight Bullish Flag / Ascending Triangle consolidation above the breakout level.
Key Levels:
Support Levels: $338.60 (Immediate breakout retest zone) | $314.78 (Major Channel Support & Daily Hammer Low)
Target Zone: $370.00 – $380.00 (Upper Boundary of Ascending Channel)
Trade Setup:
Look for a clean breakout and hold above the upper edge of the micro-flag (~$342.00) or a minor pullback retesting $338.60.
Targeting the upper channel resistance near $375.00+.
Fundamental Analysis
Valuation & Growth: Apple continues to demonstrate strong top-line momentum, driven by expansion in high-margin Services and strong hardware upgrade cycles. With price holding strong above previous all-time highs, market sentiment remains distinctly bullish.
Capital Return & Margins: Strong gross margins and ongoing share buybacks provide a structural floor under price dips, making major channel supports heavily defended by institutional buyers.
Key Upcoming Economic News & Events
Macroeconomic data and corporate events can induce high volatility and directly impact market direction:
The U.S. Q2 GDP (Third Estimate) and Personal Income and Outlays (PCE Inflation) report will be released on September 30, 2026, at 8:30 AM ET; as the Fed's preferred inflation gauge, lower PCE figures strengthen rate-cut expectations and boost mega-cap tech valuations.
The U.S. Non-Farm Payrolls (NFP) Employment Situation report will drop on October 2, 2026, at 8:30 AM ET, heavily influencing broader market risk sentiment by providing a clear signal of labor market strength and consumer spending power.
The U.S. Consumer Price Index (CPI) report is scheduled for October 14, 2026, at 8:30 AM ET, serving as a critical short-term volatility trigger that directly impacts Federal Reserve interest rate forecasts and tech sector valuations.
The Apple Q4 FY2026 Earnings Release will take place on October 29, 2026, after market close, acting as the main corporate catalyst for channel target realization depending on iPhone demand and Services revenue growth.
Disclaimer: This analysis is for educational and informational purposes only and does not constitute financial, investment, or trading advice. Trading stocks and options involves significant financial risk. Always manage your risk carefully and perform your own analysis prior to executing any market positions  Long
Long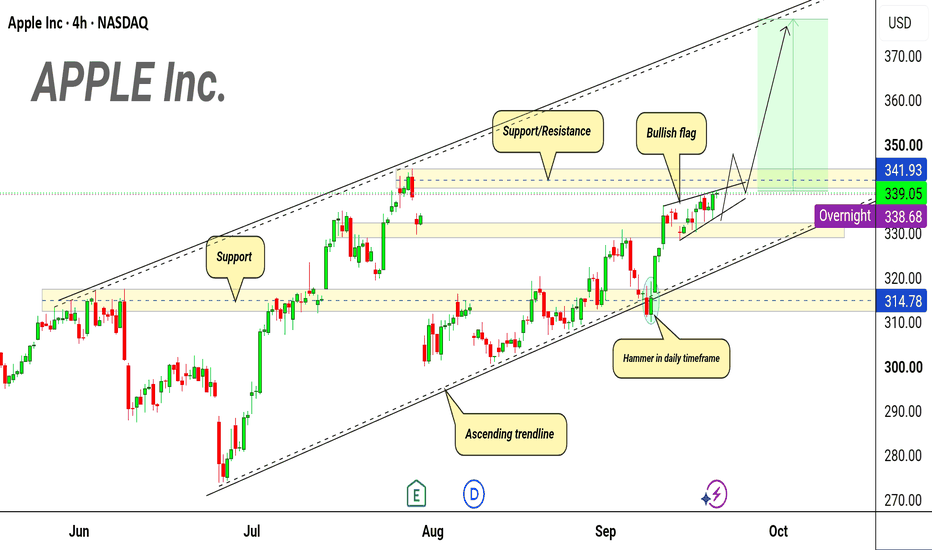
 Long
Long
 Long
Long
Gold The Bull Flag Awaits ResolutionQuiet sessions test a trader's patience far more than volatile ones ever will.
Following yesterday’s structural shift where the Inverse Head & Shoulders pattern triggered our buy idea, Gold expanded nicely into a local high. Since the start of today's Asian and European sessions, however, price action has slowed to a crawl.
This sideways movement is not a sign of weakness; it is a textbook digestion phase forming a Bull Flag pattern on the H1 timeframe.
As we approach the end of the trading week, quiet morning sessions often act as liquidity traps. The market is winding up its spring, and the resolution of this flag structure will likely be dictated by the opening of the US session, where institutional volume enters the tape.
The Execution Strategy
Our overall bias remains Bullish as long as price respects the structural boundaries below.
We are looking for a clean upside breakout from the top trendline of this flag pattern to confirm the next leg higher.
Pattern Target: 4620.0
Invalidation Level: 4384.0
If price drops and closes below 4384 , the flag structure fails, the bullish continuation thesis is canceled, and we step aside immediately.
There is no need to force trades during Friday's mid-day lull. We let the US session bring the volume and let the breakout confirm our bias.
Risk Warning:
This analysis is provided strictly for educational purposes and does not constitute financial advice. Gold is highly volatile, especially during session opens and Friday market closes. Always apply strict risk controls.  Long
Long
 Long
Long
 Long
Long
 Long
Long
Long 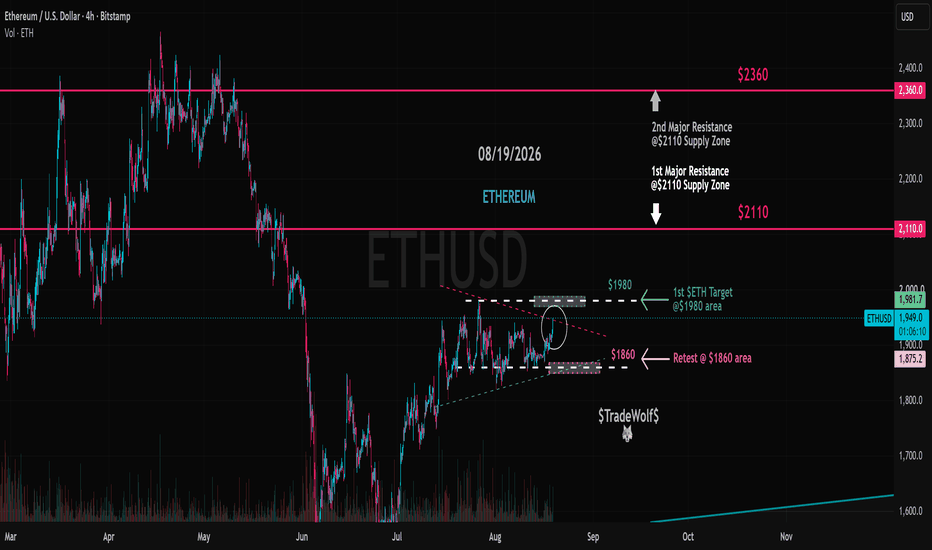
SPX: Bullish pennant, but CPI can decide the breakout📊 SPX: Bullish pennant, but CPI can decide the breakout
SPX is compressing inside a bullish pennant after a strong rally from the 7,320-7,400 area.
Price is holding above 7,697, but buyers still need a clean breakout above 7,760-7,796 to confirm continuation.
The index is trading near record highs, but the market is cautious ahead of the U.S. CPI release on August 12, 2026.
Recent upside was supported by strong earnings, AI optimism, and weaker jobs data that reduced fear of an immediate Fed hike. But oil volatility and inflation risk are still the main pressure points.
So the pennant makes sense: buyers are not giving up, but the market is waiting for the next catalyst.
RSI is near 49, so momentum is neutral.
Stoch RSI is low, which can support a short-term bounce attempt.
MACD is fading, meaning SPX needs a real breakout, not just sideways compression.
If SPX breaks above 7,796, the bullish pennant can open the way toward 7,850-7,880.
If price loses 7,697, the pattern weakens and the next support is 7,640, then 7,536.
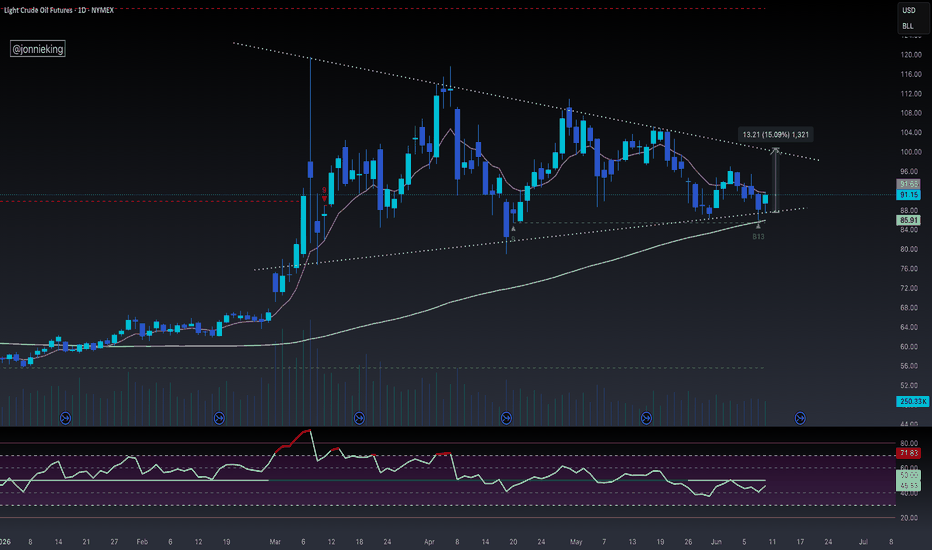
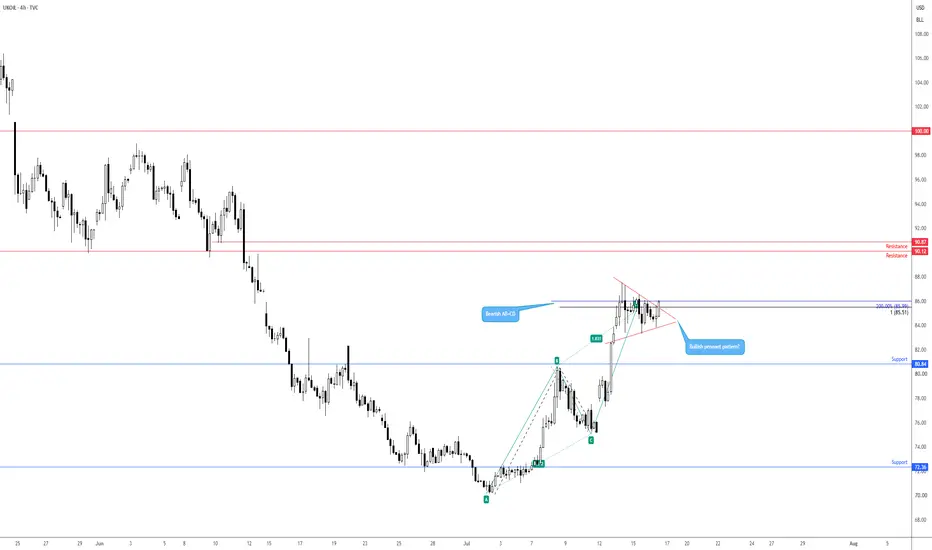
⚠️ Not financial advice. USOIL: Bullish pennant meets a mixed EIA Report📊 USOIL: Bullish pennant meets a mixed EIA Report
WTI is still holding inside a bullish pennant after the strong move toward $83.50. Price is consolidating near $82.20-$82.30, and the market is waiting for a clean breakout or breakdown.
The latest EIA report was not simple. U.S. crude inventories jumped by 17.4M barrels to 424.4M barrels, while analysts expected a small draw. On the surface, that is bearish because commercial supply increased sharply.
But the reason matters: the build was driven mainly by higher imports and lower exports. U.S. crude imports rose to about 7.3M barrels per day, while exports fell to around 3.1M barrels per day. That means more oil stayed inside the U.S. system.
At the same time, the Strategic Petroleum Reserve fell to around 298.7M barrels, below the symbolic 300M level and the lowest level since 1983. This is why the market is not reading the inventory build as purely bearish: commercial stocks are rising, but strategic reserves are historically low.
Imports from Canada and Venezuela also increased, showing that the U.S. is actively rebuilding crude supply flows. That can cap panic in the market, but it also confirms that energy security remains a major theme.
If WTI breaks above the pennant, buyers may target $84.50-$85.00. If price loses the lower pennant support, the first downside zone is $80.50-$80.00.
Key takeaway: the EIA build is bearish on the headline, but the SPR drop and rising imports make the story more complex. That is why WTI is consolidating, not collapsing.
⚠️ Not financial advice. USDCAD: Is the breakdown real or just a stop hunt?📊 USDCAD: Is the breakdown real or just a stop hunt?
🔥 What happened?
USDCAD broke below the short-term consolidation support near 1.3928-1.3930 and is now trading around 1.3920.
The pair remains under the descending trendline and below EMA9, EMA20, SMA50 and SMA200 on the 30-minute chart. This keeps the short-term structure bearish unless buyers quickly reclaim the broken zone.
🧠 Macro background
The Canadian dollar is getting some support from oil volatility. WTI remains sensitive to Middle East / Hormuz headlines, and stronger oil usually helps CAD.
For USD, the main focus is the upcoming U.S. CPI release on August 12, 2026. A hotter CPI could support the dollar, while softer inflation may pressure USD further.
Bank of Canada’s next rate decision is scheduled for September 2, 2026, so for now USDCAD is mainly reacting to USD inflation expectations, oil, and short-term technical flow.
📉 Indicators
RSI is around 37, showing weak momentum but not full oversold panic yet.
MACD remains negative, confirming bearish pressure.
Price is below EMA9, EMA20 and SMA50, while the SMA200 is much higher near 1.3976. This means buyers need a reclaim before the chart can shift back to neutral.
USDCAD is breaking below the main bearish pennant after a sharp downside impulse from the 1.4020-1.4030 area.
Inside the pennant, price also formed a smaller falling wedge, which may explain the short-term bounce attempt from 1.3918. But as long as price stays below 1.3928-1.3930, this bounce is only a retest of broken support.
If USDCAD fails below 1.3928-1.3930, the bearish continuation scenario remains active, with downside targets at 1.3918, then 1.3900.
If price reclaims 1.3930, the breakdown may turn into a false break and open a recovery toward 1.3945.
⚠️ Not financial advice. Gold-A Bullish Correction With One Level That Changes EverythingOANDA:XAUUSD Gold is currently forming a clear corrective structure on the 1H timeframe after a strong bullish impulse.
The important point is that the current move still looks corrective rather than impulsively bearish. Price is consolidating inside a well-defined structure, while the broader short-term bias remains bullish.
However, the market does not owe us the bullish scenario .
At the beginning of the week, Gold could still move lower and respect the corrective pattern before making its next attempt higher. In fact, that would not necessarily weaken the setup — as long as price respects the key support area.
🟢 BULLISH SCENARIO
The main area I am watching is the $4300–$4280 Pullback Zone.
If Gold returns to this area, I will be looking for confirmation rather than blindly buying the level.
The confirmation could come in several forms:
• A strong bullish rejection
• A bullish candlestick pattern
• A stop hunt / liquidity sweep followed by recovery
• A clear lower-timeframe bullish structure
• Strong buying pressure after testing the zone
Any of these signals could provide a valid reason to consider a long position.
There is also another way to enter the move.
If price breaks above the upper boundary of the corrective structure with strong momentum and confirms the breakout, the breakout itself could become the trigger for a bullish continuation.
The technical target of the pattern is around:
$4454
This is the measured target of the current structure.
But a target on the chart is not a promise.
We still need to see how Gold behaves on the way there. If the market gives us a different message, we adapt.
🔴 BEARISH SCENARIO
The bullish structure has a clear line in the sand:
$4244
If Gold breaks and holds below $4244, the current bullish thesis becomes invalid.
At that point, I would no longer look for long setups simply because the bigger picture was bullish.
Instead, I would wait for bearish price action and a new market structure to develop before considering short positions.
The important levels are therefore:
$4300–$4280 → Pullback / potential buying zone
$4244 → Bullish invalidation level
$4454 → Pattern target
For now, the structure is bullish and corrective.
I am not interested in predicting every candle.
I want the market to show the setup first.
If Gold gives us rejection and bullish confirmation around the pullback zone, we act.
If it breaks the pattern resistance with confirmation, we can act.
If $4244 breaks, we change our view.
That is the difference between predicting the market and trading the market.
Let the price tell us what comes next.
Disclaimer: This analysis is for educational purposes only and reflects a personal interpretation of the current market structure. Tomorrow's macroeconomic events, including the interest rate decision, may cause sharp volatility in either direction. Always wait for confirmation, manage your risk carefully, and never risk more than you can afford to lose. Long 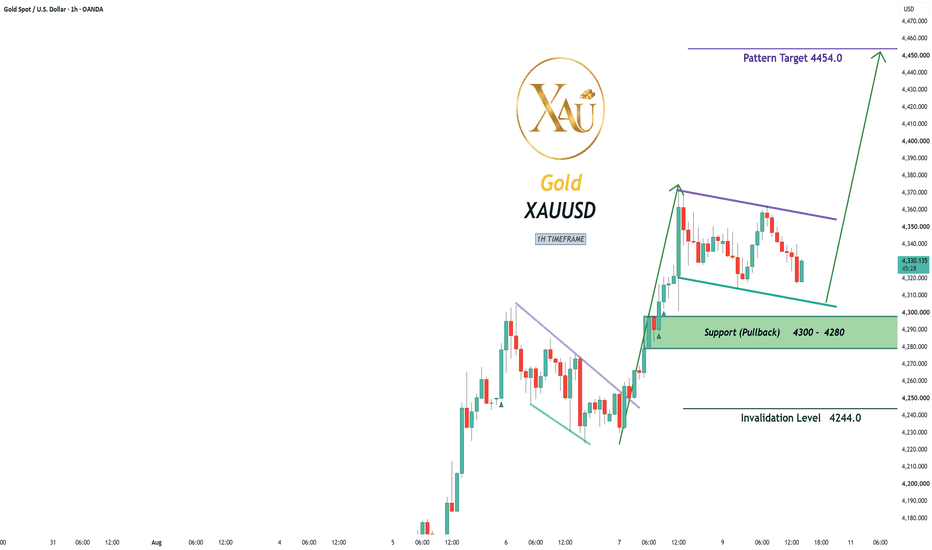
 Long
Long
FTSE 100 bull pennant puts record retest in playIt is natural for an index to pause after hitting record highs. It does not automatically have to jackknife higher. Over the course of this week, several old-economy indices like the DAX and ASX have pushed into record territory, with some going on with the move. Given what we are seeing in yield curves, metals and elsewhere, it feels as though markets are preempting a reflationary period ahead, which would generally be expected to help an index such as the FTSE 100.
Right now, the price appears to be coiling in what resembles a bull pennant structure. That points to the potential for an eventual bullish breakout, although the price action should dictate the trade rather than the pattern itself.
The price is currently testing the lower boundary of the structure and has been doing so for around half a day. If it continues to bounce from that area, traders could look to initiate longs, allowing for a tight stop to be placed beneath 10,875 for protection, initially targeting a retest of the upper end of the pennant just below 10,950.
Others may be prepared to show some patience and wait to see which side of the structure the price eventually breaks. A move above the descending trendline would provide another potential entry point for longs, allowing for a tight stop to be placed back beneath the breakout zone for protection. The initial target would be the current record high at 10,991.6. If that level gives way, it would point to a further extension of the prevailing bullish trend.
On the downside, a break beneath the lower boundary of the pennant would negate the immediate bullish bias and open the door to a potential retracement towards 10,840, where the price has bounced on several occasions over recent weeks. Beneath that, 10,800 and 10,760 are the levels to watch.
For now, the oscillators are offering little guidance on directional risks. RSI (14) is sitting almost exactly at 50, while MACD remains in positive territory after crossing below its signal line earlier this week. It's a broadly neutral message, placing greater emphasis on the price action in the near term.
Good luck!
DS  Long
Long
 Long
Long
 Long
Long
 Long
Long
 Long
Long
Long