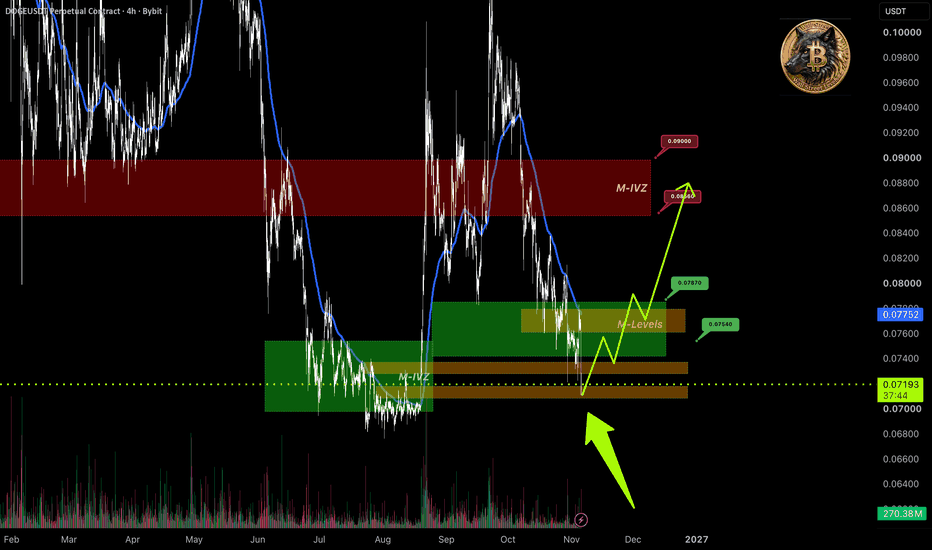
$DOGE: Large player limit bids at support. Scaling in.BYBIT:DOGEUSDT.P
Price returned to the 📊M-Levels support zone. Adding the second part of the position on the lower TF after buyer reaction worked perfectly. As expected, the level played out cleanly, backed by limit bids from 🐋large players.
🧩IMA confirms: 🐋large players are defending this level, actively buying the dip.
Current phase: waiting for upside impulse to develop.
Risk remains: break and hold below the support zone cancels the long scenario.
Idea played out.
If this breakdown was us
Pivot Points
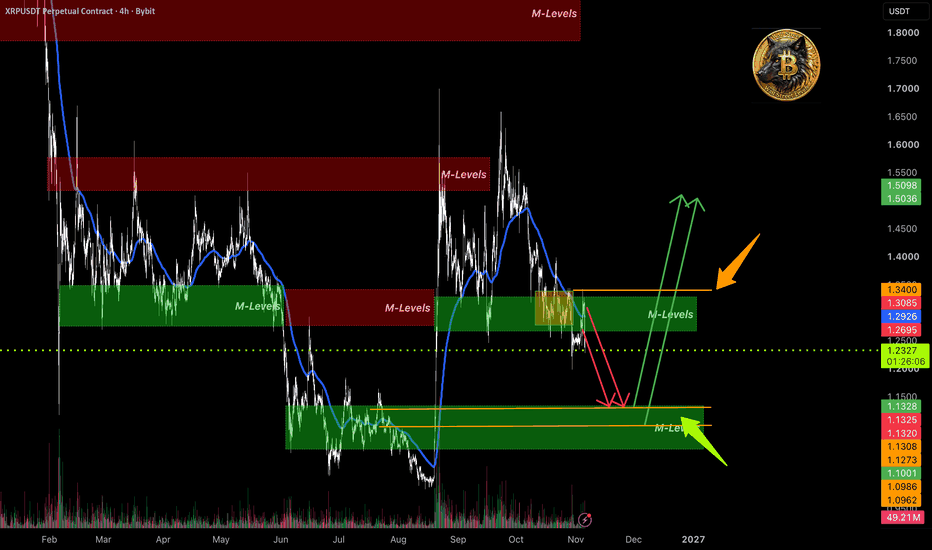
$XRP: Support broken. Heading to targetBYBIT:XRPUSDT.P
Price sitting at $1.3228. Level failed to hold, playing out exactly as planned in the main short scenario.
🎯Target: $1.1325.
🧩IMA confirms: 🐋large players not defending this level, impulse driving down.
Risk remains: reclaim and hold above $1.3500 cancels the scenario.
Idea played out.
If this breakdown was useful — please like the main post via the link above to support the channel.
Analysis from me — support from you 🚀.
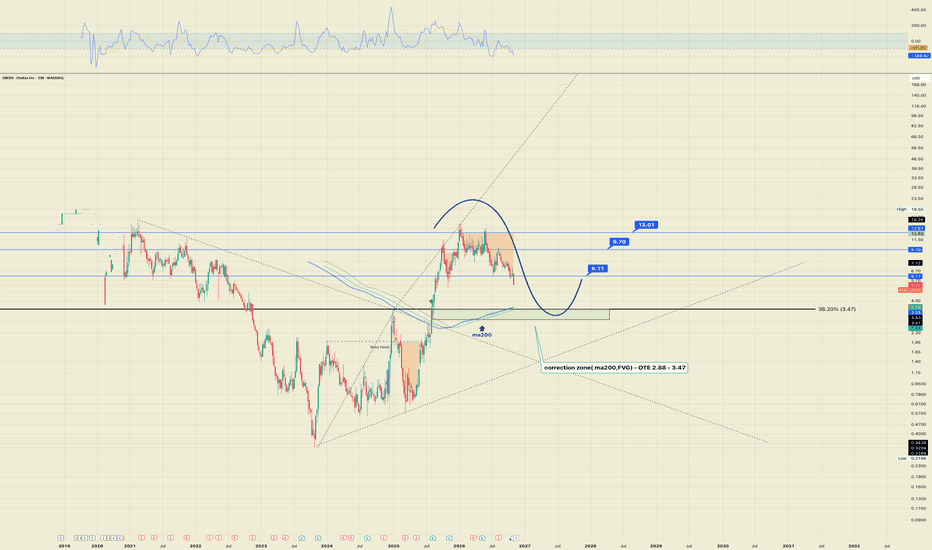
ONDS: Technical Retracement and Demand Zone Test $2.88 – $3.47The correction following the impulse wave has entered the supply exhaustion phase. Opening long positions at current levels is inefficient due to the intermediate price positioning within the structure. The optimal institutional demand zone is defined in the $2.88 – $3.47 range, where the 38.2% Fibonacci retracement level ($3.47), the long-term ma200, and the fair value gap coincide.
The current drawdown lacks aggressive market sellers, progressing on fading vertical volumes and depleted open i
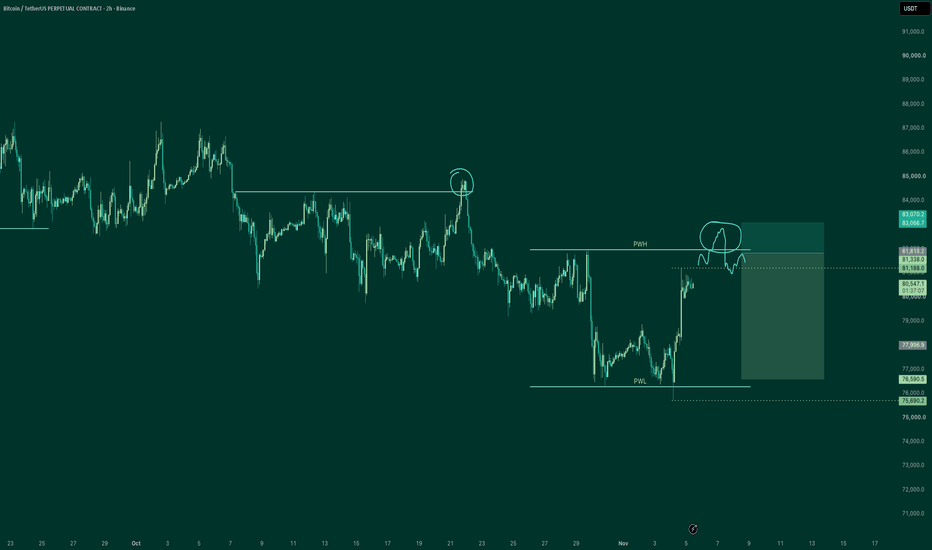
BTC - The $82K Bait and the Unfinished Business at $75K
As outlined in the previous post/update, the expected volatility drop materialized, but it front-ran the actual target. Price dumped into the $75.6K zone, leaving the primary liquidity pool at $75K entirely untouched.
When a major support boundary is front-run this closely, it usually means the market is engineering trapped liquidity for a later, harder sweep. The core thesis for a flush to $75K remains fully intact.
The Setup: The $82K Liquidity Trap
The catalyst for the final leg down to $7
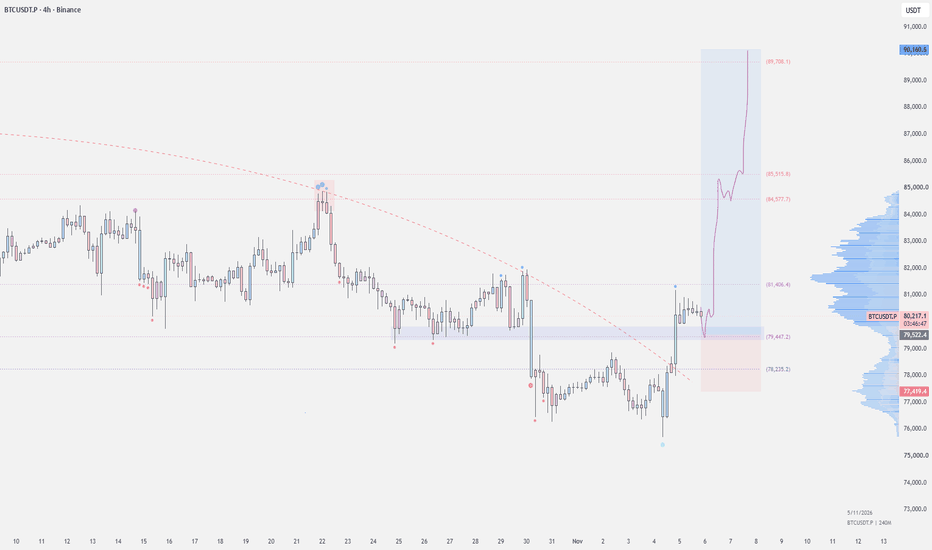
$BTC - Market Update (11/5)We're seeing two-sided absorption here, with the last 4 hours showing more signs of spot selling getting absorbed by buyers.
Binance spot saw $49.4M in net selling, while Coinbase spot saw +$5.7M in net buying.
On Binance spot, 969 BTC in aggressive buying was met with 409 BTC in net new sell offers. Meanwhile, 1,561 BTC in aggressive selling hit the bids, but buyers replenished a net 1,274 BTC.
Despite the selling pressure, price only slipped 0.12%. Bids are absorbing the sell flow, but buye
$BTC: Trade update. Scenario played out.BYBIT:BTCUSDT.P
Price returned to the entry zone 📊M-Levels $75000-$77000. First target $80200 was taken earlier, the remainder of the position closed at breakeven.
Current phase: waiting for buyer reaction at this historical support.
Risk management: break and hold below $75000 activates the short scenario with targets in the $69000-$71600 zone.
Idea played out.10/30
If this breakdown was useful — please like the main post via the link above to support the channel.
Analysis from me — support
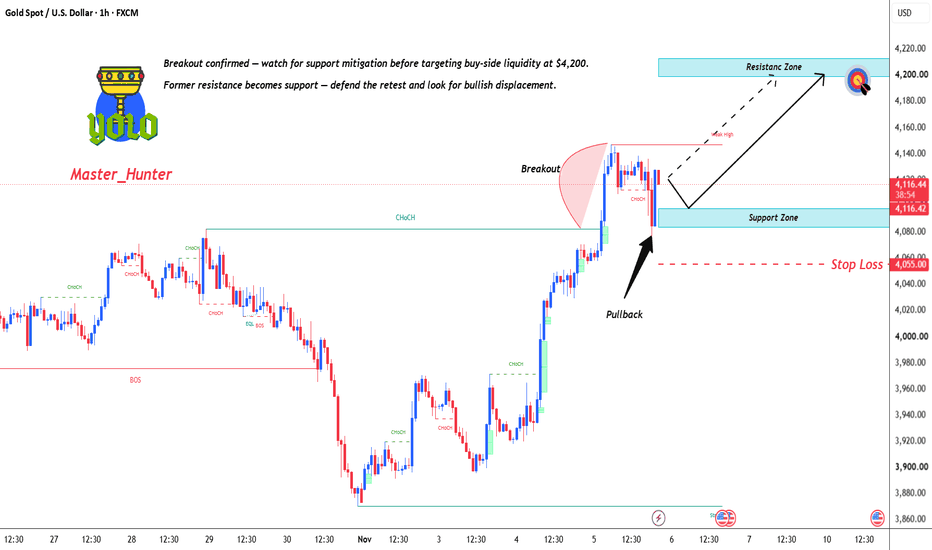
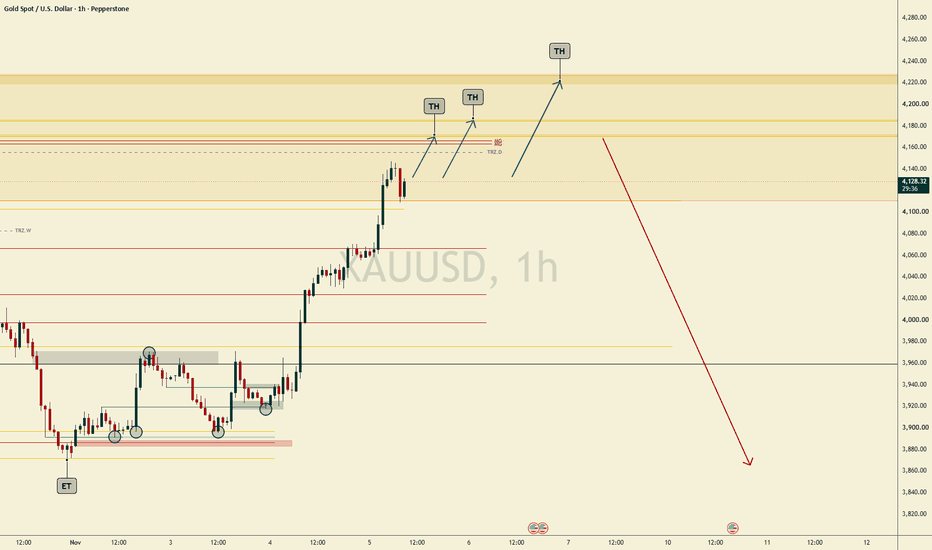
XAUUSD: Breakout–Retest Setup — Weak-High Liquidity at $4,200?Hook :
XAUUSD has broken above its previous resistance and pulled back toward a key support zone — setting up a potential breakout–retest opportunity. If buyers successfully defend $4,080–$4,100, the next upside objective is the weak-high area around $4,200. 🔥
Market Context :
Gold is showing signs of bullish continuation on the 1H chart following a breakout and subsequent pullback.
Rather than chasing the initial bullish impulse, the setup focuses on a retest of the reclaimed support
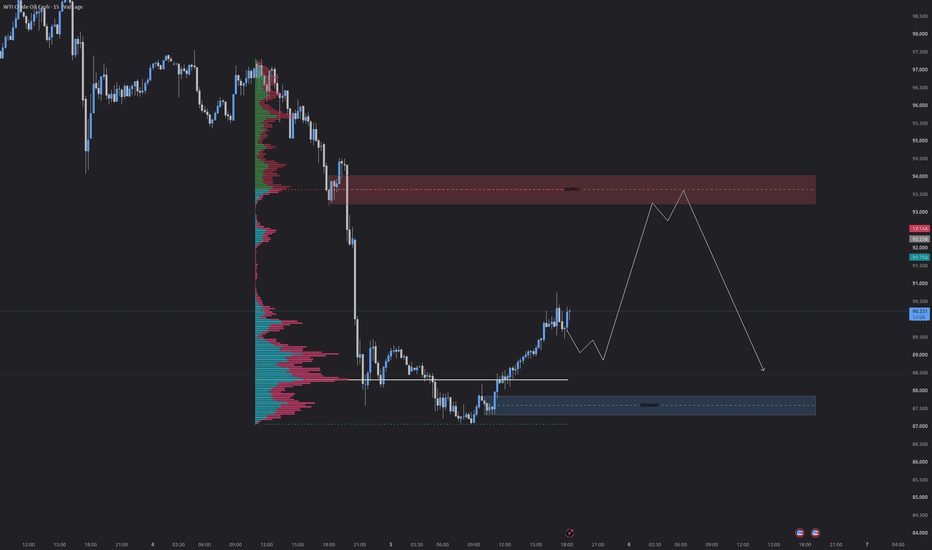
USO POTENTIAL BEARISH REACTION AFTER RETRACEMENT**Title:** WTI 15m — Demand bounce, watching supply
Crude sold off hard from the 97s into the 87s and left an imbalance behind. Buyers stepped in at **87.50–88.00**, but this bounce does not change the trend yet.
The level that matters is supply at **93.30–94.00**, where the breakdown started. I expect price to revisit that zone. If sellers defend it, I look for shorts back toward 89 and then 88.00–87.50.
A hold above supply would be the first real change of character. Until then, I treat ral
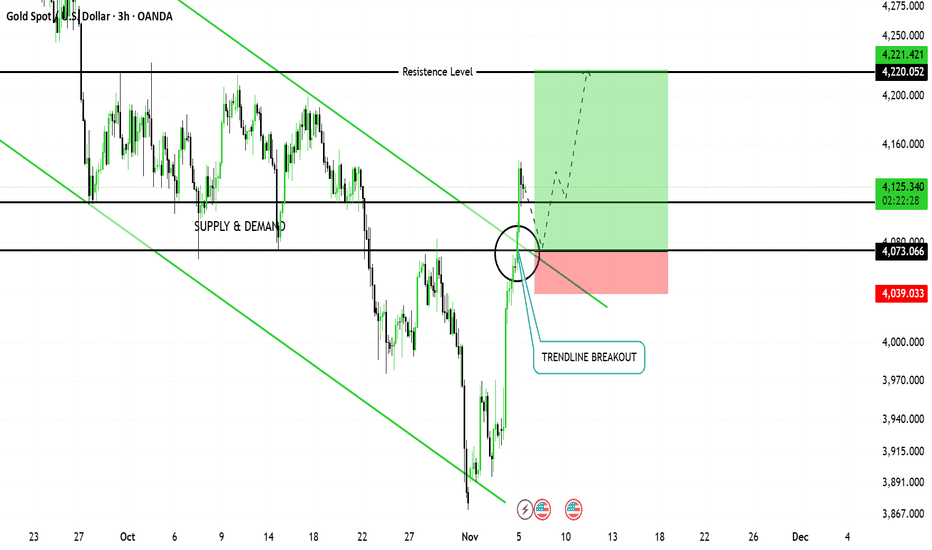
XAUUSD Trendline Breakout Puts 4,220 Resistance in FocusGold has pushed above the descending trendline after a strong recovery from the recent lows.
The breakout is now being tested around the 4,073 area, while the next major resistance is near 4,220.
Key levels
Breakout / retest area: 4,073
Current price: around 4,123
Major resistance: 4,220
Invalidation: below 4,039
If the breakout holds and buyers maintain momentum, the 4,220 resistance level becomes the next major upside objective.
A failure back below the breakout area would weaken the b
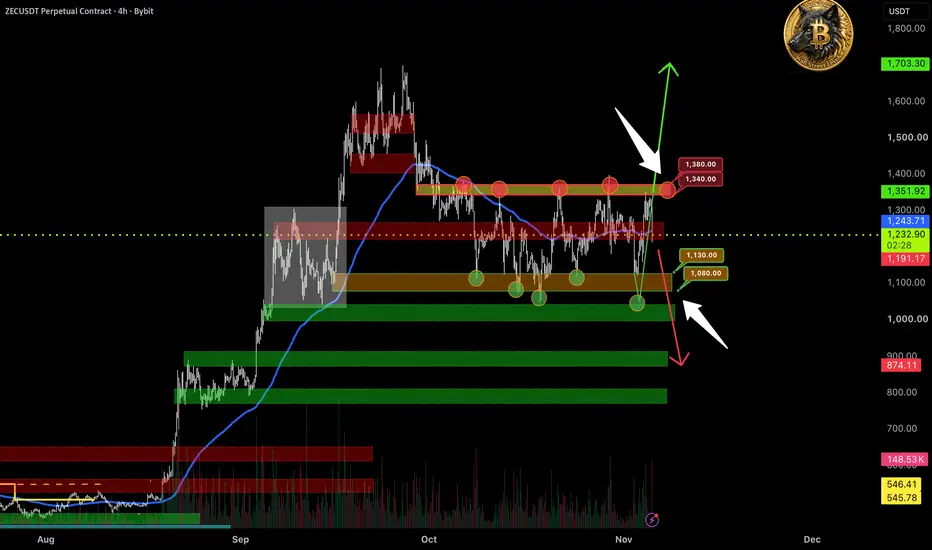
$ZEC: Resistance held perfectlyBYBIT:ZECUSDT.P
Price tapped the 📊M-Levels $1340-$1380 zone. Level held, exactly as in the main scenario. Failed to reclaim, price dropped.
🧩IMA confirmed zero capital inflow on the breakout attempt.
Current phase: waiting for the drop to the lower range boundary 📊M-Levels $1080-$1130.
Risk remains: break and hold above $1380 cancels the short scenario.
Idea played out.
🔗
If this breakdown was useful — please like the main post via the link above to support the channel.
Analysis from me — sup
XAUUSD: Trend in 30 Min timeframeThe color levels are very accurate levels of support and resistance in different time frames, and we have to wait for their reaction in these areas.
So, Please pay special attention to the very accurate trend, colored levels, and you must know that SETUP is very sensitive.
BEST,
MT
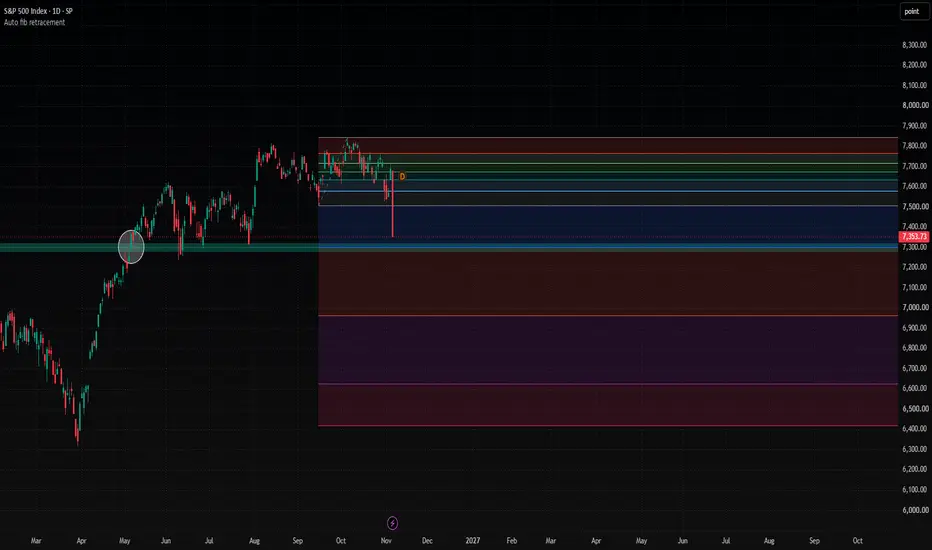
S&P500 - Important ZoneIf the SPX stabilizes above this zone, it could initiate an upward move on the daily(2D) timeframe. While entering a long position in this area carries significant risk, waiting for confirmation above this level could reveal favorable entry opportunities. Please note that this is not a signal; it is simply an update on the S&P 500 shared with you.
GBPUSDGBPUSD – 1H Timeframe 📉
Our most recent 4H candle has closed very bearish, showing signs of strong selling momentum.
Now, we’re looking for an entry. I drop down to the 1H timeframe and map a Fibonacci retracement from the recent high to the recent low.
We then wait for price to tap into our Fibonacci zone before taking the sell.
Stop loss: Just above the Fibonacci zone.
Take profit: Towards the Fibonacci extensions.
Enjoy!
# XAUUSD — 270-Dollar Bullish Move Delivered | Three Potential RGold has delivered a remarkable bullish move from approximately $3,880 to $4,150, in line with our previously published short-term bullish outlook.
What makes this move particularly important is that **our broader market outlook remained bearish throughout the rally.**
We identified the bullish opportunity from the lower technical areas while maintaining our expectation of a potential bearish reversal from higher levels.
The green circles on our chart highlight several important price reactions
Bitcoin, with a bearish structure, is heading toward $72KAs you can see, Bitcoin is still trading below a clear bearish trendline, which continues to act as resistance. We also have a bearish CH (Change of Character), and the overall market structure remains bearish, with consistent lower highs and lower lows being formed.
At the moment, Bitcoin has bounced from an important support zone that has two potential targets. I’m watching these targets closely, as either the first or the second target could provide the next opportunity for the bearish move
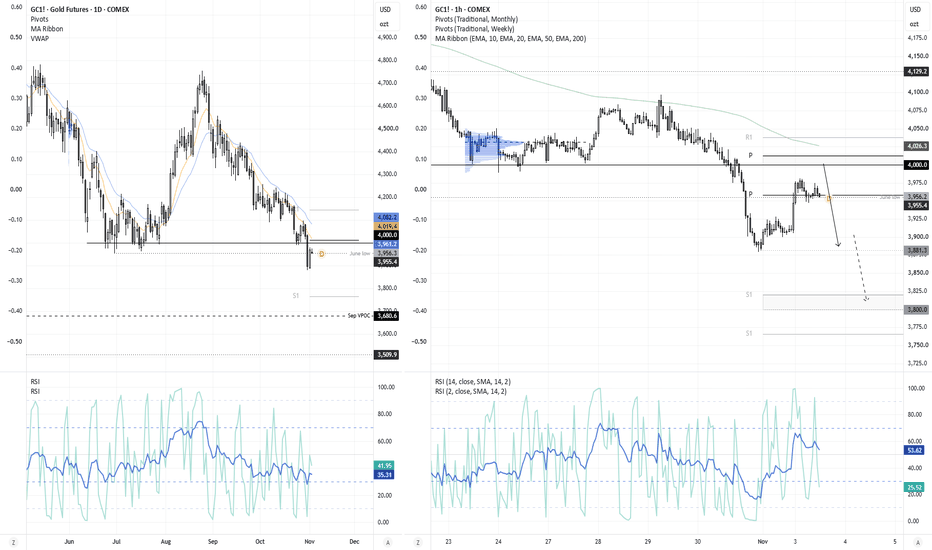
Gold Bears Eye $3,880 as $4,000 Resistance LoomsGold prices broke decisively below 4,000 last week – killing off my assumption that bulls were quietly accumulating above that level. While prices recouped some of those losses on Monday, they remain below 4,000 – making it a pivotal level for traders over the near term.
The 1-hour chart shows prices holding above the weekly pivot point for now, but with the monthly pivot and weekly R1 sitting just above 4,000, bears may be seeking to fade rallies towards these levels. The near-term target is j
BTCUSDT Analyses-83, October 30, 2026Two Zones, Two Possible Directions
$BINANCE
Bitcoin's 1H structure remains bearish following the recent sharp decline. Instead of entering immediately, I'm watching two marked zones for either a reversal or a confirmed breakout.
• Upper zone — 78,652: A bullish breakout could open the path toward 80,224, 81,778 and 83,277.
• Lower zone — 76,837: Holding this area could trigger a recovery. Losing it would expose the critical 75,632 support.
• Bearish continuation: A confirmed break below 75,632
USDCAD: Too Overbought?! 🇺🇸🇨🇦
USDCAD may retrace after a false violation of a daily key level.
A formation of a bearish imbalance candle on an hourly time frame indicates the overbought state of the market.
The price may drop to 1.404 level.
❤️Please, support my work with like, thank you!❤️
I am part of Trade Nation's Influencer program and receive a monthly fee for using their TradingView charts in my analysis.
CHFJPYCHFJPY – 4H Timeframe
Another breakdown of a trade I took yesterday.
Not my own strategy, but something I came across online and have been working on…
4H candle closure.
Price swept the high and closed below it, indicating two things:
1. A potential high of the day.
2. Sellers stepping in.
Stops placed above the previous candle, with a 2:1 risk-to-reward target.
Simple.
USDJPYUSDJPY –
I wanna break down this USDJPY trade I took this morning…
So, on the 4H timeframe, two 4H candles before the entry, price swept the low and closed back above it, indicating that sellers had finished. Price created a low and failed to make a new low.
Dropping down to the 1H timeframe, I mapped out my Fib. Pretty simple: recent low to high.
Price came back to test our Fib zone – I took my buy. Boom. Job done.
But can you see how clean and simple trading can be?
You don’t need fancy