S&P 500 at All-Time High — Is a Major Correction Next?The S&P 500 ( CAPITALCOM:SPX500 ) is currently trading near its All-Time High(ATH=$7,625) and continues to move within a resistance zone($7,625-$7,524).
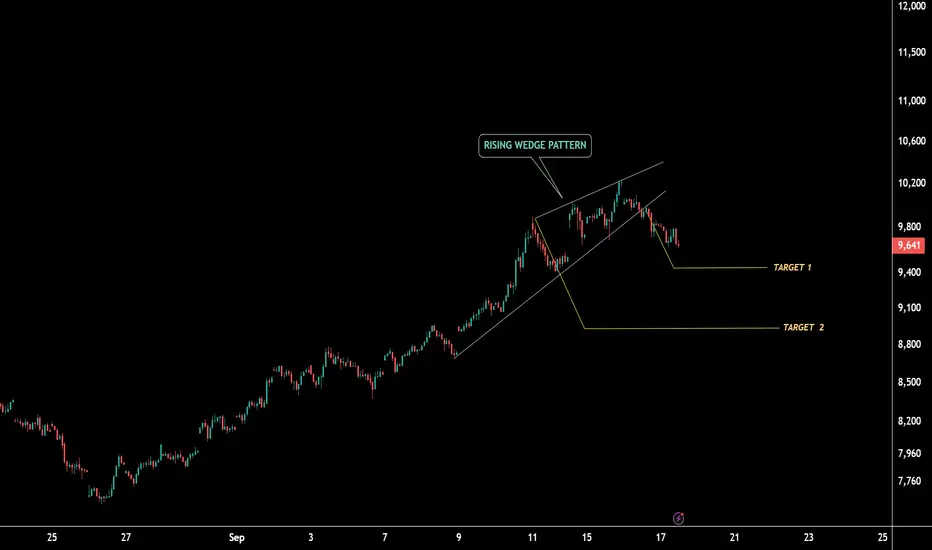
From a classical technical analysis perspective, the S&P 500 appears to be forming a Rising Wedge pattern, which is generally considered a potential reversal pattern.
From an Elliott Wave perspective, it also appears that the S&P 500 has completed Wave C, resulting in a Zigzag corrective(ABC/5-3-5).
Also, we can see negative Regular Divergence(RD-) between consecutive peaks.
Additionally, on the 4-hour timeframe, with about one hour remaining before the candle closes, a Shooting Star pattern appears to be forming, which could be another signal of a potential reversal in the S&P 500 Index.
I expect the S&P 500 to decline, with an initial target of around $7,515. If this key support level is broken, we could see a much deeper correction in the index.
First Target: $7,515
Second Target: $7,476
Stop Loss(SL): $7,626
Note: If the S&P 500 begins to decline with strong bearish momentum, it could have a rapid and direct impact on the cryptocurrency market, especially Bitcoin ( BINANCE:BTCUSDT ).
What do you think? Is the S&P 500 likely to make new all-time highs, or should we expect a broader correction in the U.S. stock market, particularly in the S&P 500?
💡 Please respect each other's opinions and express agreement or disagreement politely.
📌 S&P 500 Index Analyze (SPX500USD), 4-hour time frame.
🛑 Always set a Stop Loss(SL) for every position you open.
✅ This is just my idea; I’d love to see your thoughts too!
🔥 If you find it helpful, please BOOST this post and share it with your friends.
Rising Wedge
British Pound / Swiss Franc ($GBPCHF) Daily: Squeezing InsideBritish Pound / Swiss Franc ( FX:GBPCHF ) Daily: Squeezing Inside a Rising Wedge Pattern – Mapping Key Rejection vs. Breakout Corridors
### 🇬🇧🇨🇭 British Pound / Swiss Franc ( FX:GBPCHF ) Daily Structural Study (Ref: GBPCHF_2026-07-09_09-14-15.png)
We are deploying a tactical chart geometry matrix for the GBPCHF currency cross on the Daily (1D) time matrix. Following a sustained and aggressive bullish rally phase, the pair has transitioned into a highly defined **Rising Wedge** consolidation structure (bounded by the converging black diagonal trendlines).
The cross is flashing intraday balance today, trading down slightly at **1.08172 (-0.06%)**, coiling tightly at the upper dynamic threshold of this compression block.
---
### 🔍 Technical Geometry & Dual Tactical Roadmap:
Rising wedges printed after dominant upside legs typically point to volume exhaustion and immediate buy-side saturation. However, given the broader trend alignment, we remain strictly neutral, mapping out two key execution paths:
#### 🐻 Scenario A: Near-Term Dynamic Rejection (Red Vector)
* **The Setup:** The consecutive upper candle wicks tracking the upper resistance ceiling show localized distribution. A clean lower-timeframe (1H/4H) bearish reversal trigger will confirm an internal corrective rotation.
* **The Target:** This tactical pullback aims to hunt liquidity near the lower ascending trendline support window. If downside momentum accelerates, expect price to gravitate toward the institutional **200-period EMA (purple line at 1.06618)** and the **72-period SMA ribbon (orange line at 1.06243)**.
#### 🐂 Scenario B: Structural Breakout Expansion (Blue Vector)
* **The Setup:** Conversely, if aggregate buying pressure absorbs the overhead supply wall and registers a definitive daily close above the upper black resistance line.
* **The Target:** This breakout invalidates the standard wedge mechanics, turning the pattern into a continuation flag. This breakout will force a heavy short-covering squeeze, catapulting price action toward the major macro horizontal supply ceiling locked at the **1.09480** red baseline.
---
### 🎯 Systematic Execution Rules:
Trading directly inside the apex of a wedge carries adverse risk-to-reward ratios. Our systematic playbook advises waiting for clear boundary confirmations:
1. **For Rejection Plays:** Monitor lower timeframes to capture localized short setups away from the upper trendline, targeting the lower dynamic lines.
2. **For Squeeze Plays:** Await a clean daily breakout and structural retest above the pattern before establishing long exposure towards 1.09480.
---
📊 **ChartPro Data**
*FX Architecture, Price Compression Geometry & Systematic Momentum Models.*
⚠️ **Disclaimer:** For educational and informational purposes only. This active market study represents a personal trading framework and does not constitute financial or investment advice.
AUDUSD Rising Wedge Breakdown — Is a Bigger Drop Coming?AUDUSD ( FX:AUDUSD ) is currently moving near the Potential Reversal Zone(PRZ) and resistance lines, having broken important support lines in recent weeks.
From a classic technical analysis perspective, AUDUSD formed a rising wedge pattern during its pullback to these important support lines, and it has now broken the lower line of this wedge—this could be a sign of further bearish continuation.
From an Elliott Wave perspective, AUDUSD seems to have completed its main wave 4 with a Double Three Correction (WXY).
I expect that, given the bullish trend of the DXY index ( TVC:DXY ), AUDUSD will continue its downward move, potentially dropping at least to the $0.6903 level, and if the downtrend continues, we might see a test of the support zone($0.6884-$0.6865).
First Target: $0.6903
Second Target: Support zone($0.6884-$0.6865)
Stop Loss(SL): $0.6983(Worst)
Note: Today we have an FOMC meeting, which could impact AUDUSD. Be cautious with your positions around that time.
What’s your view on AUDUSD?
💡 Please respect each other's opinions and express agreement or disagreement politely.
📌Australian Dollar/U.S.Dollar Analyze (AUDUSD), 1-hour time frame.
🛑 Always set a Stop Loss(SL) for every position you open.
✅ This is just my idea; I’d love to see your thoughts too!
🔥 If you find it helpful, please BOOST this post and share it with your friends.
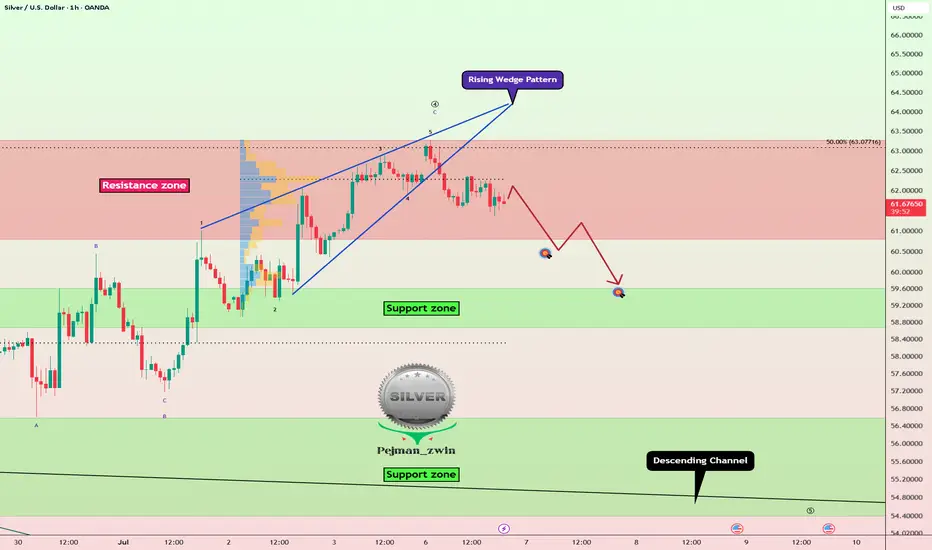
Silver Breaks Rising Wedge — Is a Drop Below $60 Next?Silver ( OANDA:XAGUSD ) is currently trading at the resistance zone($63.27-$60.80).
From a classic technical analysis perspective, it seems that Silver has broken below the lower line of a rising wedge pattern. This break could indicate a reversal from the bullish trend of last week.
From an Elliott Wave perspective, Silver appears to have completed its main wave 4 through a Zigzag correction(ABC/5-3-5).
I expect Silver to continue its downward move in the coming hours, potentially falling at least toward the $59.80–$60 range.
First Target: $60.33
Second Target: $59.74
Stop Loss(SL): $63.42(Worst)
Points may shift as the market evolves
What’s your view on Silver? Will it drop back below $60, or not?
💡 Please respect each other's opinions and express agreement or disagreement politely.
📌 Silver/ U.S. Dollar Analyze (XAGUSD), 1-hour time frame.
🛑 Always set a Stop Loss(SL) for every position you open.
✅ This is just my idea; I’d love to see your thoughts too!
🔥 If you find it helpful, please BOOST this post and share it with your friends.
CHOLAFIN: Resistance Breakout With Strong Participation────────────────────────
📊 STWP BREAKOUT ANALYSIS
Stock: Cholamandalam Investment and Finance Co. Ltd. (CHOLAFIN)
Trend: Bullish
Range High/Low: 1742.80-1344.50
Range Duration: 1 Month 24 Day
Breakout Probability: Strong (84%)
Volume Participation: High| Volume Expansion: 1.34x
Breakout Level: 1803.00
Retest Level/Levels: 1742.80 | 1738.45-1742.80
Invalidation Level/Levels: 1692.40 | 1446.80 | 1342.00
Reference Level/Levels: 1913.60 | 2159.20 | 2264.00
Next Level: Watch Ref Levels
────────────────────────
Disclaimer:
This analysis is strictly for educational and case-study purposes to illustrate chart pattern concepts.
Contact a SEBI-registered research analyst or investment advisor for financial advice.
This content does not constitute investment advice, a trade setup, or any recommendation to buy, sell, or hold securities.
$BSE Ltd: Rising Wedge has massive Bullish projections...BSE Ltd is currently trading in a narrowing range that many technicians identify as a rising wedge.
IMHO there is potential for a breakout which is backed by a massive 174% YoY surge in net profit (₹602 crore) and record-breaking derivatives revenue, which could provide the "fuel" needed to defy traditional technical gravity and push toward a new psychological target of ₹4,000+.
Potential Scenario Catalysts
New Product Launch: SEBI has just approved BSE to launch monthly F&O contracts for the Sensex Next 30 index, which is expected to drive fresh trading volumes.
Institutional Backing: LIC remains a major shareholder (5.58% stake), and MarketsMojo recently upgraded the stock to a "Strong Buy" with a high score of 90.0.
Derivative Dominance: Equity derivatives revenue surged to ₹784 crore in Q3 FY26, highlighting a 11-quarter record-breaking streak.
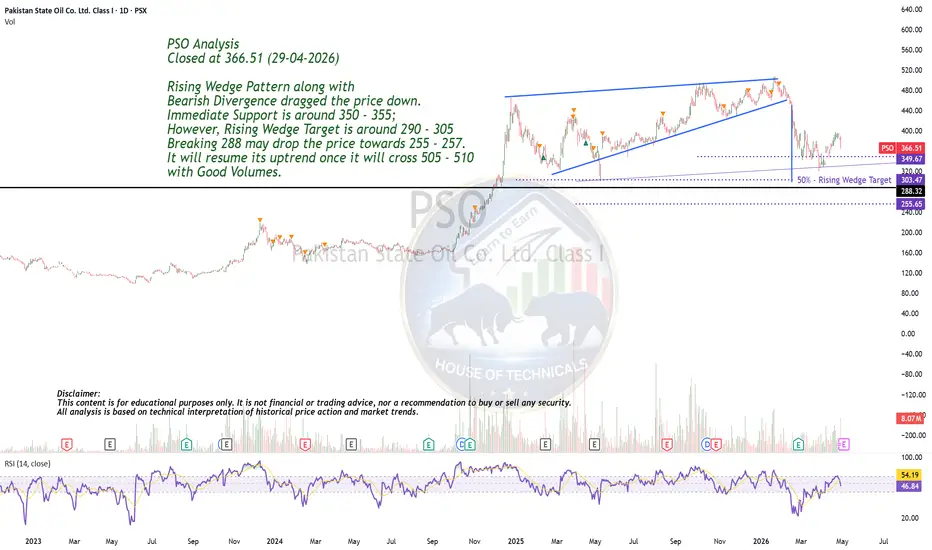
Rising Wedge PatternPSO Analysis
Closed at 366.51 (29-04-2026)
Rising Wedge Pattern along with
Bearish Divergence dragged the price down.
Immediate Support is around 350 - 355;
However, Rising Wedge Target is around 290 - 305
Breaking 288 may drop the price towards 255 - 257.
It will resume its uptrend once it will cross 505 - 510
with Good Volumes.
Bajaj Auto Testing ResistanceDaily Timeframe Analysis of Bajaj Auto
The stock is currently facing a strong resistance zone near 10,800 – 10,900 levels. Price action indicates that sellers are active around this area, making it a crucial zone for the next directional move.
For bearish momentum confirmation, a breakdown below the 10,300 support level could trigger further downside pressure, with the stock potentially correcting towards the 10,040 zone in the coming sessions.
View remains bearish until the resistance zone is decisively breached.
Thank You !!
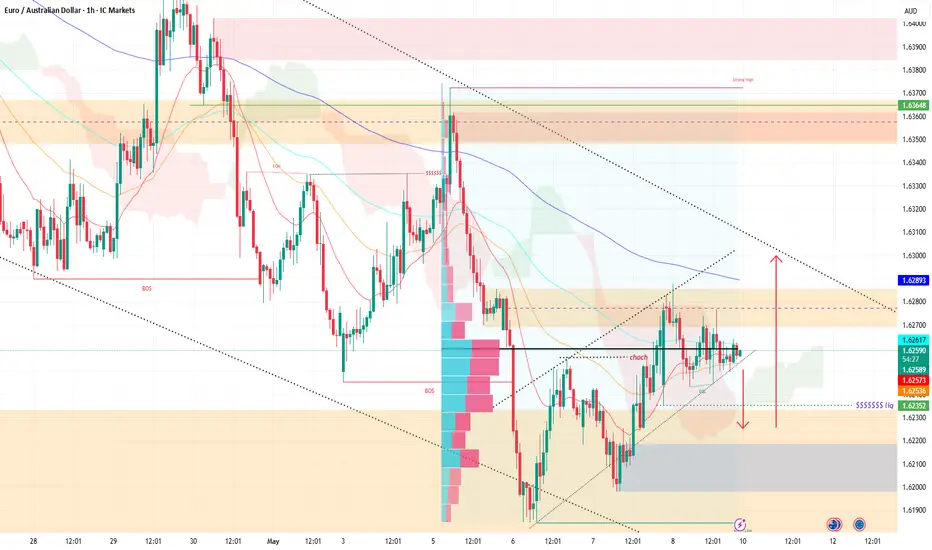
EURAUD H1 | Institutional Level Rejection → Sell After LiquidityBias: Bearish
EURAUD has been in a strong bearish trend, printing consecutive Break of Structure (BOS) levels to the downside. Price has now formed a rising wedge / bear flag on the 1H and is currently sitting at a key institutional level — a zone where large players are expected to step in and sell. A liquidity sweep above the wedge is anticipated before price breaks down and continues lower.
Technical Confluence
Price is currently at an institutional supply level — high probability sell zone
Two confirmed BOS levels to the downside — macro trend is clearly bearish
Rising wedge / corrective channel forming on the 1H — bearish continuation pattern
$$$$$ Liquidity resting above the wedge highs — stop hunt target before sell
$$$$$$ Higher Liquidity pool below at 1.62352 — main bearish target
Strong High overhead acting as resistance ceiling
Dotted descending trendline from macro highs confirming bearish pressure
EMAs above price acting as dynamic resistance
Price making lower highs within the wedge — momentum fading
🔴 Trade Setup — SELL
Current Situation:
Price is right now sitting at an institutional supply zone — this is where smart money has historically stepped in to sell. The rising wedge has brought price back up to this level perfectly, offering a high probability short entry.
🔴 Sell Entry Zone: 1.62800 – 1.63000
Current institutional supply level
Top of rising wedge / resistance
Liquidity sweep zone above swing highs
Strong High / Supply zone overhead
Look for bearish rejection candle before entering
🛑 Stop Loss: 1.63480 – 1.63500
Above the Strong High marked on chart
Above the macro supply zone
Full setup invalidation level
Take Profit 1: 1.62352
$$$$$$ Liquidity pool below
Nearest demand / support level
Partial close recommended here
Take Profit 2: 1.62000
Psychological round number support
Lower demand zone / prior swing low area
Take Profit 3 (Extended): 1.61500 – 1.61000
Continuation of macro bearish trend
Next major liquidity target below
Risk-to-Reward
Entry 1.62900
Stop Loss 1.63480 (-58 pips)
TP1 - 1.62352 (+55 pips)
TP2 - 1.62000 (+90 pips)
TP3 - 1.61500 (+140 pips)
RR to TP1 ≈ 1:1 ✅
RR to TP2 ≈ 1:1.6 ✅✅
RR to TP3 ≈ 1:2.4 ✅✅✅
My Narrative
EURAUD has been in a textbook bearish trend — breaking structure to the downside multiple times and printing lower highs and lower lows on the 1H.
Price is currently sitting at an institutional supply level. This is not a coincidence — the rising wedge has engineered a perfect retracement back into the zone where institutions previously sold aggressively. These levels act as magnets for sell orders from large players — banks, hedge funds, and institutional traders who placed their positions here and are now defending them.
The setup plays out in three stages:
Price sweeps the $$$$$ liquidity above the wedge highs — triggering retail buy stops
Institutional sellers absorb all buying pressure at the supply zone — rejection confirmed
Wedge support breaks — price flushes toward 1.62352 then 1.62000 and below
The BOS levels confirm the trend. The institutional level confirms the entry. The liquidity below confirms the target.
This rising wedge is not a reversal. It is a reloading mechanism for institutions to add to their short positions at a premium price before the next leg down.
The institutional level is active. The sell is expected. Wait for your confirmation candle.
#HYPE Is Building a Massive Move –But first, a Painful Shakeout?
Yello Paradisers! Are you prepared for another classic rising wedge trap in #HYPE that could wipe out impatient traders before the real move even begins?
💎#HYPEUSDT is forming a rising wedge after a prolonged downtrend, and this is where things get interesting. Many traders see bullish continuation, but this structure is more complex and demands precision.
💎This is not just a standard rising wedge. It is a leading diagonal, typically signaling the early stage of a new impulsive structure. This suggests that even if the crypto market remains in a broader downtrend, a long-term reversal could already be quietly developing. It is showing clear relative strength against the broader market. Strong assets tend to lead when conditions shift, and #HYPE is positioning itself as a potential leading horse.
💎From an Elliott Wave perspective, wave 4 appears complete, and wave 5 is now forming. This wave is subdividing into three waves, with waves 1 and 2 already completed. The current move is likely wave 3, which should push the price toward the upper wedge boundary near $50, acting as minor resistance. The RSI indicator is showing divergence, which is an added confluence.
💎The key level to watch is the major resistance at $54. A clean break above this level would invalidate the short-term bearish bias and shift momentum toward bullish continuation.
On the downside, minor support sits at $32, while major support rests at $25 in case of an extended move.
💎Rising wedges often resolve with sharp downside moves. So while the long-term outlook for #HYPE remains bullish, this structure is likely a corrective phase that still offers short-term trading opportunities.
💎The bigger picture remains intact. This leading diagonal signals a developing long-term uptrend, but corrections are necessary. We will reassess after a pullback and look to shift fully bullish for the next major move.
Paradisers, strive for consistency, not quick profits. Treat the market as a businessman, not as a gambler.
MyCryptoParadise
iFeel the success🌴
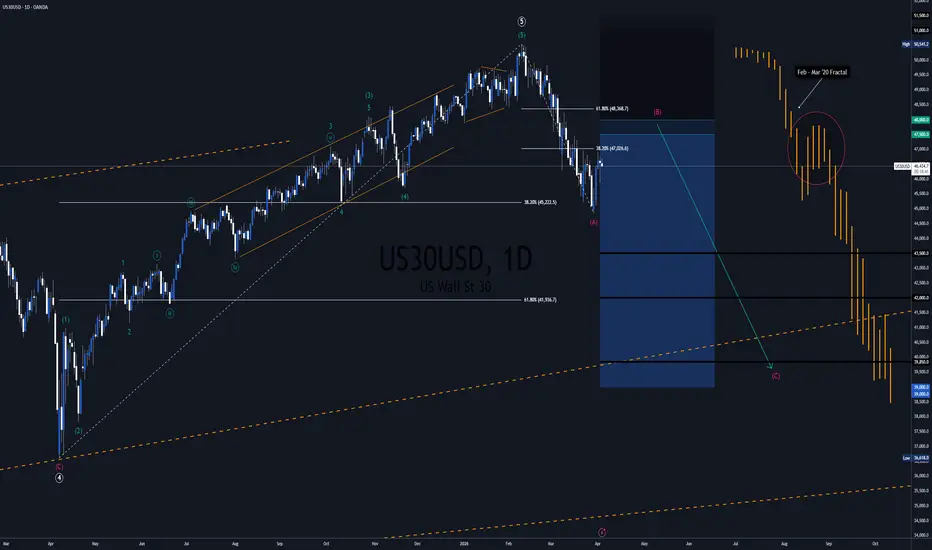
US30 Trade Signal - Bearish ImpulseCAPITALCOM:US30 #TradeSignal - #Bearish Impulse
Summary: OANDA:US30USD #Trade #Signal
- TVC:DJI #Bearish Impulse started.
- #DowJones Sell Positions in focus.
#TechnicalAnalysis: CAPITALCOM:US30 Signal
Chart Structure:
- Primary 5 Top
- #EndingDiagonal
- #Bearish #Divergence
- $USD30USD #Bearish #Fractal
#DowJones Prediction:
- #BearishImpulse
- #ElliottWavce Intermediate (C) Wave
CAPITALCOM:US30 Trade Levels
- Ticker: OANDA:US30USD
- Direction: #SHORT
- Market Entry @ $46450
- Strategic Entry @ $47500 & $48000
- SL @ $51000 & 51500
- TP1 @ $43500
- TP2 @ $42000
- TP3 @ $39850-$39000
* #TradingSignals are subject to risk: DYOR.
Scalping Short Setup | Rising Wedge at 4H ResistanceXAUUSD — Rising Wedge at 4H Resistance | Counter-Trend Scalping Setup
Context (HTF + LTF Alignment)
On the higher timeframe (4H), the market remains structurally bullish with a clear sequence of higher highs and higher lows.
Current price is trading in a premium zone after a strong impulsive leg, approaching a key resistance + liquidity cluster.
This means any short setup is strictly counter-trend and must be treated with reduced risk and strict confirmation.
On the 30M timeframe, price is forming a rising wedge, indicating loss of momentum within the bullish leg.
Structure & Order Flow Read
The move into resistance is a grind rather than a clean impulse, suggesting weakening demand.
Repeated tests near highs without strong continuation indicate possible distribution / liquidity engineering.
High probability of a buy-side liquidity sweep before any meaningful reaction.
Scalping Scenario — Short (Primary, Counter-Trend)
Important Constraint:
This is a counter-trend setup → risk must be reduced, and confirmation is mandatory.
Condition:
Break of the wedge structure to the downside.
Trigger:
30M close below wedge support + lower timeframe MSS.
Confirmation:
Clear displacement + imbalance (FVG) after breakdown.
Entry Model:
Pullback into OTE (0.618–0.786) of the breakdown leg.
Targets:
- First target: 4666 (internal liquidity)
- Second target: 4595 (external liquidity pool)
Invalidation:
Strong acceptance above wedge highs / impulsive breakout of 4H resistance.
Alternative Scenario — Continuation (HTF Trend)
If price breaks the wedge to the upside with strong displacement (not corrective grind),
and holds above the 4H resistance,
then the market confirms continuation in line with HTF bullish structure.
In that case, shorts should be completely avoided.
Key Levels
4H Resistance + Liquidity: Current highs
Trigger Level: Wedge support
Demand Zone: 4709 – 4719
Execution Notes
Do not pre-empt the short — confirmation is critical in counter-trend conditions.
Reduced position sizing is required due to HTF bullish bias.
Best-case scenario: liquidity sweep above highs → failure → breakdown.
If breakout is strong and sustained, bias shifts fully back to bullish continuation.
Conclusion
HTF remains bullish → downside is corrective, not structural.
LTF wedge provides a potential short opportunity only if confirmed.
Focus on reaction, not prediction — this is a tactical scalp, not a swing position.
Solana | Bear Market LeaderAnother outlier similar to $BCHUSD. Price has broken severe lvls of structure on the way down indicating a Year long bear market. This also may indicate that we see BITSTAMP:BTCUSD head for $40k - $30k.
Solana has also formed a similar Bearish Wedge to my last BTC post. If your looking to trade one over the other it seems that SOL would net more since its next support lvl sits at a whopping 45% down ($52 target) but may also see more in that one move.
Remember to keep an eye on the Bearish Elliott Wave that is shown in related posts.
Bitcoin | Continuation DownWe got a solid support zone at ~$52,000 but something tells me we may break through as price action stays consistent on its drawdowns.
1st drawdown from high to low is about 36%
2nd sits around 3% more than the last
3rd drawdown has a possibility of aiming for the same amount
We also have another bearish wedge pattern like the last indicating a continuation down.
Bears are still very strong here and long positions are likely to be liquidated unless if your scalping.
Now if price looks to break below I'm expecting a liquidity grab at the next support lvl (~40.3k).
Stay safe, happy trading :)
Bitcoin Inside a Rising Wedge — Breakout or Breakdown?After the start of the military conflict in the Middle East, Bitcoin( BINANCE:BTCUSDT ) hasn’t performed with strong momentum; instead, it has been trading in a range over these past few days. The question now is whether Bitcoin can make a major move or if it will remain in this price range. So, stay with me.
Right now, Bitcoin is moving in a resistance zone($76,620-$71,700), close to the Cumulative Short Liquidation Leverage($75,650-$74,520).
From a classic technical analysis perspective, it appears that Bitcoin is inside a rising wedge pattern, which is a bearish reversal formation.
From an Elliott Wave theory perspective, it seems that Bitcoin is completing microwave C of the main wave Y within this rising wedge pattern.
I expect that in the coming hours, if conditions align—considering that USDT.D%( CRYPTOCAP:USDT.D )and the S&P 500 index( FX:SPX500 ) are both bullish—Bitcoin could drop again and rise back up at least to $71,100.
Bitcoin’s movements these days are heavily influenced by the Middle East news and the important S&P 500 index. So, it’s better to focus more on short-term moves and, as always, manage your capital carefully.
First Target: $71,100
Second Target: Support zone($70,100-$69,130)
Third Target: $68,437
Stop Loss(SL): $77,133
Points may shift as the market evolves
Cumulative Long Liquidation Leverage: $72,280-$71,490
New CME Gap: $71,845-$71,495
Do you think Bitcoin can reach $80,000, or should we be prepared for another Bitcoin drop? Let me know your thoughts!
💡 Please respect each other's opinions and express agreement or disagreement politely.
📌Bitcoin Analysis (BTCUSDT), 4-hour time frame.
🛑 Always set a Stop Loss(SL) for every position you open.
✅ This is just my idea; I’d love to see your thoughts too!
🔥 If you find it helpful, please BOOST this post and share it with your friends.
Gold Near a Decision Zone — One Pattern Matters MostGold ( OANDA:XAUUSD ) is currently moving in the resistance zone($5,061-$5,020).
In terms of classic technical analysis, it appears that gold has succeeded in forming a Rising Wedge Pattern on the 1-hour timeframe.
In terms of Elliott Wave theory, gold appears to be completing wave C of the Expanding Flat(ABC/3-3-5).
Also, we can see a negative Regular Divergence(RD-) between two consecutive peaks.
I expect gold to drop to at least $4,971 before the markets close. If this does not happen, I suggest you manage and close the position before the markets close, as there is a risk of increased tension in the Middle East over the weekend.
First Target: $4,971
Second Target: $4,926
Stop Loss(SL): $5,073
Points may shift as the market evolves
Note: Also, with the announcement of today's US indices, if the announced values differ significantly from the forecast numbers, we can expect excitement in financial markets dependent on the dollar( TVC:DXY ), including gold.
💡 Please respect each other's opinions and express agreement or disagreement politely.
📌 Gold Analyze (XAUUSD), 1-hour time frame.
🛑 Always set a Stop Loss(SL) for every position you open.
✅ This is just my idea; I’d love to see your thoughts too!
🔥 If you find it helpful, please BOOST this post and share it with your friends.
The Anatomy of a Trap: Why Structure Alone Isn’t EnoughMarkets often look their most convincing right before they become the most deceptive. Clean chart patterns, widely recognized levels, and textbook formations can create a powerful sense of certainty — especially when many traders are seeing the same thing at the same time. Yet, certainty in markets is often where risk quietly concentrates.
The current structure on E-mini Dow Jones futures offers a textbook example of this dynamic. A rising wedge on the daily timeframe, a retracement toward a prior all-time high, and growing bearish conviction all appear neatly aligned. On the surface, the setup looks straightforward. Underneath, however, the market structure tells a more nuanced story — one centered on positioning, order flow, and the risk of traders getting trapped.
This article explores why structure alone is rarely enough, and how technically “correct” ideas can fail when they ignore what sits beneath price.
YM and MYM Futures: Setting the Context
The Dow Jones index futures complex is represented by two primary contracts:
E-mini Dow Jones Futures (YM)
Micro E-mini Dow Jones Futures (MYM)
Both track the same underlying index and reflect the same market structure, with differences primarily in contract size and capital exposure. On the daily timeframe, YM has been trading within a rising wedge — a structure that typically signals slowing upside momentum and an increased risk of a downside resolution.
What makes this moment particularly important is location. The market is not breaking down from a random price zone, but from a region tightly connected to historical reference points and trader memory.
The Rising Wedge: A Structure Everyone Recognizes
Rising wedges are among the most commonly taught chart patterns. They reflect higher highs and higher lows, but with diminishing upside slope — often interpreted as bullish exhaustion.
In this case, price has been retracing within the wedge, drifting toward its lower boundary. From a purely structural standpoint, a break below that lower trendline would appear to confirm the bearish thesis. Many traders anticipate that:
Support failure invites momentum sellers
Stops from late longs are triggered
Short sellers gain directional confirmation
This is where structure becomes compelling — and where risk begins to build.
The Prior All-Time High: A Psychological Fault Line
Just beneath the lower boundary of the rising wedge sits a highly visible reference level: the prior all-time high at 48,528.
Former highs often play a dual role. They act as:
Support for dip buyers expecting continuation
Trigger levels for bearish participation if broken
A decisive trade below such a level tends to shift sentiment quickly. Longs may exit, and short sellers often step in aggressively, expecting downside follow-through. From a traditional technical perspective, this behavior is logical.
But markets are not driven by logic alone — they are driven by positioning.
The Trap: Where Conviction Meets UnFilled Orders
Directly below the wedge and the prior all-time high lies a key element that changes the entire narrative: a notable UFO (UnFilled Order) support zone near 48,004.
UFOs represent areas where significant order flow previously entered the market but was not fully resolved. These zones often act as latent liquidity pockets, capable of absorbing aggressive participation when price revisits them.
Here is where the trap forms.
If price trades below the wedge and below the prior all-time high, it is likely to attract a surge of short sellers acting on:
Pattern breakdown logic
Momentum confirmation
Bearish sentiment reinforcement
However, if that downside move runs directly into unresolved demand from the UFO zone, the market may not continue lower. Instead, selling pressure can be absorbed faster than expected.
At that point, short sellers — confident moments earlier — may find themselves positioned on the wrong side of the market.
Why Structure Alone Isn’t Enough
This is the limitation of standalone technical analysis.
Chart patterns describe shape, not intent. They show where price has been, not how participants are positioned or where liquidity is likely to respond. A structure can break “correctly” and still fail to deliver continuation.
When too many traders act on the same signal at the same location, the market often does the opposite — not out of randomness, but out of mechanics.
In this case:
The rising wedge creates a bearish narrative
The prior high validates that narrative
The UFO support beneath invalidates trader expectations
Understanding this interaction is critical. Structure must always be evaluated alongside order flow context, not independently.
Illustrative Trade Scenario: Understanding Asymmetry
The following is a purely illustrative case study, designed to demonstrate risk logic — not to provide trading instructions.
One hypothetical framework might involve:
Price trading below the wedge and prior all-time high
Short sellers committing aggressively on perceived confirmation
Price interacting with the UFO support zone near 48,004
If selling pressure fails to extend and price stabilizes or reclaims broken structure, short sellers may be forced to cover. That covering process can accelerate upside movement, not because of new bullish conviction, but because trapped positions must be unwound.
In such scenarios:
Risk is defined by invalidation below the support
Reward emerges from forced repositioning
The edge comes from asymmetry, not prediction
The key lesson is not direction, but context.
Risk Management: Traps Cut Both Ways
Traps do not always work. Support and resistance zones based on order flow could fail too, and price can continue lower. This is why risk management remains non-negotiable.
Key principles include:
Predefined risk before engagement
Acceptance of invalidation
Position sizing aligned with volatility
Markets punish certainty. Risk management exists to survive uncertainty.
YM and MYM Contract Specifications
Understanding contract mechanics is essential when applying any analysis.
E-mini Dow Jones Futures (YM)
Contract multiplier: $5 × Dow Jones Index
Minimum tick: 1 index point
Tick value: $5 per contract
Current margin requirement: ~$14,250
Micro E-mini Dow Jones Futures (MYM)
Contract multiplier: $0.50 × Dow Jones Index
Minimum tick: 1 index point
Tick value: $0.50 per contract
Current margin requirement: ~$1,425
Margin requirements vary by broker and market conditions. Micro contracts offer reduced exposure and granularity, while standard contracts provide higher notional exposure. Both reflect identical market structure.
Key Takeaways
This YM case study highlights several enduring market lessons:
Widely recognized structures attract crowded positioning
Breakdowns near major reference levels amplify conviction
UnFilled Orders can absorb participation and reverse expectations
Structure without order flow context is incomplete
Markets don’t move because patterns exist. They move because traders are positioned — and sometimes trapped.
Data Consideration
When charting futures, the data provided could be delayed. Traders working with the ticker symbols discussed in this idea may prefer to use CME Group real-time data plan on TradingView: www.tradingview.com - This consideration is particularly important for shorter-term traders, whereas it may be less critical for those focused on longer-term trading strategies.
General Disclaimer
The trade ideas presented herein are solely for illustrative purposes forming a part of a case study intended to demonstrate key principles in risk management within the context of the specific market scenarios discussed. These ideas are not to be interpreted as investment recommendations or financial advice. They do not endorse or promote any specific trading strategies, financial products, or services. The information provided is based on data believed to be reliable; however, its accuracy or completeness cannot be guaranteed. Trading in financial markets involves risks, including the potential loss of principal. Each individual should conduct their own research and consult with professional financial advisors before making any investment decisions. The author or publisher of this content bears no responsibility for any actions taken based on the information provided or for any resultant financial or other losses.
Play on Levels!PAEL Analysis
Closed at 57.21 (28-01-2026)
Rising Wedge!
Shooting Star on Bigger tf appearing.
Monthly Closing Matters!
One positive point is a Morning Star formation on Monthly basis.
Immediate Support lies around 54.50 - 55.50.
a bounce is expected from this support.
Upside Resistance 64 - 65 can be touched again with mid way
resistance around 59 - 60.
Rising Wedge Pattern S&P 500There is clear a Rising Wedge Pattern formed on S&P 500 4h chart .
There was even a retracement from all-time highs of 6979 back inside the wedge before the weekend.
My suggested SL is 7030-7050 and TP 6500-6550 for the short-to-mid term.
On a larger scale, there is also a huge channel that we are testing the top of right now:
Going all the way back to 2008..
It could easily end up like this:
So for longer term I can see 6100, 5500, 5000 and if recession hits than even 3500.
There has never been such a major Fed hiking and cutting cycle that did not eventually cause a recession. Also, the labor market is weaker than the headline numbers make it seem. Lots of massive downward revisions on NFP. Even the unemployment number is growing slowly, mostly because Labor Force Participation is dropping. If we account for that, then the real unemployment rate is more like 5.5%.
Here are some more examples of rising wedges going back to the pandemic:
GBPCAD Triple Top Points To Potential Triple EventOANDA:GBPCAD on a multi-timeframe analysis allows us to breakdown this False Breakout of the Rising Wedge on the Weekly chart, lets check it out!
Price on the Weekly had made a Bearish Breakout of the Rising Wedge but price has had a great Bullish rally all week and undid all the Price Action following the Breakout of the Rising Support.
On the Daily since the Low of the Breakout @ 1.83238, OANDA:GBPCAD has begun to form an Expanding Range with Higher Highs laying out a Rising Resistance.
- MACD is signaling Bullish with lines just crossing 0 and Histogram forming green bars
Everything is saying Bullish but,
On the 4Hr we can see that Price has formed a Triple Top at the Resistance Level formed from the Highs of Dec. 4th around 1.86328 - 1.86675.
- RSI is showing a Divergence of Highs in Price
- Volume is waning as the Highs form
- MACD is signaling Bearish with a Crossover event and Histogram forming red bars
Now if Price falls below 1.85997, this will confirm the Triple Top and will mean we will be looking for Price to fall down to the AOV around 1.8546 - 1.8528.
If Price is able to find support around this level, this would Confirm the Bullish Bias on OANDA:GBPCAD on the Daily and Weekly.
Why This 2022 Bitcoin Fractal Might Fail The 2022 bear‑market fractal 📉
The fractal taken from the 2022 bear market. Back then Bitcoin built a rising wedge pattern and then dropped about 60% in value from the breakdown.
What “everyone” expects now 😱
Many traders now expect Bitcoin to repeat that same pattern crash.
Social media, bears and even cautious bulls keep pointing to the old wedge and saying “this dump is next.”
Why this time can be different 💡
Markets rarely give the majority the easy trade; when everyone leans to one side, that scenario often gets crowded and fails.
If most traders are positioned for a huge crash, any sustained bid or positive macro surprise can squeeze them and send price higher instead.
My view based on the chart 📊🚀
I consider an alternative path: a choppy but upward trend, driven by forced short covering and new buyers stepping in as the crash fails to appear.
Key takeaway ✅
Yes, the 2022 fractal shows what could happen.
But because almost everyone already sees and trades that same pattern, the higher probability play now is that Bitcoin does not repeat the exact 60% wipeout and instead grinds higher while late bears get trapped.
Price-Action Analysis (Gold – Daily Chart)Price-Action Analysis (Gold – Daily Chart)
1. Rising Wedge Structure
The chart highlights a rising wedge, where price is moving higher but the slope of the highs and lows is converging.
This shows that although price is advancing, the momentum is slowing because each new high is made with decreasing strength.
The wedge boundaries show price repeatedly touching both the upper and lower trendlines.
2. Recent Price Behavior
Price moved from the lower wedge boundary upward and recently touched the resistance area near the upper boundary.
After this touch, the latest candle shows a pullback, indicating a pause in upward momentum.
This is consistent with price meeting the top of a tightening structure.
3. Interaction With EMAs
Price has been trading above the EMA 7, EMA 9, and EMA 21, reflecting short-term upward pressure.
The EMA 50 lies further below and has acted as a secondary dynamic support in earlier phases of the chart.
The clustering of EMAs under price indicates a generally constructive short-term trend.
4. Possible Breakdown Area (Structure-Based)
The dotted vertical measurement displayed on the chart illustrates the height of the wedge.
This height is often used to project a distance, not as a signal, but simply to visualize how the pattern size compares with nearby price areas.
The green “Target” box reflects this projected measurement placed below the wedge’s lower boundary, representing a hypothetical zone based solely on the wedge’s size.
5. Volume Context
Volume appears higher during strong downward candles earlier in the chart, then stabilizes during the wedge.
This fits a common observation where momentum can slow as patterns tighten.
📌 Summary (Neutral & Descriptive)
Gold has been moving inside a rising wedge, showing higher highs and higher lows within a narrowing structure. Recently, price touched the upper boundary of the wedge and showed a mild pullback, indicating reduced momentum at that level. Price remains above several EMAs, reflecting ongoing short-term strength, while the pattern itself shows compression. A measured-move projection is drawn underneath the wedge to illustrate how its height compares with lower price zones if the structure were to resolve downward.