EUR-CHF Supply Level Ahead! Sell!
Hello,Traders!
EURCHF is approaching the underside of the horizontal supply area, where a mitigation retest and liquidity grab could reinforce strong bearish order flow toward the marked target level.Time Frame 3H.
Sell!
Comment and subscribe to help us grow!
Check out other forecasts below too!
Supply and Demand
EUR-USD Local Short! Sell!
Hello,Traders!
EURUSD is failing beneath the horizontal supply area after repeated liquidity grabs, with bearish distribution and weakening momentum favoring a pullback toward the marked target level.Time Frame 2H.
Sell!
Comment and subscribe to help us grow!
Check out other forecasts below too!
EURUSD FREE SIGNAL|SHORT|
✅EURUSD is rejecting beneath the bearish mitigation block after a buy-side liquidity raid, with weakening order flow and displacement supporting continuation toward the sell-side target.
—————————
Entry: 1.1265
Stop Loss: 1.1286
Take Profit: 1.1238
Time Frame: 2H
—————————
SHORT🔥
✅Like and subscribe to never miss a new idea!✅
HOOD - LTF/HTF Alignment TradeThis is what we look for - A clear HTF bias, coupled with a LTF liquidity level that, if taken, will offer us an excellent R:R trade.
More specifically here, I am looking for the LTF sell-side liquidity to be taken and a quick/high volume reclaim - proving both intention of buyers and failure of sellers.
Without that move, we can still take a trade - however we will be missing 2 key parts to a good trade entry:
1. Much less confirmation. Liquidity still sitting below a clear level (even if L
ATOMUSDT Weekly Supply Holds, Continuation Lower Still FavoredATOMUSDT remains structurally bearish after a prolonged distribution phase, with repeated rejections from major weekly supply zones at the $13–$17 and $40 regions confirming long-term seller dominance. Price has broken down from a compression structure near the $4.0–$3.5 immediate supply, accelerating into a new leg lower.
As long as ATOM trades below this flipped resistance, downside continuation toward the weekly demand at $1.30–$1.05 remains the primary scenario.
Any recovery from the lo
EURCAD EURCAD 1H
1H we can see theres some trapped buyers . why ? how ?
Listen up ...
If we get a small buy candle ( green candle ) then an aggressive red candle ( impulsive sellers ) , thats a supply zone , we want price come back and retest at some point just like we can see now.
took my sell position and price and reacted lovely.
Enjoy - any questions give me a message ...
JKFX
XAUUSD XAUUSD - 1H timeframe
so we can see 1H is currently bullish.
Price gave us a bullish impulsive candle, candle before was bearish ( trapped buyers ) we wanted price to push away and come back and retest which in this case it did.
Entered with bullish momentum , stops just below and targeting the next 4H area.
Enjoy any questions about how i trade give me a message .
JKFX
GBPUSDGBPUSD 4H
4H gave us a lovely demand zone and let me explain why and how .
So we look for impulsive candles , the candle before just has to buy the opposite colour in this case red (trapped seller) .
so we have dropped sellers, impulsive buying candle , waiting for retest , enter.
I keep it as simple as that ..
Enjoy, any questions give me a message.
JKFX
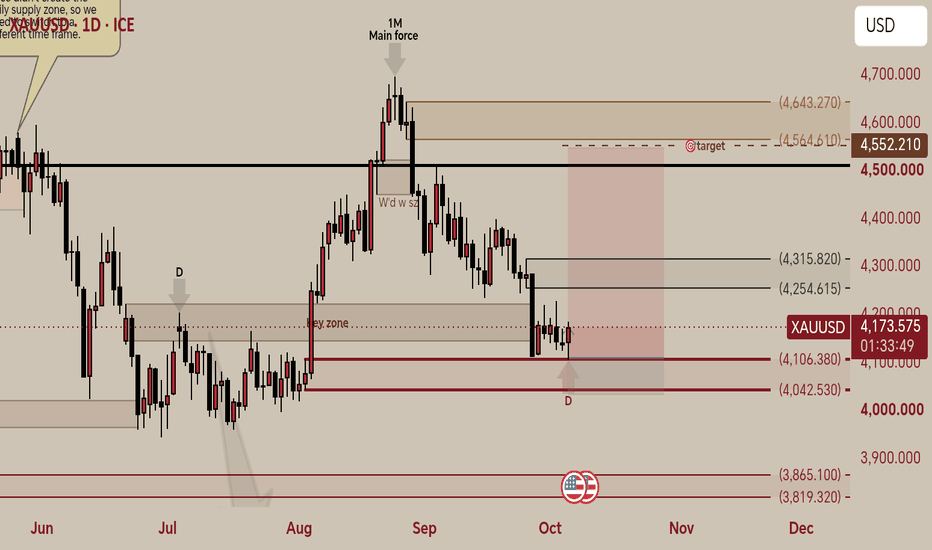
Gold XAUUSD Market Structure, Order Blocks & Liquidity AnalysisThis analysis focuses on the current market structure of Gold (XAUUSD), with emphasis on market structure, liquidity, order blocks, trend-line interaction, and key reaction zones.
Price has been moving within a broader bearish structure, with a sequence of lower highs and lower lows visible across the chart. However, after the strong bearish displacement, price has entered a consolidation/ranging phase near the 4,120–4,200 area. This range is currently an important area to monitor for a potenti
GBPUSD: Key 5th Support Test & Fibonacci Confluence TargetExecutive Summary
GBPUSD has returned to a major historical support zone (~1.31780). Over previous market cycles, this exact demand area has triggered strong, repeatable bullish reactions averaging a gain of +4.5% (~500 to 600 pips). Price action is once again exhibiting absorption at this level, opening a high-probability long setup targeting upper Fibonacci retracement confluence levels.
Key Technical Confluences
1. Historical Support Retest (5th Bounce):
- As annotated on the chart
AXTI - Long term looks very promising23-09-2026
CMP 77.79
Weekly oulook is looking very good
RSI crossing above 50 & signal Line
MACD showing sellers exhaustion
Stochastic also positive
On Daily TF breaking Bollonger band sqeeze (Upper band)
First initial strong resistance at 88.4
Gap up on weekly near 69.8 should be support as well as current Stoploss
1st Target 84.8
2nd Target 86
3rd Target 88.8
Once break & sustain 96 then longterm can achieve 110 then 133 levels again
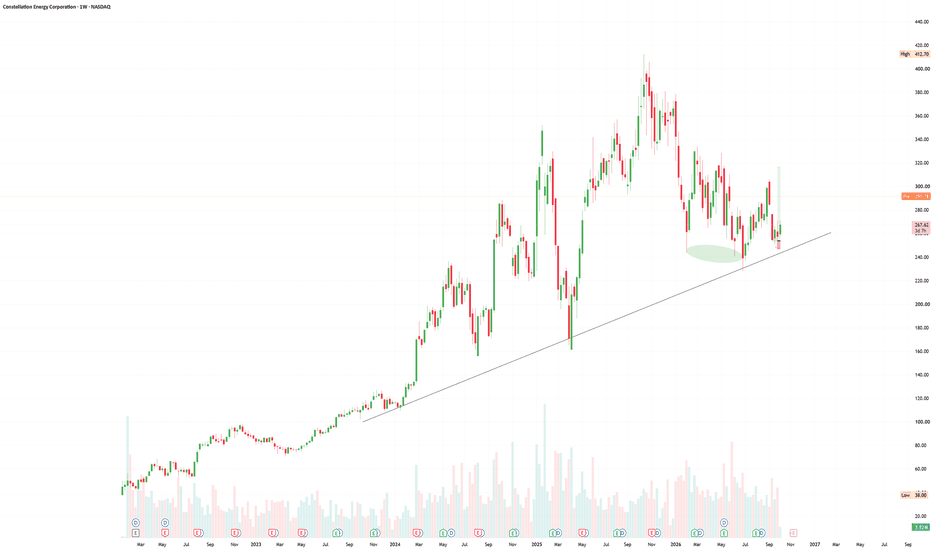
CEG - My perfect setup... and I missed it!Here's my 1-2-3 setup that's very simple to identify and very effective when executed with patience and the right confirmation!
Unfortunate to miss opportunities like this just because I hadn't looked at the chart in a few weeks.
But happy to see the setup thriving!
Happy Trading :)
BTC: 314 BTC offered at 87000 vs 88 bid at 84500The book is lopsided. There is 314 BTC resting on the offer at 87000 and only 88 BTC bid at 84500, so the size that would have to be absorbed on the way up is about 3.6 times what sits underneath.
THE BOOK RIGHT NOW
314 BTC of asks at 87000
151 BTC of asks at 87700
spot 86097
88 BTC of bids at 84500
79 BTC of bids at 85500
within 1% of mid the book is 50% bid
CONTEXT
Volume POC at 85562, value area 85425 to 86350
CVD over 4h is -148 BTC
Open interest -0.40% on the hour with p
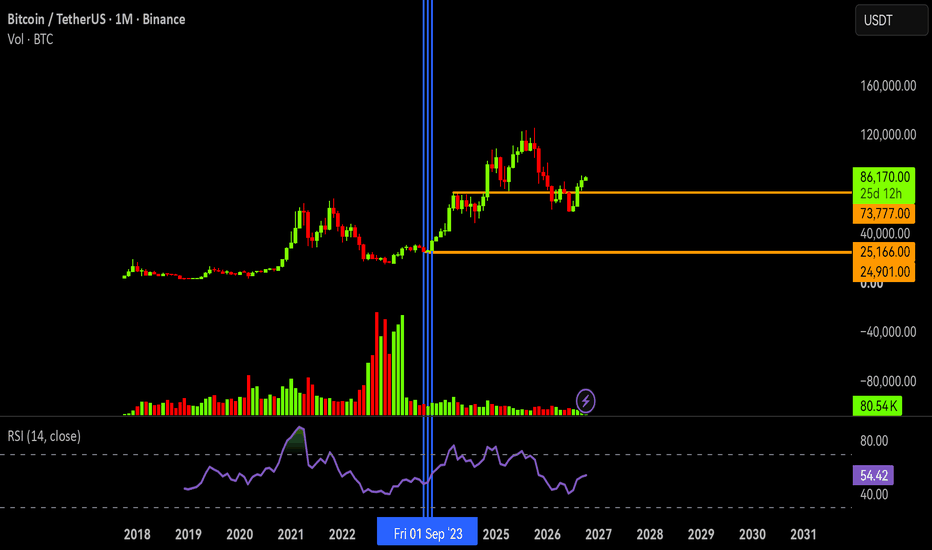
Btcusd monthly chart The broader market structure continues to point to a long-term bullish trend for Bitcoin.
A retest of the $126K area remains highly probable, with the potential for BTC to break above that level and establish new all-time highs.
From a long-term perspective, I favor holding and strategically adding on meaningful pullbacks.
The setup remains bullish. The next major expansion could be closer than many expect. 🚀📈
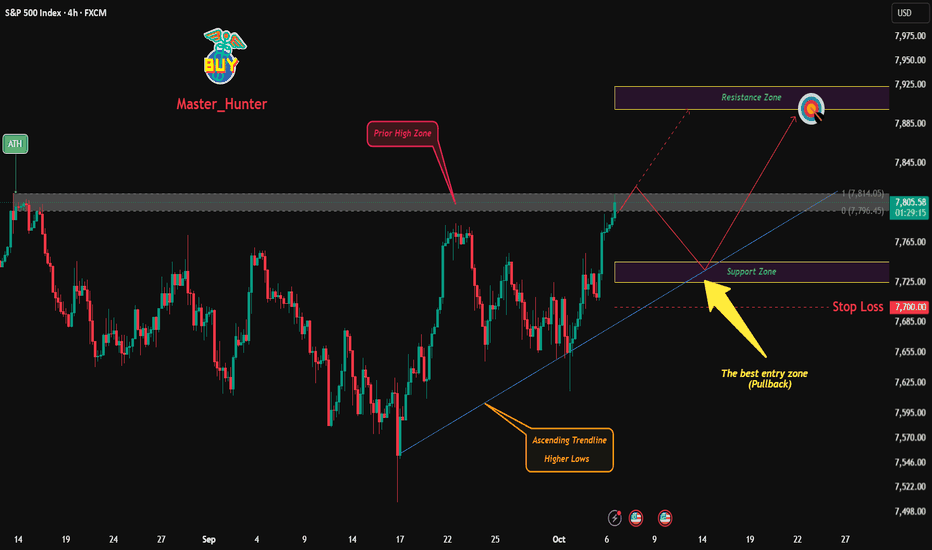
SPX500 Breakout Retest — Push to 7,900?Hook:
FX:SPX500 has broken above the previous 7,796–7,814 resistance area while respecting its rising trendline — now the key question is whether a pullback into 7,725–7,745 can turn the breakout into a continuation toward 7,900. 🔥
Market Context:
SPX500 is trading on the 4H chart with a clear sequence of higher lows, supported by an ascending trendline that has been guiding the recovery.
Price has now pushed through the previous reaction area around 7,796–7,814, shifting the short-term