EURNZD RISKY FREE SIGNAL|LONG|
✅EURNZD is testing a demand level after extended selling, where buyers could absorb sell orders and initiate bullish displacement toward 1.9969 if order flow shifts upward from the lows.
—————————
Entry: 1.9951
Stop Loss: 1.9939
Take Profit: 1.9968
Time Frame: 4H
—————————
LONG🚀
✅Like and subscribe to never miss a new idea!✅
Support and Resistance
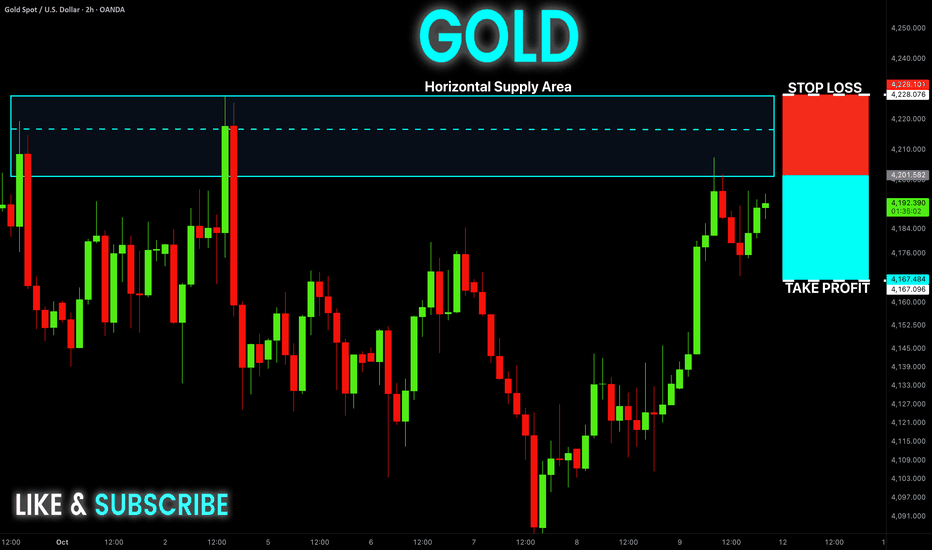
GOLD Free Signal! Sell!
Hello,Traders!
XAUUSD is rebounding toward the horizontal supply area after a recent rejection, where fresh selling could cap the recovery and trigger a bearish correction toward the target.
------------------
Stop Loss: 4228.08$
Take Profit: 4167.10$
Entry: 4201.58$
Time Frame: 2H
------------------
Sell!
Comment and subscribe to help us grow!
Check out other forecasts below too!
XAUUSD · H1 · Friday Review & Weekly Scorecard · 9 OctFRIDAY
Overnight, the squeeze broke higher. Buyers held the pivot and took price through R1. After the retest, one hourly run went through R2 and R3, then on to the 4205 zone, where sellers turned it back. In the US session, price came back to R3, it held as support, and buyers took it up to 4196. No play for us today. The best setup, the R1 retest, came overnight while we were asleep.
Where we are now
Price is at 4189, between R3 at 4170 and the 4205 zone.
A clear hourly close above the 4205 z
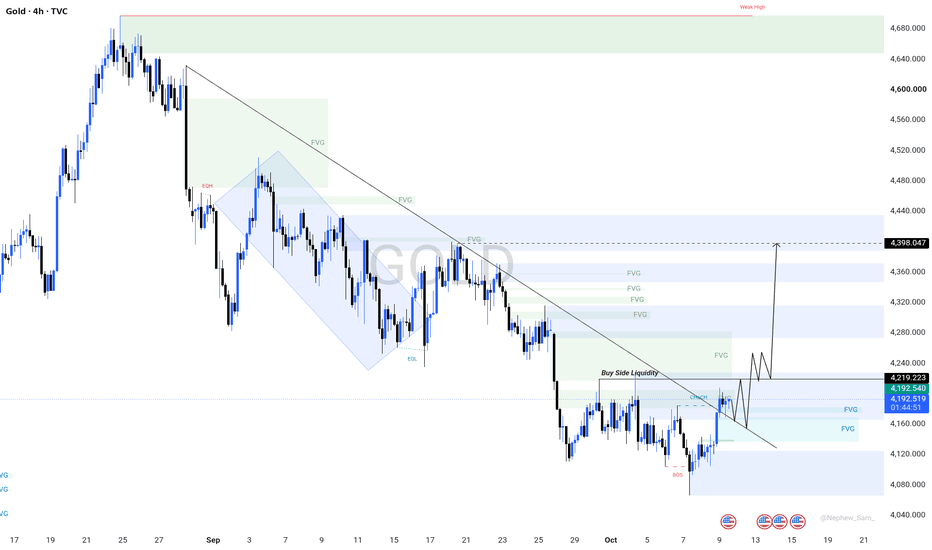
GOLD 4H: A Potential Trendline Breakout Toward Higher Liquidity.
XAUUSD is approaching a technically significant area after an extended bearish move on the 4-hour timeframe. Recent price action suggests that buyers are attempting to regain short-term momentum, with price moving toward the descending trendline and the nearby buy-side liquidity zone around 4,219.
The market is now at an important point where confirmation will be more valuable than anticipation. A decisive breakout above the trendline, supported by strong bullish price action, could signal a p
NZD-JPY Will Fall! Sell!
Hello,Traders!
NZDJPY is awaiting another retest of the horizontal supply area near 88.90, where renewed selling could revive bearish momentum and send the next corrective leg toward the 88.66 target. Time Frame 3H.
Sell!
Comment and subscribe to help us grow!
Check out other forecasts below too!
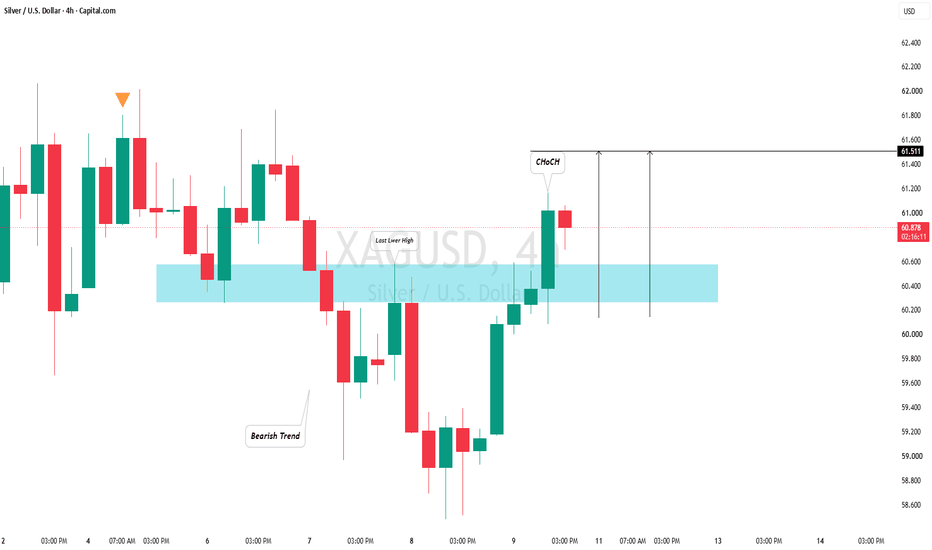
SILVER (XAG/USD): Confirmed Change of CharacterI see a confirmed change of character on 📈SILVER on the 4hour timeframe.
Despite trading within a global bearish trend, the market has successfully violated a bearish trend and broke above a significant horizontal resistance level.
It is highly probable that the market will continue to rise.
The next level of resistance is projected at 61.5.
USD-CHF Will Go Down! Sell!
Hello,Traders!
USDCHF is holding below a horizontal supply area, where a retest could invite renewed selling before bearish continuation toward 0.8296, with lower liquidity drawing the next move down. Time Frame 3H.
Sell!
Comment and subscribe to help us grow!
Check out other forecasts below too!
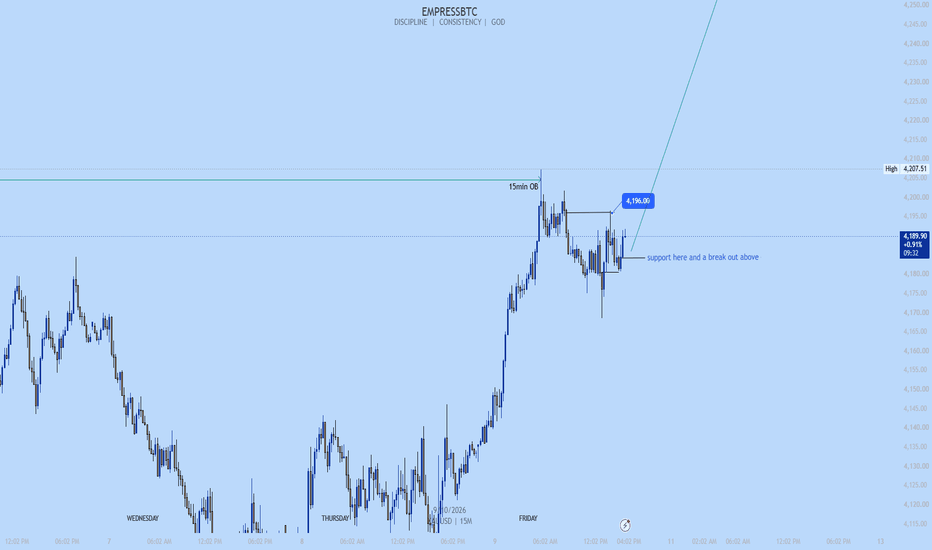
GOLD is About having a massive breakout!Currently gold is ranging around the 15min FVG and 15MIn 4180 OB.
I am expecting a breakout soon but that can only be very much solid if gold respects that OB before we can see that happening...
If not, we did be seeing a bit of retracement into 2hrs FVG and then finally another leg up above 4220
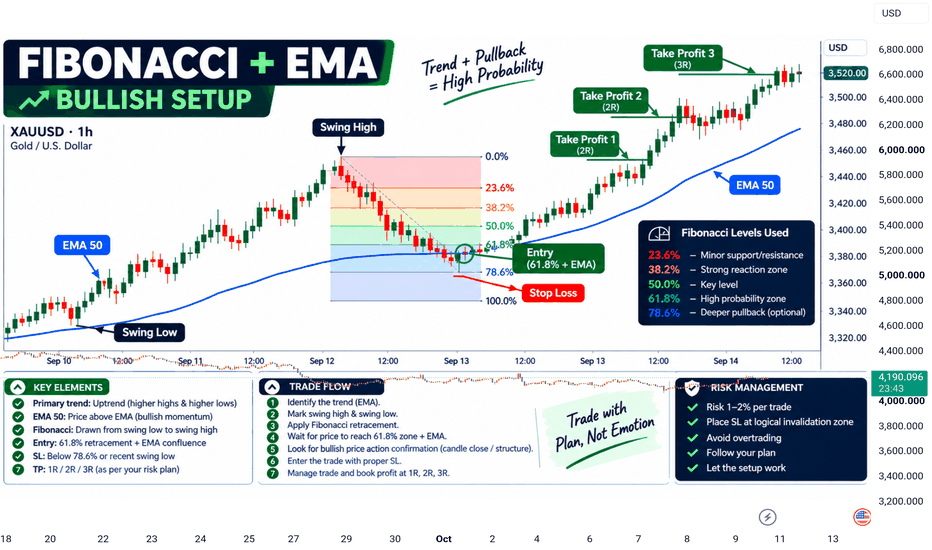
FIBONACCI + EMA — PROFESSIONAL TRADING EDUCATION.
Fibonacci Retracement and Exponential Moving Averages (EMA) are two powerful technical-analysis tools that can be combined to build a structured and disciplined trading approach. Neither indicator predicts the market with certainty; instead, they help traders understand trend direction, potential reaction zones, momentum, and trade location.
1. Understanding Fibonacci Retracement
Fibonacci Retracement is mainly used to identify potential areas where price may retrace before continuing in the d
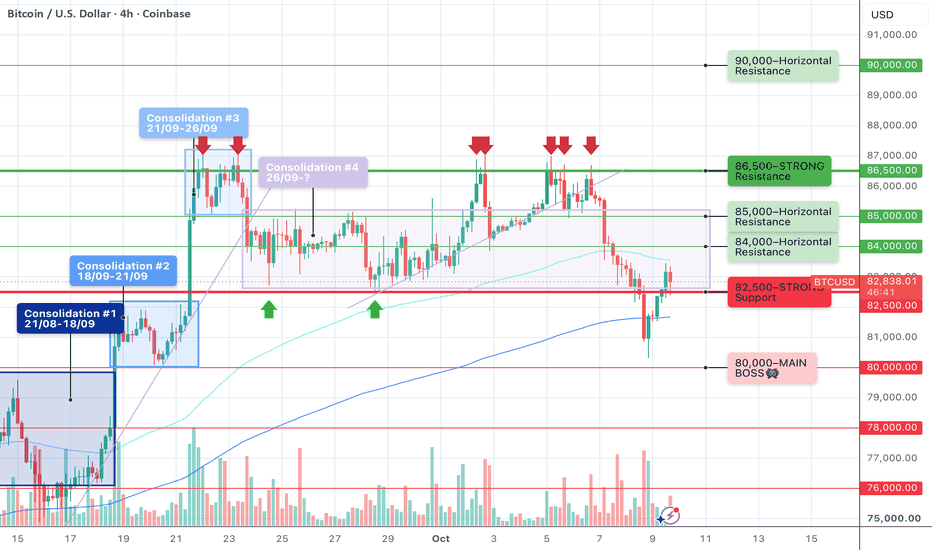
BTC: The $80K Level Is Still the Boss!Hey everyone!☀️
Wednesday and Thursday were tough days for the bulls this week 🔪🔪🔪
While the pullback toward $82.5K didn’t really damage the bullish structure, a break below $82.5K was enough to make everyone nervous.
Personally, I expected a reversal right around $82.5K level, as I mentioned in my last post. But if there’s one thing I’ve been emphasizing in my last post and the five before that, it’s the critical importance of $82.5K.
This was the last line of defense before the main boss:
BTC: 716 BTC offered at 84000 vs 258 bid at 81535There is 716 BTC resting on the offer at 84000 and only 258 BTC bid at 81535, so the size that would have to be absorbed on the way up is about 2.8 times what sits underneath.
THE BOOK RIGHT NOW
716 BTC of asks at 84000
223 BTC of asks at 84200
spot 82863
258 BTC of bids at 81535
174 BTC of bids at 81400
within 1% of mid the book is 50% bid
CONTEXT
Volume POC at 82488, value area 80950 to 82725
CVD over 4h is +2151 BTC
Open interest -0.17% on the hour with price +0.05% - read
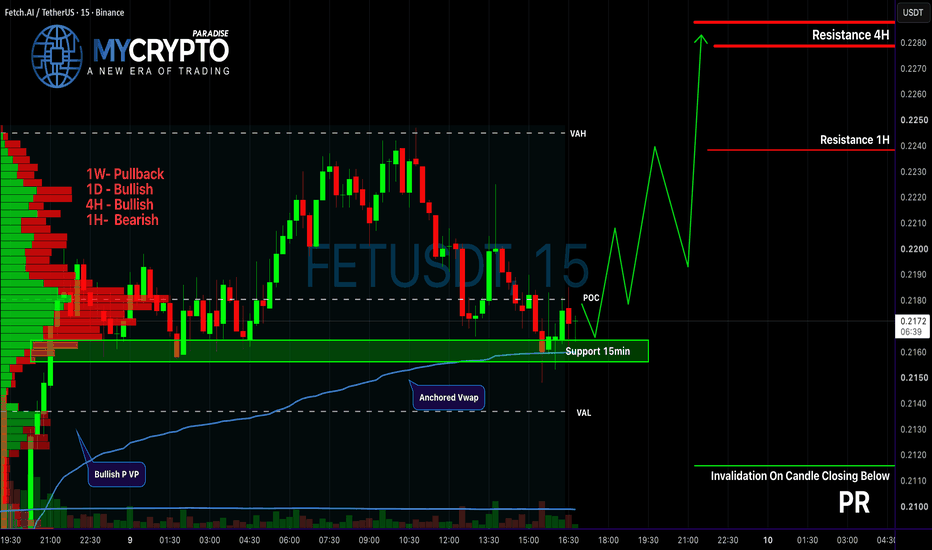
FETUSDT: Bulls Ready to Explode?Yello, Paradisers! Are you ready for FET's next explosive move, or will the market shake out impatient traders before the real rally begins? #FETUSDT is currently approaching a crucial decision point, and the technical structure suggests that a significant bullish recovery could be developing. However, several important price levels must be respected before we can expect a stronger upward expansion.
💎#FETUSDT is currently trading around $0.2178, slightly above a critical 15-minute support zone
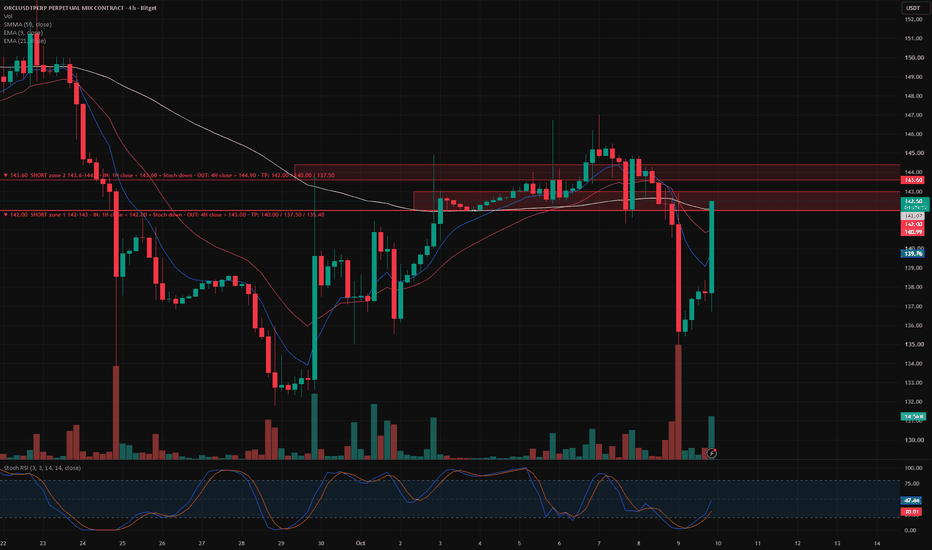
ORCL: the OpenAI number isn't the problem. 142-144 is the tradeOracle lost 5.5% on Thursday and bounced almost 5% on Friday. Both moves came from the same headline, and neither changed the chart.
Why now
Thursday's trigger was a report that OpenAI's annualised revenue sits near USD 50B, not the USD 68-70B that had been circulating. Most of that gap is a definition change, partner revenue counted gross versus net, and OpenAI's own sales are still growing around 77% a year. The numbers that should worry Oracle holders are older: capital spending of USD 28.5B
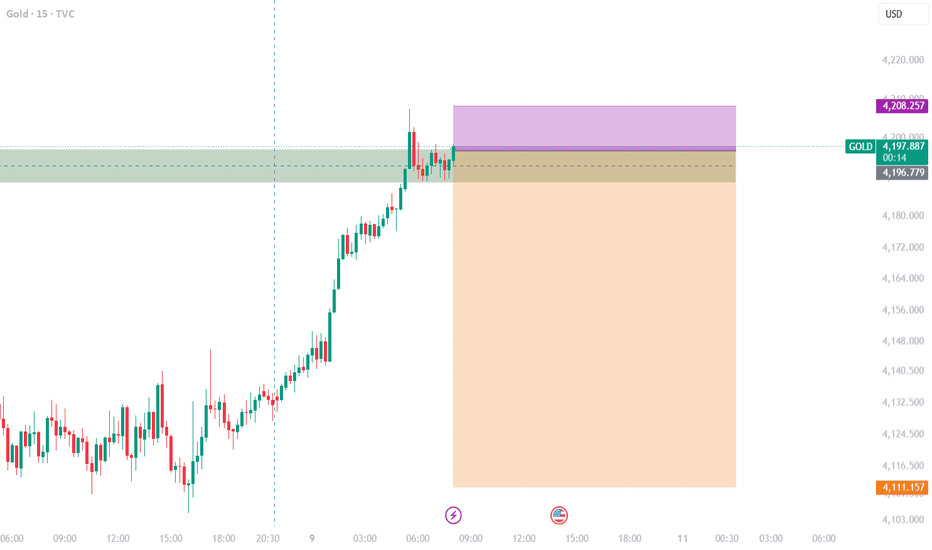
XAU/USD 15m Short Setup: Liquidity Sweep & Resistance RejectionOn the Gold (XAU/USD) 15-minute chart, a potential short setup is forming following a liquidity sweep into key resistance:Liquidity Sweep: Price expanded aggressively upward to sweep liquidity above recent highs, reaching a peak near $4,208.26 before facing strong seller pressure. Market Structure & Consolidation: After the rejection, price is consolidating near the lower boundary of the supply zone, indicating a loss of bullish momentum and a potential trend reversal back down. Trade Parame
DNEX: Catching the Breath Before Wave 5?Quick 4H structure read on DNEX
Strong push up through Waves (1) and (3), now pausing in Wave (4), normal after two strong legs. A clean Wave (4) means clear risk, so the stop loss can sit tight below this structure. By wave equality, Wave (5) may move up to match the length of Wave (3), and this count stays valid as long as price holds above the Wave (1) high and if price closes below that, the count is dead.
Not financial advice, just my read of the chart.
MESZ Oct 9: 7849 Breakout or Pullback Toward 7823?MESZ is trading around 7,840, with the higher-time-frame structure still relatively neutral.
On the upside, 7,849 is the key confirmation level. A confirmed 4-hour close above that area could support continuation toward 7,867.
On the lower time frame, price swept liquidity around 7,853 and then lost the short-term structure near 7,839.
That makes 7,823 an important downside target if sellers continue to hold price below 7,839.
The key higher-time-frame downside level remains 7,798. A confirmed b
XAUUSD · H1 · New York Brief · Friday 9 OctoberResistance above
4228
4204
Support below
4170 (R3, now support)
4154 (R2, now support)
4144 (R1, now support)
We skipped the London update today. By the time London opened, there was nothing left to map. Price had already gone through every level above the pivot. So we are going straight into the New York session.
What happened
Last night we said we were in a squeeze, and that a squeeze usually ends with a breakout. It did, and it broke higher. Price broke R1, then one run took it straight th
Nifty levels - Oct 12, 2026Nifty support and resistance levels are valuable tools for making informed trading decisions, specifically when combined with the analysis of 5-minute timeframe candlesticks and VWAP. By closely monitoring these levels and observing the price movements within this timeframe, traders can enhance the accuracy of their entry and exit points. It is important to bear in mind that support and resistance levels are not fixed, and they can change over time as market conditions evolve.
The dashed lines
BankNifty levels - Oct 12, 2026Utilizing the support and resistance levels of BankNifty, along with the 5-minute timeframe candlesticks and VWAP, can enhance the precision of trade entries and exits on or near these levels. It is crucial to recognize that these levels are not static, and they undergo alterations as market dynamics evolve.
The dashed lines on the chart indicate the reaction levels, serving as additional points of significance. Furthermore, take note of the response at the levels of the High, Low, and Close va
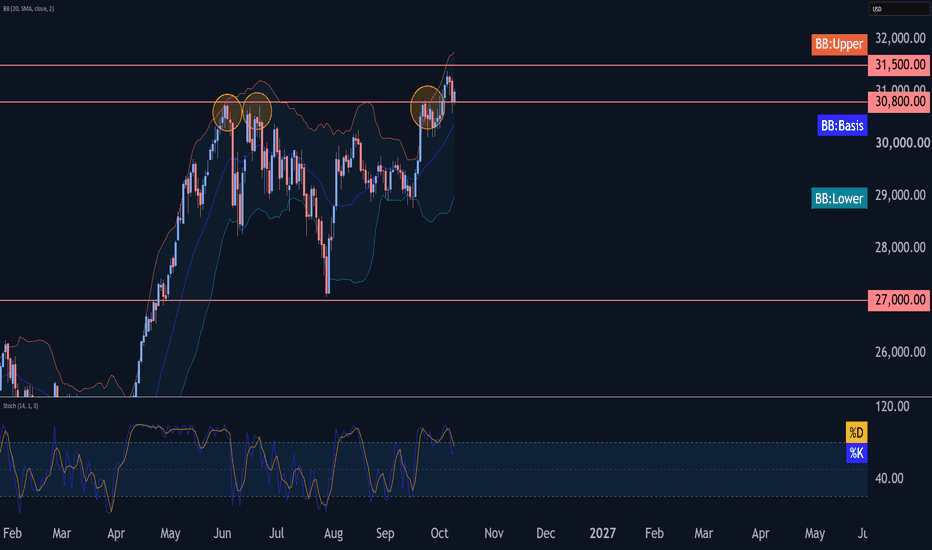
Nasdaq-100 Index Wave Analysis – 9 October 2026– Nasdaq-100 Index reversed from support level 30800.00
– Likely to rise to resistance level 31500.00
Nasdaq-100 Index recently reversed up from the support level 30800.00 – former strong resistance, which stopped wave (1) at the start of June, wave B in the middle of June and also wave i in September.
The upward reversal from the support level continueS the active short-term impulse wave iii of the impulse wave 3 from the middle of September.
Given the clear daily uptrend, Nasdaq-100 Index c
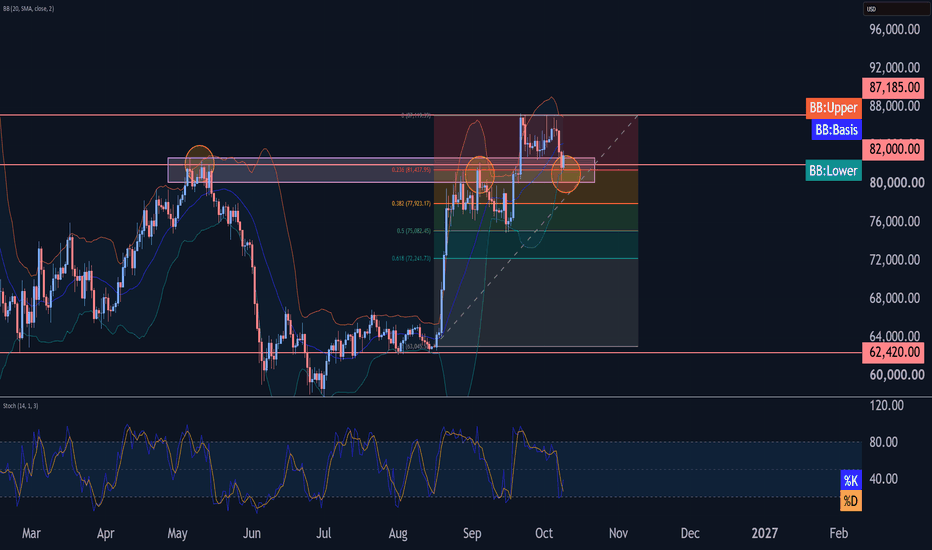
Bitcoin Wave Analysis – 9 October 2026– Bitcoin reversed from key support level 82000.00
– Likely to rise to resistance level 87185.00
Bitcoin cryptocurrency recently reversed up from the support zone between the pivotal support level 82000.00 (former resistance from May and the start of September) and the 50% Fibonacci correction of the upward impulse (5) from the middle of September.
The upward reversal from this support zone completed the wave (C) of the primary ABC correction 4 from the middle of September.
Given the strength
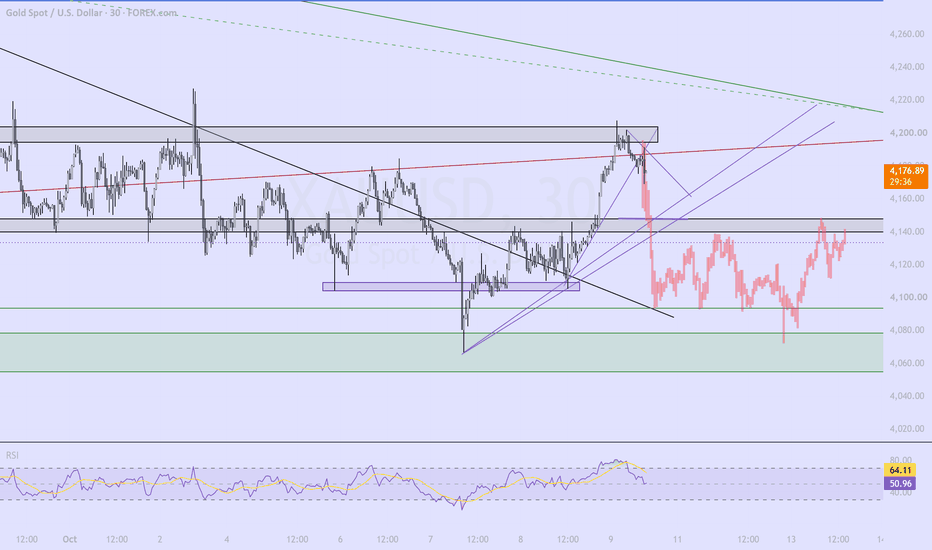
Short GoldPrice respected the red daily trendline as resistance where it is pushing aggressively away. Expect price to break the purple zone at 4110 which marks the last level of support on the prior buy structure.
I have a bars pattern for a future of how the retrace will look but that's next weeks opportunity.
TP 1: grey zone 4148
TP 2: purple zone 4110