Support and Resistance
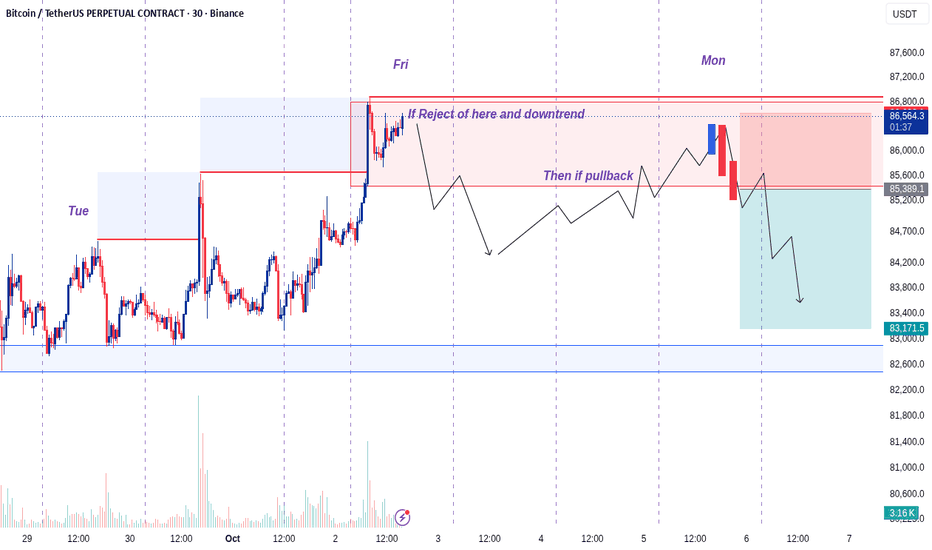
BTC will probably be shortable next weekBased on my strategy, if BTC moves down from the zone I've marked and reaches a level where it previously started an upward move, then pulls back from there to the zone shown in the image, makes several attempts to break through it, and finally tries to break it with a large candle but fails and drops back down, that's when I can enter a short on the quick reversal, with my stop loss placed above the last high.
This is not financial advice, and this is not a recommendation to buy or sell. Pleas
ServiceNow Challenges ResistanceServiceNow rallied in August and paused in September. Now some traders may think it will continue higher.
The first pattern on today’s chart is the series of lower highs since late August. Could the software company break that falling trendline?
Second, the 50-day simple moving average (SMA) recently had a “golden cross” above its 200-day SMA. That may reflect a more bullish long-term trend.
Third, the long basing pattern between February and June could also reflect bottoming has occurred.
F
XAUUSD-GOLD | (15M) | Tracking the Whales | Prof.TraderTilkiGuys, greetings,
Yesterday I felt a bit sick, still not fully recovered, but I wanted to share an update with you.
I couldn’t go to the office, so I opened my laptop at home and set this week’s key levels for gold: 4148 – 4132.
If gold stays above 4148, I expect a rise towards 4230.
If it falls below 4132, we could see a drop down to 4070.
Today gold went below 4125, cleared the stop zones, and then started to rise.
Remember: above 4148 I’ll look for buys, below 4132 I’ll look for
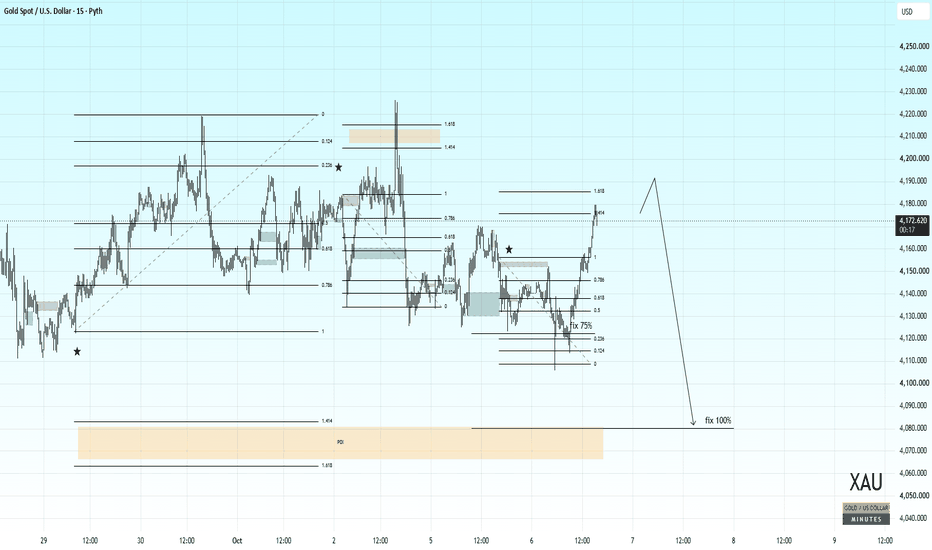
XAUUSD · M15 — Rebalancing Before a Potential Move Lower
Following the rebound from local lows, price has reached the external Fibonacci extension of 1.414–1.618 around 4175–4185. I view this recovery as a correction within the broader downward move.
My main scenario is a completion of the rebalance in this area, with a possible push toward 4190, followed by renewed selling toward the lower POI.
Profit-taking levels:
• Around 4122 — close 75% of the position.
• Around 4080 — close the remaining position near the upper boundary of the lower POI.
T
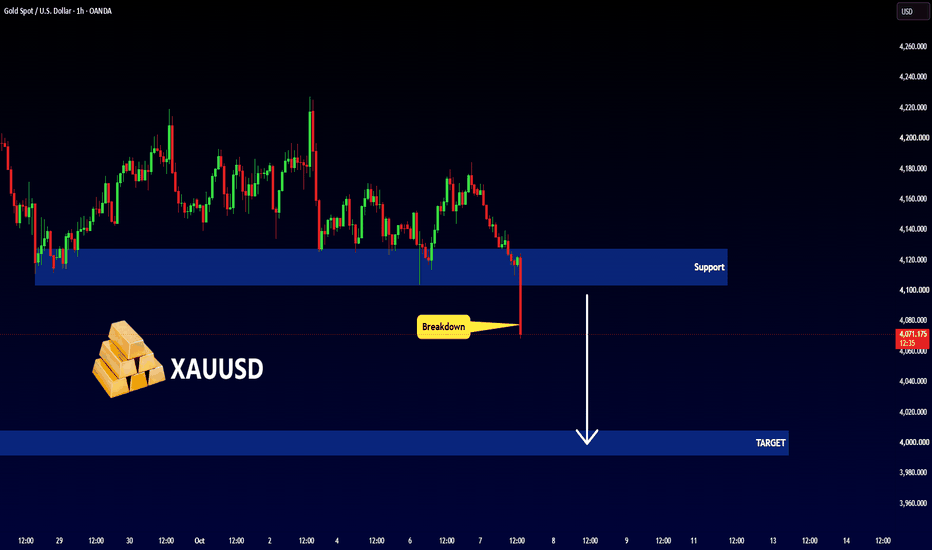
GOLD - Consolidation near 4,100. Bearish trend ICMARKETS:XAUUSD remains under pressure from the bearish trend and a strong dollar, confirming its bearish market structure. A retest of the 4,110 support is forming, along with a pre-breakout base...
Gold has resumed its decline and is threatening the $4,100 level after pulling back from $4,200.
In the near term, sellers remain in control due to elevated Treasury yields, a strong dollar, and rising oil prices, despite expectations of an October Fed rate hike having almost completely disap
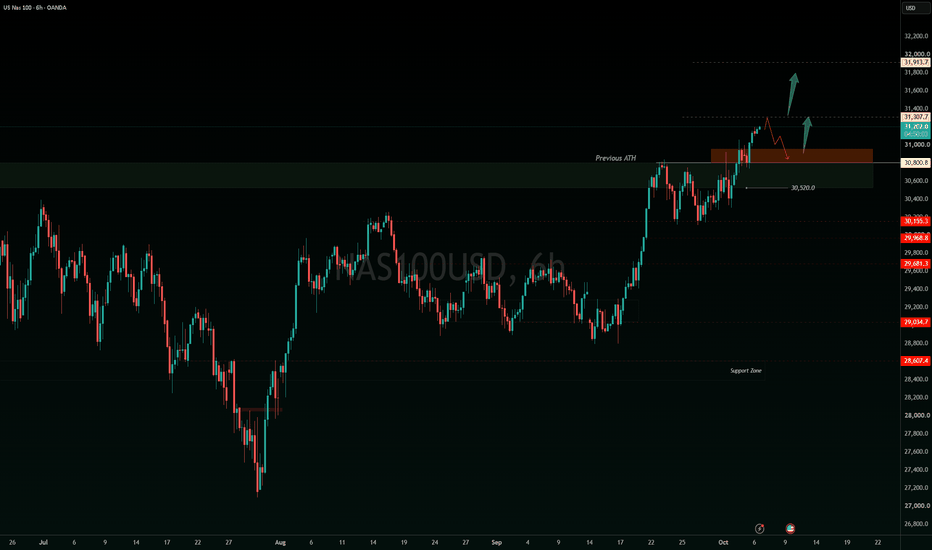
USNAS100 | Fresh ATH 31,300 Is the Next Key Level
USNAS100 has recorded a fresh all-time high and continues to maintain a bullish structure.
The next important upside level is 31,300.
A confirmed breakout above 31,300 would strengthen bullish momentum and open the way toward: 31,600 → 31,900
However, while the price remains below 31,300, a short-term corrective movement toward the 30,950–30,800 zone remains possible.
This correction would not change the broader bullish outlook as long as 30,800 holds.
A confirmed 1H or 4H close below 30,80
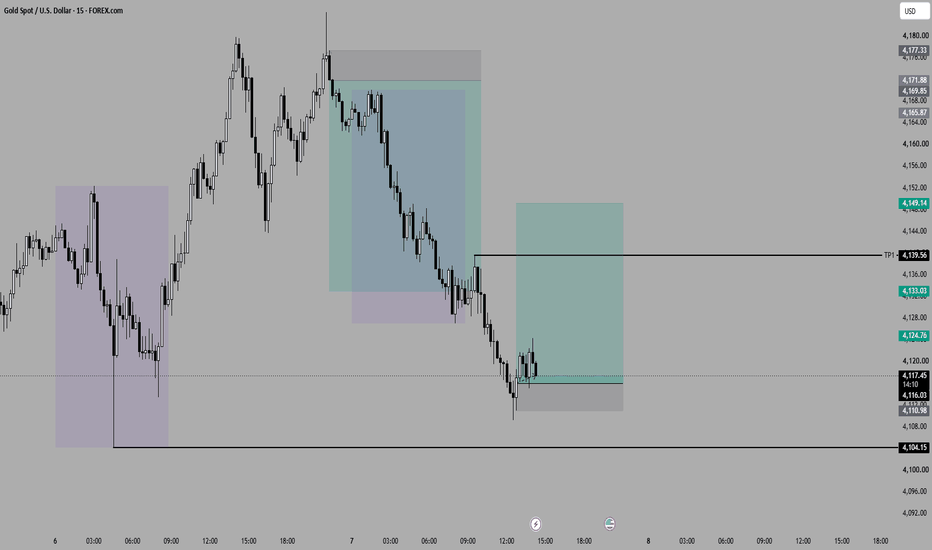
XAUUSD 15M Long Setup | Gold Reversal OpportunityXAUUSD 15M Long Setup
Gold has presented a potential long setup on the 15-minute timeframe after the recent move lower.
My rule-based strategy identified a long opportunity around the 4116 area. The setup is now active, with price beginning to react from the entry zone.
Entry: ~4116
Stop Loss: ~4111
Target: ~4139
The trade will remain valid as long as the stop-loss level holds. I will update this idea as the setup develops, whether it reaches the target or gets stopped out.
This is shared for ed
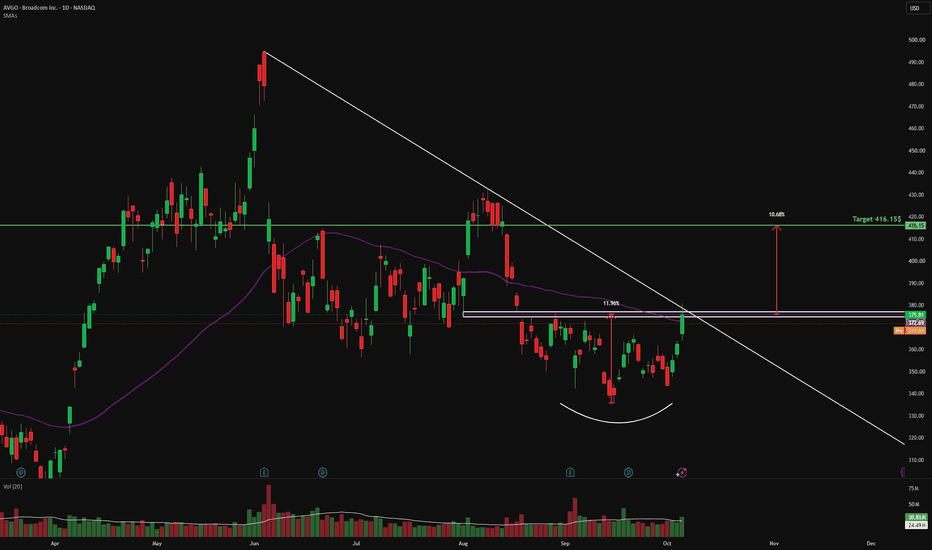
AVGO: 50 SMA Cross with Cup Pattern at Resistance💡 Swing setup idea
50 SMA Strategy
🔎 Analysis summary:
The stock is just crossing the 50-day moving average and reaching resistance. We can also see a closing of a cup pattern and rising buyers volume. This alignment of trend, pattern and volume makes the breakout area key to watch. The upside potential is projected by the depth of the cup from the breakout point.
👀 Levels to watch:
Entry trigger: Break above $377.00
Target: $416.15
Stop: Under the support / base of the pattern
💬 Will
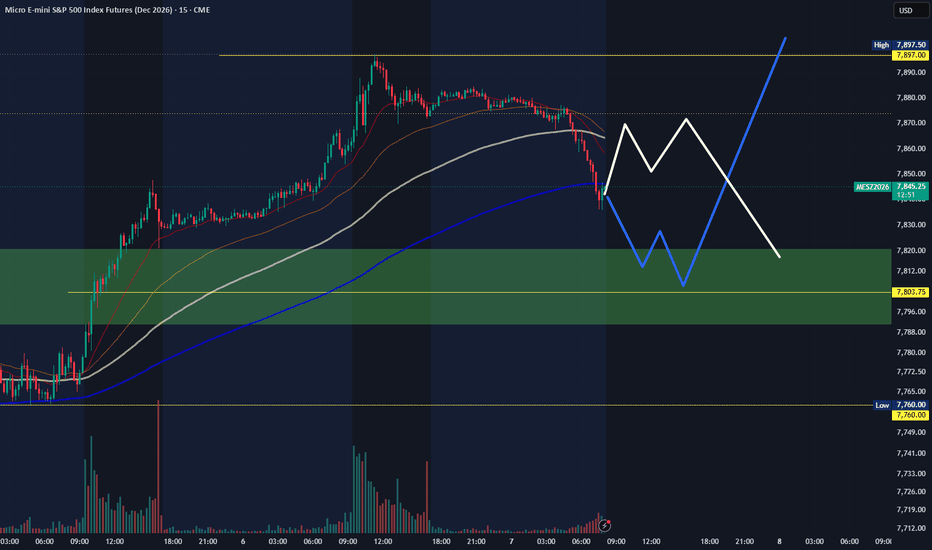
MESZ Oct 7: Pullback Into 7800 FVG Before Another Push Toward 78MESZ is trading around 7,843 after pulling back from yesterday’s high near 7,897.
The main area I’m watching today is the stacked 4-hour and 1-hour fair value gap around 7,800.
If price revisits that zone, I’ll look for bullish confirmation rather than assuming the level must hold.
A successful reaction from the FVG could support another move toward the major upside liquidity around 7,897.
On the downside, 7,760 is the key higher-time-frame invalidation level.
A confirmed 4-hour close below 7,76
SPY Slipped Back Under The 779.37 August High.SPY Slipped Back Under The 779.37 August High.
SPY is trading near 775.70 premarket after Tuesday traded through the 779.37 August high to 781.62 and then closed 28 cents under it at 779.09. Overnight it has given back the 779 area and sits just above Monday's 774.83 close. On the hourly, ACE reads Q1 against a bearish anchor with a yellow light; on the 4H the light is still green but conviction has dropped to Q4 against a bullish anchor, while the 4H structure remains bullish. Both timeframes
GbpCad Trade IdeaLast night I posted GC shorts Idea along with another post executing the trade. Price ended up hitting TP 6 minutes ago for a 1:3rr. Solid trade. Could potentially see price tap back into 1.87630.
Thank you Lord for this skill. Have a great day ! Currently 1 win and 1 trade stopped out in profit for the week.
Week 41 of 52 | SPCX Is This Finally the Breakout?NASDAQ:SPCX is sitting at one of the most important levels on the chart since the IPO.
The stock closed Friday at $158.96, up 7.35%, after trading as high as $159.84. Volume also increased sharply, which makes this breakout attempt more interesting than a simple low-volume move.
The chart has been building toward this for weeks.
After reaching an all-time high around $225, SPCX sold off hard and eventually found support near $108. From there, the structure started to improve. The stock stop
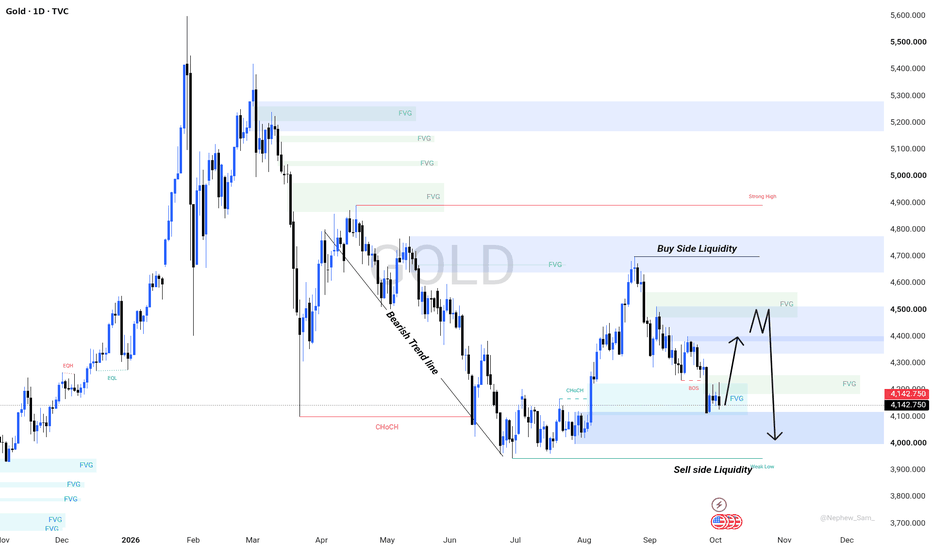
XAUUSD Bearish Market Structure Meets Sell-Side Liquidity.Gold continues to show a bearish market structure on the daily timeframe, with price forming lower highs and respecting the broader descending trendline. The recent rejection from the 4,700 buy-side liquidity zone has brought price back toward the 4,100–4,200 demand/support area, where buyers may attempt to defend the market.
The current structure suggests that price could first experience a corrective bullish retracement before the next potential bearish continuation. The highlighted 4,350–4,50
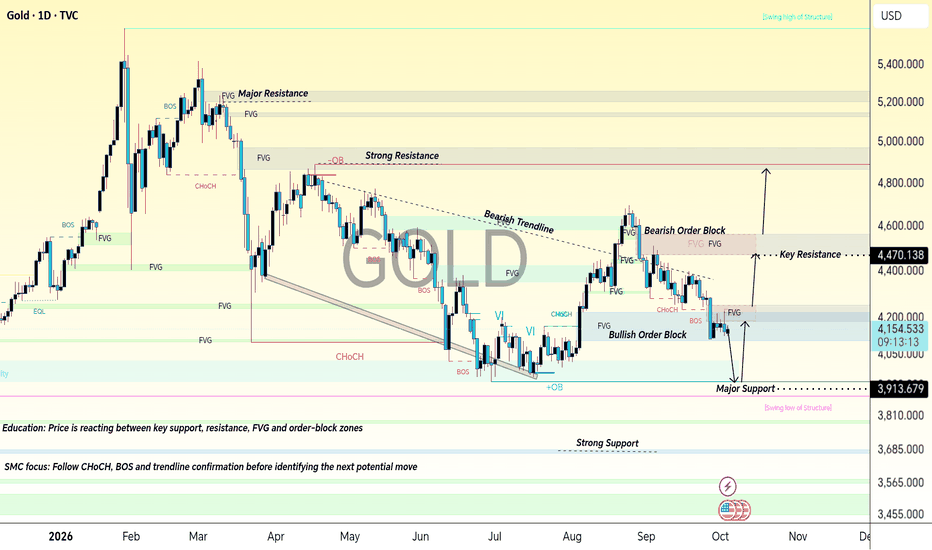
XAUUSD 1D | SMC Market Structure Liquidity & Trendline EducationXAUUSD 1D — Professional Candle-by-Candle Education
This chart explains why each candle can create buying or selling pressure, using SMC concepts such as liquidity, market structure, BOS, CHoCH, FVG, Order Blocks and the descending trendline. A candle should never be judged alone; its location and the candles before it determine whether buyers or sellers have the advantage.
1. First Bullish Candle — BUY Reason
Buyers enter from the lower demand area. The candle closes stronger than it opens, s
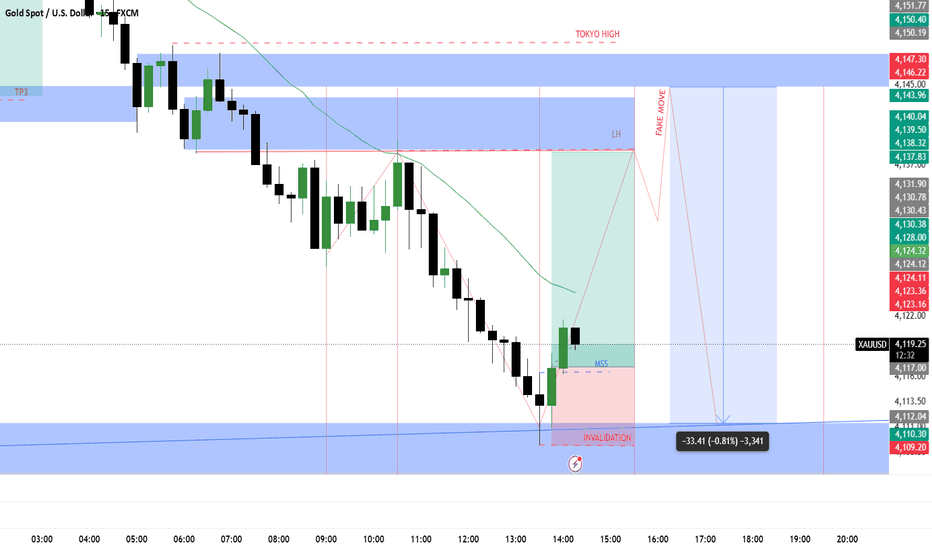
XAUUSD |Sell-Side Liquidity Taken → Bullish MSS → London ReversaXAUUSD | 15M 📊
Gold has been delivering lower throughout the session, pushing directly into a key discount / demand area around 4110–4112.
Price then swept the lows and reacted from the zone, followed by the first bullish Market Structure Shift (MSS). 👀
The idea here is not to blindly buy the low — I’m looking for confirmation that order flow is actually beginning to shift.
🔹 Current Setup
💧 Sell-Side Liquidity: Taken below the recent lows
📍 POI: 4110–4112 demand zone
📈 Confirmation: Bullish MSS
EURNZD: FVG Trade 🇪🇺🇳🇿
EURNZD will likely fill a fair value gap on an hourly time frame.
Expect a bullish continuation to 2.0005
❤️Please, support my work with like, thank you!❤️
I am part of Trade Nation's Influencer program and receive a monthly fee for using their TradingView charts in my analysis.
EURNZD - Looking To Sell PullbacksH1 - Strong bearish move.
Currently it looks like a pullback is happening.
Expecting bearish continuation until the two Fibonacci resistance zones hold.
If you enjoy this idea, don’t forget to LIKE 👍, FOLLOW ✅, SHARE 🙌, and COMMENT ✍! Drop your thoughts and charts below to keep the discussion going. Your support helps keep this content free and reach more people! 🚀
BankNifty levels - Oct 08, 2026Utilizing the support and resistance levels of BankNifty, along with the 5-minute timeframe candlesticks and VWAP, can enhance the precision of trade entries and exits on or near these levels. It is crucial to recognize that these levels are not static, and they undergo alterations as market dynamics evolve.
The dashed lines on the chart indicate the reaction levels, serving as additional points of significance. Furthermore, take note of the response at the levels of the High, Low, and Close va