EURUSD Breakout and Potential Retrace!Hey Traders, in today's trading session we are monitoring EURUSD for a selling opportunity around 1.12300 zone, EURUSD was trading in an uptrend and successfully managed to break it out, currently is in a correction phase in which it is approaching the retrace area.
Trade safe, Joe.
Support and Resistance
Gold (XAUUSD) — Higher Time Frame Bearish OutlookGold (XAUUSD) — Higher Time Frame Bearish Outlook
Gold is currently showing a bearish higher-time-frame structure, with price respecting lower highs and continued downside displacement after rejection from the upper supply region. The current price action suggests that rallies into marked resistance and imbalance zones may provide opportunities for sellers, while the downside remains vulnerable toward the lower demand area.
Key Selling Zones
4,250–4,300 — Near-Term Resistance
A retracement in
XAUUSD — Liquidity Sweep + CHoCH + Trendline Break + Order Block
This analysis presents a complete SMC liquidity-based reversal model using liquidity sweep, market structure, trendline behavior, support/resistance, and Order Block confirmation.
The market initially remains under a descending trendline, showing that sellers are controlling the broader move. As price continues lower, previous swing lows become important because liquidity can accumulate below these levels. These lows may contain stop-loss orders from buyers as well as breakout sell orders.
Th
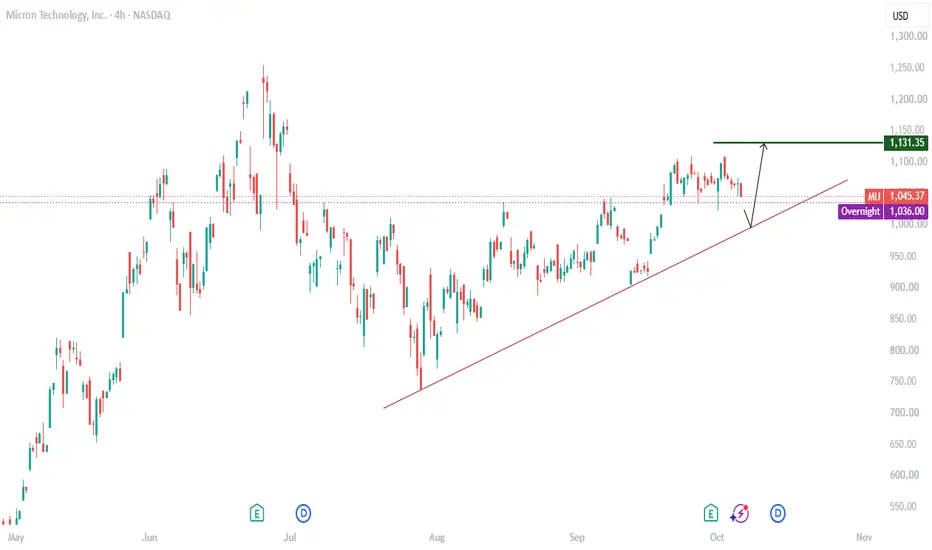
MU: Price Ranging Down To The Support LineMicron Technology Inc. (MU) closed regular trading at $1,045.56, down -1.73%. the mild decline mirrors broader cyclical volatility and sector rebalancing within the semiconductor market, despite the company's powerhouse financial performance. Morgan Stanley maintains an overweight rating with a $1,200 price target.
Technical Insight:
MU is still sustaining its uptrend channel momentum. The stock has been moving in sideways formation for a few weeks now, in respect to the structure. Price is cur
EUR-NZD Rebound Expected! Buy!
Hello,Traders!
EURNZD will retest the horizontal demand area, where a sell-side liquidity sweep and order block mitigation could complete accumulation before expansion toward the marked target.Time Frame 4H.
Buy!
Comment and subscribe to help us grow!
Check out other forecasts below too!
BTCUSDT - Strong downtrend🔴 MARKET BIAS: BEARISH (Strong Downtrend Active) 🔴
📉 Timeframe Breakdown
* 4H: $87,200 → $83,000. Clear Lower High / Lower Low structure. Momentum is strictly bearish.
* 1H: Dump from $86,800 → $82,750 resulted in a dead cat bounce. Downward continuation is playing out.
* 15M: $86,600 → $82,800 → current price $83,418. The chart is printing lower highs on every bounce.
🚧 Key Levels
* Resistance: $84,200 – $84,400 (Previous support flipped to resistance)
* Support: $82,800 | $82,200 (Ma
GBP/USD Slips as 5.3% Treasury Yield Keeps Dollar BidGBP/USD traded lower on Wednesday as the U.S. Dollar remained supported by elevated Treasury yields and oil-driven inflation concerns. The $39 billion 10-year auction was notably strong, stopping at 5.30% with a 2.77 bid-to-cover and heavy indirect demand. That pulled the 10-year yield back from an intraday high near 5.36%, taking some heat out of the U.S. Dollar without reversing the broader rates story.
The FOMC minutes reinforced a Fed still focused on persistent inflation, while showing le
BULL Long Breakout resistance + pullback
Entry 8.25
Stop 7.9
Target 12, 17
Risk management is much more important than a good entry point.
I am not a PRO trader. About 25% of my trades had been stopped quickly.
BFF (buy for Free)
SellToOpen 2028-1-21 P7.5, 1.56 (Delta=-0.29)
BuyToOpen 2028-1-21 C12.5, 1.32 (C12.5 Delta= 0.43)
Total Credit 0.24
If this option plan is stopped at 6.9, stop loss about 1.0
OCDO: A fifteen-year floor and a retail arm that finally worksSYMBOL: LSE:OCDO | DIRECTION: LONG | TIMEFRAME: 2-Week
Published: October 2026
Ocado has fallen roughly 91% from its 2021 high. This year it arrived in the band between 130p and 210p, and stopped. That band is not arbitrary, it is where the shares based between 2011 and 2013, circled on the chart, before the advance that eventually took them above 2,800p. Fifteen years later, the same floor is holding. Hello… Meanwhile something changed inside the business that the 19% drop on the half-yea
HLN a W pattern starting to emerge?Take a look at the chart around 24 June. The price gapped up strongly and finished 4.4% higher on the day. That gap looks like it’s coming back into play, with a big concentration of volume sitting right here, so buyers could be defending this level.
The last couple of weeks have also seen some of the heaviest volume of the year, yet the price has barely moved. Big effort, little result, which could be buyers absorbing the selling.
Above the current price there’s a lull in volume up to around
WTI — Crude rolls over inside the range, heading back toward 85
WTI is trading at 89.99 after rejecting the 107 ceiling for the third time in late September. Price has lost both moving averages — the 50 EMA at 93.18 and the 200 EMA at 92.87 — and the descending line off that September high is pushing it down toward the lower boundary of the range.
The broader picture is a large horizontal range that has defined crude since March, bounded by 107 on top and roughly 85 at the bottom. Within it, price has made the full round trip twice: down to 85 in July, b
Trade #10 Break & Retest Buy TradeTrade #10
GBPCHF, 4H, A+ Setup.
D1,H4 aligned both in a strong uptrend.
H4 Reistance level turned Support tested more than 5 times before breakout.
H4 50 EMA acting as Support.
H4 Pin Bar long wick showing rejection at the level
Entry 1.10134 / Stop loss 1.09816 / Take Profit 1.10800
#BreakAndRetest #VictorK_Trades
XAU/USD 15m Short Idea: Resistance Retest & Liquidity Sweep RejeAnalyzing the Gold (XAU/USD) 15-minute chart, a potential short setup is forming as price retraces into a key intraday resistance zone:Liquidity Sweep & Retest: Following a sharp decline, price swept lower liquidity and bounced back toward the key broken level and supply area between $4,119.93 and $4,127.33. Market Structure: The pull-back into the previous support-turned-resistance zone presents a favorable location for sellers to regain control and push price lower. Trade Parameters:Entry
Nano market cap RC365 Holding to explode 10,000% / 100x ???** high risk, tiny market cap **
On the above 4 day chart price action has corrected 99% since mid 2023. A number of reasons now exist for a bullish outlook, they include:
1) Price action and RSI resistance breakouts.
2) Support on past resistance since October last.
3) Strong positive divergence. Multiple oscillators print positive divergence with price action.
4) Should the monthly candle close as is (below), then a rapid move to the 20 Pounds area followed by a move to 126 should be obse
BTC 4h: Rising Structure Broken, Old High Is the Key LevelBTC 4h: the rising structure broke down. 📉
Three rejections at ~$87K on top, and the rising trendline underneath is now lost. The bearish RSI divergence I flagged at the double top is playing out. Price is at ~$83.3K.
On the higher timeframe, price is now back at the old high (~$82-83K) and sits right under the wedge it just fell out of. That's where the reaction decides it.
What I'm watching:
→ A retest of the broken trendline from below (~$85K). Rejection there confirms the break.
→ Below t
IWM: Bearish Trends The ishares Russell 2000 ETF (IWM) closed its most recent trading session at $281.52, up 0.90% on the day. the fund is navigating a volatile macroeconomic environment, trading between a 52-week range of $228.44 and $305.18. Analysts highlight that the fund continues to trail large cap indexes over the long term.
Technical View:
IWM is on a descending channel momentum. The ETF has been trending on this downside structure with lower lows and lower highs for a couple weeks now, in regard to the fr
Bitcoin Presses Against $87K: Could a Squeeze Unlock $92K?Bitcoin is testing the $87K resistance area again, with recent pullbacks forming higher lows. Pressure is building beneath a familiar ceiling, bringing a potential breakout toward $92K into focus.
📌 Potential trade setup:
Priority direction: BUY
Entry zone: 88000
Target: 92233
Stop: 85892
📝 Notes: The recovery from the failed breakdown near $76K has carried price back above the $82K area and into repeated tests of resistance around $87K–$87.5K . The latest rising lows suggest sel