BankNifty levels - Oct 13, 2026Utilizing the support and resistance levels of BankNifty, along with the 5-minute timeframe candlesticks and VWAP, can enhance the precision of trade entries and exits on or near these levels. It is crucial to recognize that these levels are not static, and they undergo alterations as market dynamics evolve.
The dashed lines on the chart indicate the reaction levels, serving as additional points of significance. Furthermore, take note of the response at the levels of the High, Low, and Close va
Support and Resistance
Nifty levels - Oct 13, 2026Nifty support and resistance levels are valuable tools for making informed trading decisions, specifically when combined with the analysis of 5-minute timeframe candlesticks and VWAP. By closely monitoring these levels and observing the price movements within this timeframe, traders can enhance the accuracy of their entry and exit points. It is important to bear in mind that support and resistance levels are not fixed, and they can change over time as market conditions evolve.
The dashed lines
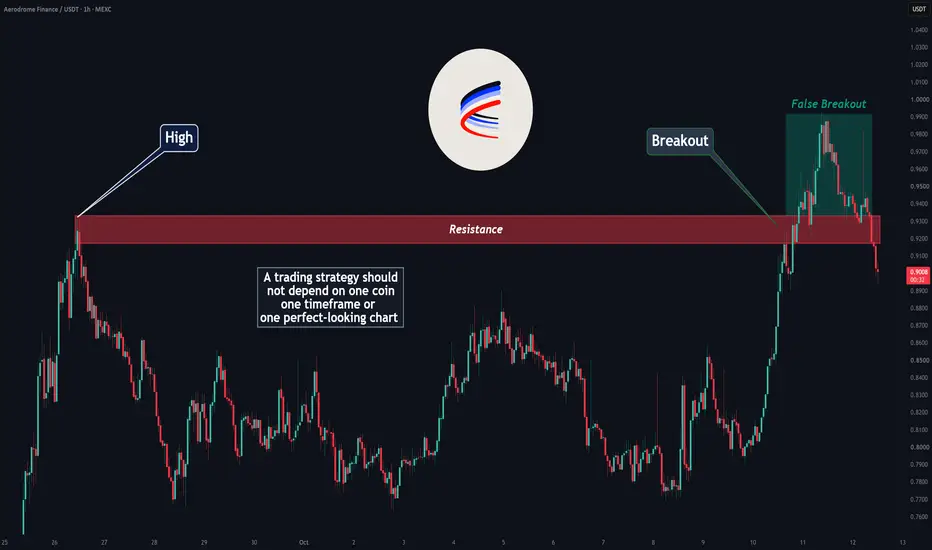
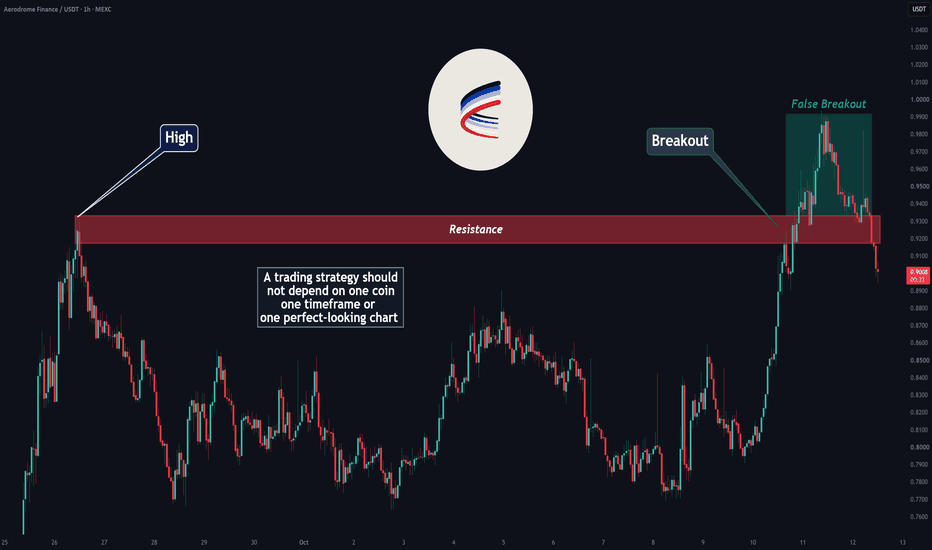
Fake Breakout Strategy: Another Real-Chart ExampleA trading strategy should not depend on one coin, one timeframe, or one perfect-looking chart. What matters is understanding the price behaviour behind the setup .
In the previous article, we introduced the Fake Breakout strategy using JUPUSDT. If you missed it, you can read it here:
Previous Article: Fake Breakout — When a Breakout Becomes a Trap
This time, let’s look at another example: AEROUSDT on the 1-hour chart.
The goal is not to predict every move or present a perfect trade. We wa
JPMorgan Pulls Back Before EarningsJPMorgan Chase has pulled back, but it may be stabilizing as earnings approach.
The first pattern on today’s chart is the decline since early September. JPM bounced near a weekly close from June early this month, followed by a retest last week. That double bottom may suggest the downward move is finished.
Second, the financial giant is pushing through a falling trendline.
Next, the recent lows occurred above the rising 200-day simple moving average (SMA). The 100-day SMA is also above the 200
MESZ Oct 12: Hold 7827 or Break 7896 Toward 7960?MESZ is trading around 7,860 after an overnight push higher.
My current bias is neutral to bullish, with price trading between two important higher-time-frame levels.
The main support zone sits around 7,827, where the lower-time-frame chart also shows an order-block/reaction area.
If buyers defend this zone with confirmation, I’ll continue watching for another push toward 7,896.
A confirmed 4-hour close above 7,896 would strengthen the bullish structure and could open continuation toward approxi
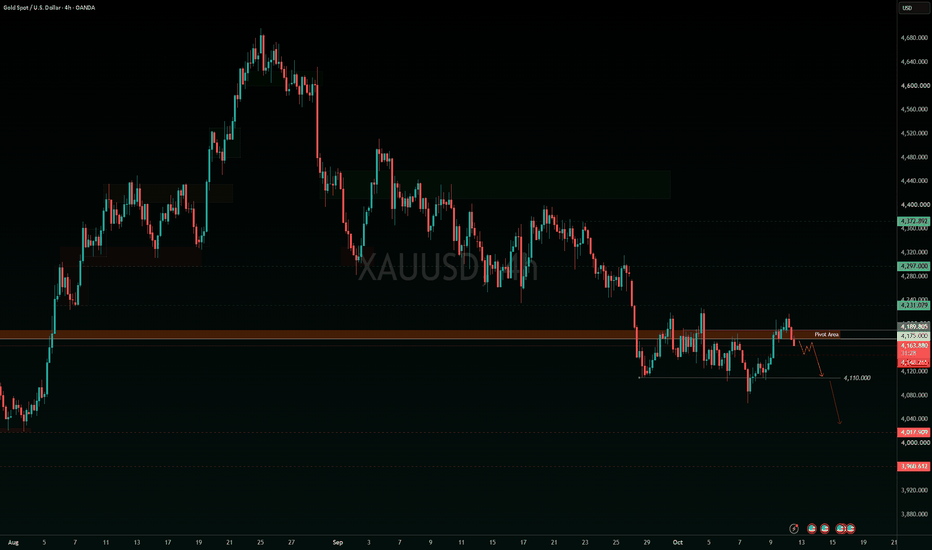
GOLD | Bearish Below 4,175 — 4,148 in FocusGOLD | Bearish Below 4,175 — 4,148 in Focus
Gold remains under bearish technical pressure while trading below the important 4,175 pivot.
As long as the price remains below this level, bearish momentum stays active toward 4,148
A confirmed break below 4,148 would strengthen the downside move toward 4,110
On the other hand, recovery above 4,175 would weaken the bearish structure.
A confirmed break above 4,195 could support bullish continuation toward 4,231 → 4,270
A meaningful geopolitical d
SPY Is Pressing The 779.37 August High Again.SPY Is Pressing The 779.37 August High Again.
SPY is trading near 779.10 premarket, just under the 779.37 August high. Friday traded to 779.42 and closed at 778.57, the second time in a week it has traded through that line without closing above it. The hourly structure is choppy with a bearish tilt, the hourly light is yellow and a high-sweep anti-signal is active. On the 4H the structure is impulse continuation to the upside, the light is green, and the last 4H announcement, from last Monday,
BTC Is Back Inside The Range, Capped At 84,000.BTC Is Back Inside The Range, Capped At 84,000.
BTC is trading near 83,260 after recovering last week's break below the 82,709 September floor. The weekend pushed up to 84,262, but no 4H bar closed above 84,000, and the 4H carries a high-sweep anti-signal from that rejection. On the 4H the structure is converging with a bearish tilt at low confidence and the traffic light is yellow. The hourly structure is choppy, with Saturday's bullish announcement at 82,916 sitting under price, and IMP shows
XAUUSD Potential Bullish ReversalGold is showing signs of bullish recovery following its recent rejection of lower prices.
I'm anticipating a possible retracement into the $4,120–$4,140 demand zone , where buyers could step in for another bullish move.
The objective is to capitalize on a potential support retest and bullish continuation toward the $4,307–$4,315 resistance region.
- Avoid forcing entries if the demand zone fails to hold.
The broader bearish trend remains a concern, so confirmation is essential.
*This is
BTC: 180 BTC resting at 84,340The largest resting order in view is 180 BTC at 84,340.
THE BOOK RIGHT NOW
180 BTC of asks at 84,340
123 BTC of asks at 84,500
spot 83,271
195 BTC of bids at 83,000
136 BTC of bids at 82,800
within 1% of mid the book is 58% bid
CONTEXT
Volume POC at 83,788, value area 83,375 to 83,975
CVD over 4h is -1,228 BTC
Open interest +0.26% on the hour with price -0.29% - reads as new shorts
Funding +6.72% annualised
OPTIONS POSITIONING (GEX)
Dealers look long gamma by our flow es
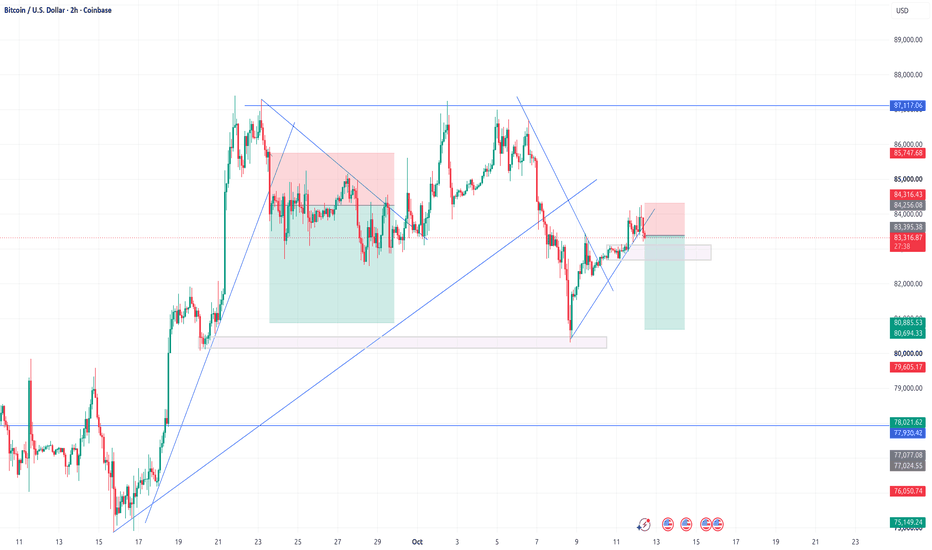
BTCUSD Bearish Continuation (risky)Bitcoin continues to show bearish pressure following multiple rejections around the $87,100 resistance zone, forming lower highs.
The recent bullish retracement toward $84,000–$84,300 presents a potential selling opportunity, with price approaching a key resistance area.
Target: $80,800
Invalidation: Sustained break above $84,500
A breakdown below $82,700 would further strengthen the bearish bias.
Watching for sellers to regain control and push price toward the $80,000 demand zone.
#B
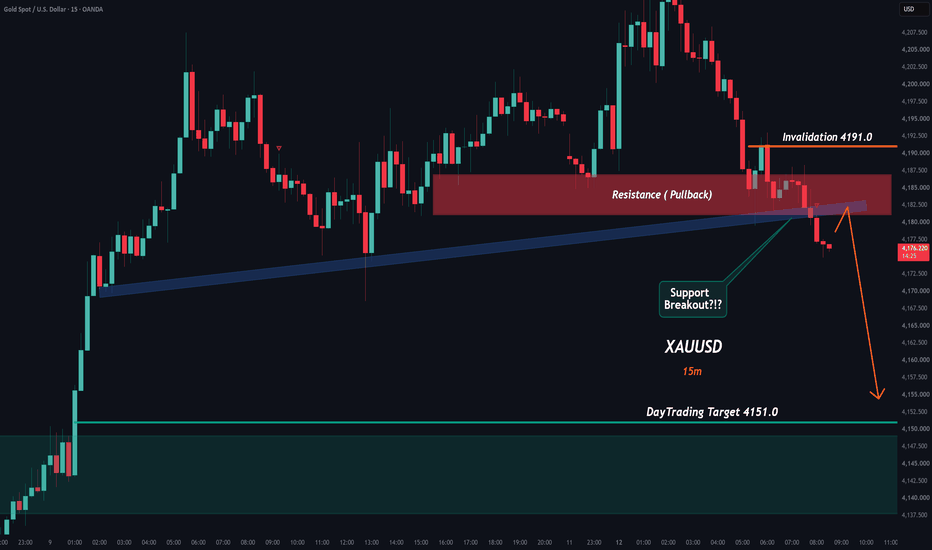
Gold (XAUUSD): Breakdown & Retest Short PlanSuccessful intraday trading is about patience and risk management—waiting for broken support to act as resistance gives us a clean risk-to-reward edge rather than chasing breakdown momentum.
Key Execution Levels
• Bias: Bearish Intraday Continuation
• Resistance Zone (Retest): 4182.5 – 4187.5
• Structural Invalidation: 4191.0
• DayTrading Target: 4151.0
Market Structure & Technical Breakdown
XAUUSD has broken below the key 4185 support level and the short-term ascending trendline,
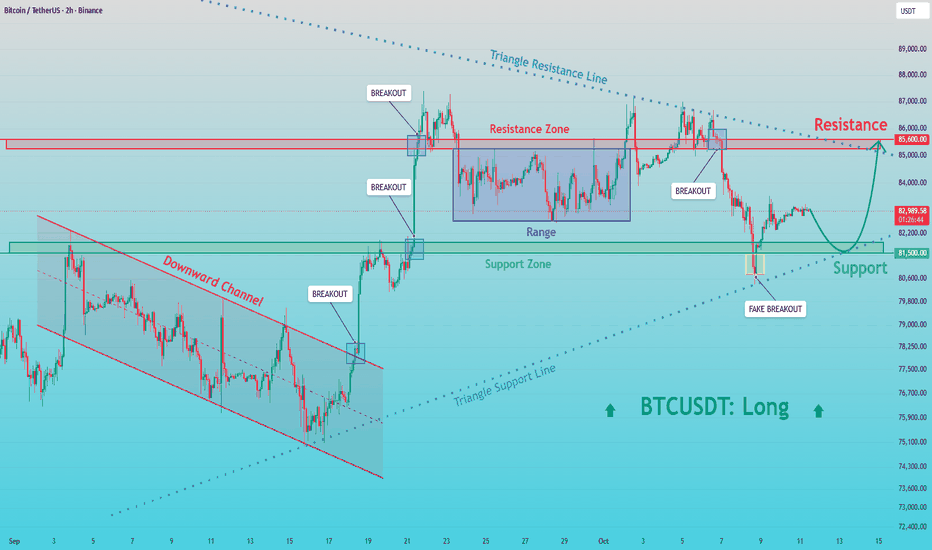
BTCUSDT: Recovers From a False Breakout — Can We Reach 85,6K?Hello everyone, here is my breakdown of the current BTCUSDT setup.
Market Analysis
BTCUSDT previously traded inside a downward channel and triangle structure before breaking higher. Price then formed a range, tested the Resistance Zone near 85,600, and pulled back toward the Support Zone with a fake breakout.
Currently, BTCUSDT is trading below the 85,600 Resistance Zone while holding above the 81,500 Support Zone and the ascending Triangle Support Line. The recent rebound from support sugge
GBP/USD ANALYSIS FOR THE WEEKGBP/USD 30M - As you can see price has continuously been reacting to the Demand Zones that have been left behind after every push, we are seeing price slow at the one we are looking at entering in from.
Last night when I was analysing this pair, I had marked out the zone before this one and was expecting a reaction from it, we got exactly what we predicted last night I just didn't get the chance to update you all with my analysis.
Nevertheless price has now traded down into this more refined z
AUDUSD rallies into its last lower high: my short plan📉 AUDUSD · Short setup (1D)
THE SETUP
The daily trend is down, and it is a strong one (ADX 42). Price has now bounced back up to the last lower high of that trend, at 0.6992. That is the spot where a down trend either holds or breaks, so the plan is simple: sell just under the level, with the stop above it.
CONFLUENCES
• Daily trend is down (ADX 42)
• Entry sits just under the last lower high at 0.6992
• Stop sits above that high
TRADE PLAN
Entry zone: 0.69696 to 0.69764
Stop loss: 0.70067 (a
Oil (WTI) – Geopolitical Tensions Continue to Dominate SentimentOil (WTI) starts the new trading week with geopolitical tensions across the Middle East remaining elevated following another weekend of escalating hostilities. A confirmed US military strike against a commercial cargo vessel in the Gulf of Oman on Saturday, alongside 2 deadly missile attacks by Houthi rebels on Saudi Arabia’s Riyadh airport, have heightened concerns over regional stability and the security of energy supplies. However, despite this, prices initially fell over 2.5% in early tradin
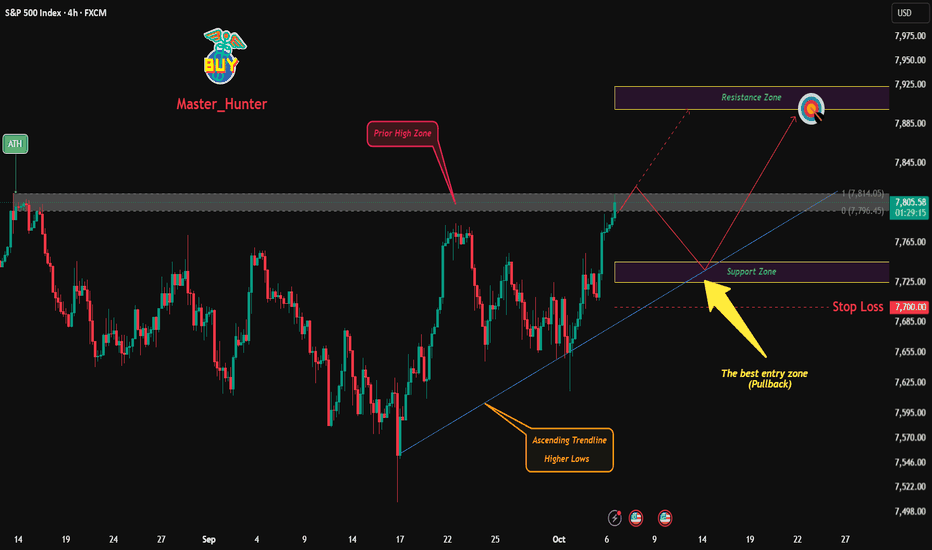
SPX500 Breakout Retest — Push to 7,900?Hook:
FX:SPX500 has broken above the previous 7,796–7,814 resistance area while respecting its rising trendline — now the key question is whether a pullback into 7,725–7,745 can turn the breakout into a continuation toward 7,900. 🔥
Market Context:
SPX500 is trading on the 4H chart with a clear sequence of higher lows, supported by an ascending trendline that has been guiding the recovery.
Price has now pushed through the previous reaction area around 7,796–7,814, shifting the short-term
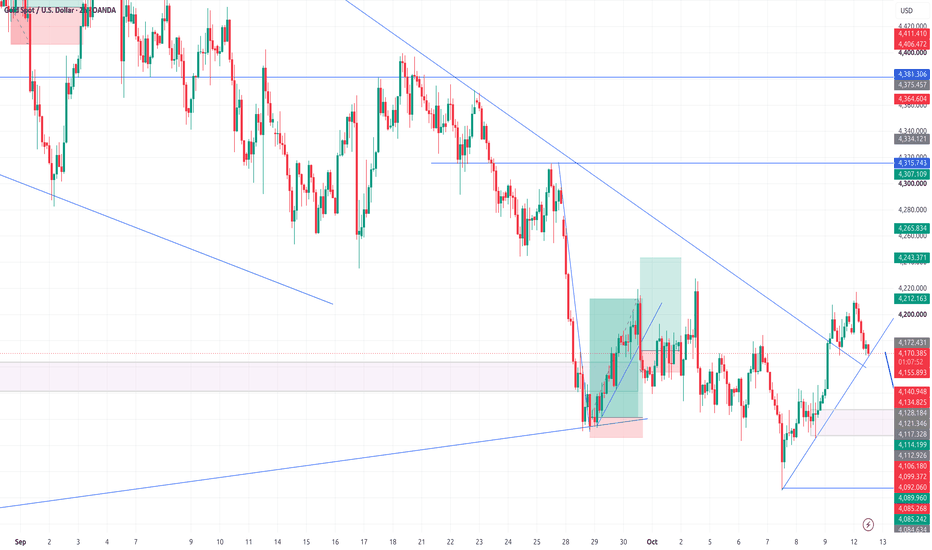
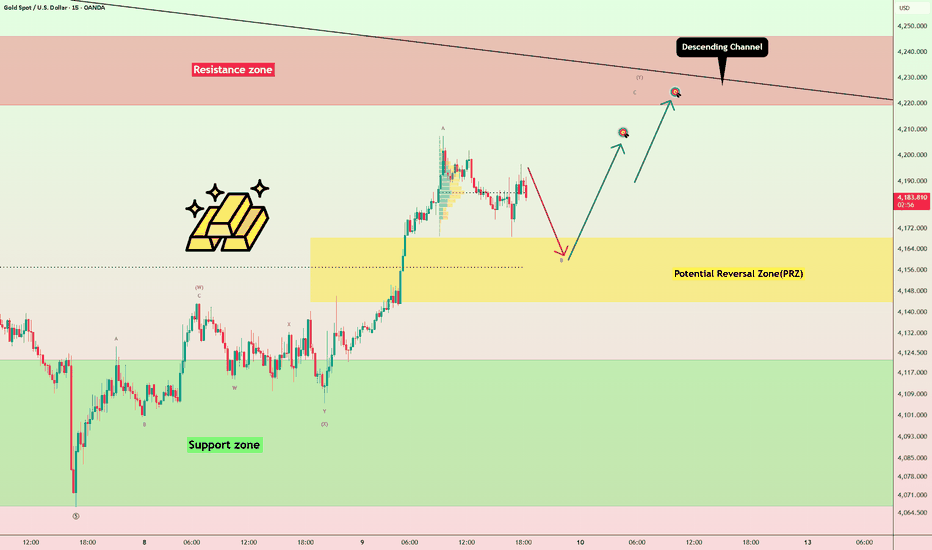
Gold Approaches Key Resistance: Can Bulls Break Above $4,220?Gold ( OANDA:XAUUSD ) has started to rise from the Support Zone($4,122-$4,067), gaining strong bullish momentum over the past few days.
The price is now approaching the Resistance Zone($4,246-$4,219) and the upper trendline of the Descending Channel.
Can gold extend this recovery above $4,220, or is another bearish reaction approaching?
Technical Analysis
Since today is the last trading day of the week, this analysis focuses on the 15-minute time frame.
From an Elliott Wave perspective, gol
BTC: long liquidation under 267 BTC resting at 84,800Open interest is -0.19% on the hour with price -0.28%, which is positions closing rather than new ones opening.
THE BOOK RIGHT NOW
267 BTC of asks at 84,800
134 BTC of asks at 84,500
spot 83,520
226 BTC of bids at 83,000
146 BTC of bids at 82,460
within 1% of mid the book is 54% bid
CONTEXT
Volume POC at 83,788, value area 83,475 to 84,050
CVD over 4h is -275 BTC
Open interest -0.19% on the hour with price -0.28% - reads as long liquidation
Funding +3.36% annualised
OPTION
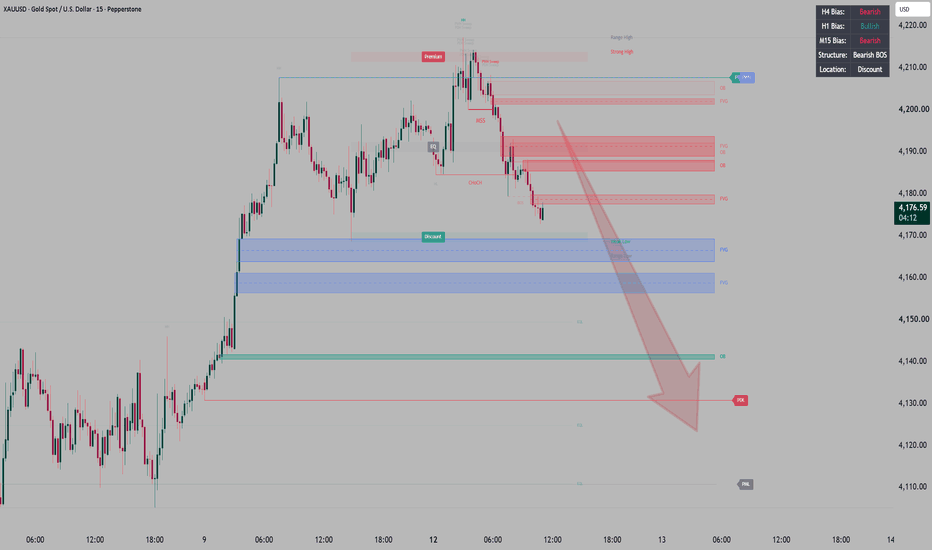
XAUUSD — Bearish Bias | Waiting for the PullbacXAUUSD — Bearish Bias | Waiting for the Pullback
My Daily and H4 bias remains bearish. I’m treating the bullish H1 move as a pullback within that broader context, while the current M15 decline is a smaller move within the H1 structure.
The preferred scenario is a return to the marked FVG zone around 4200. From there, I’ll watch the lower timeframe for rejection and a bearish structure shift before considering a short.
If confirmation develops, I’ll look for continuation toward PDL around 4130
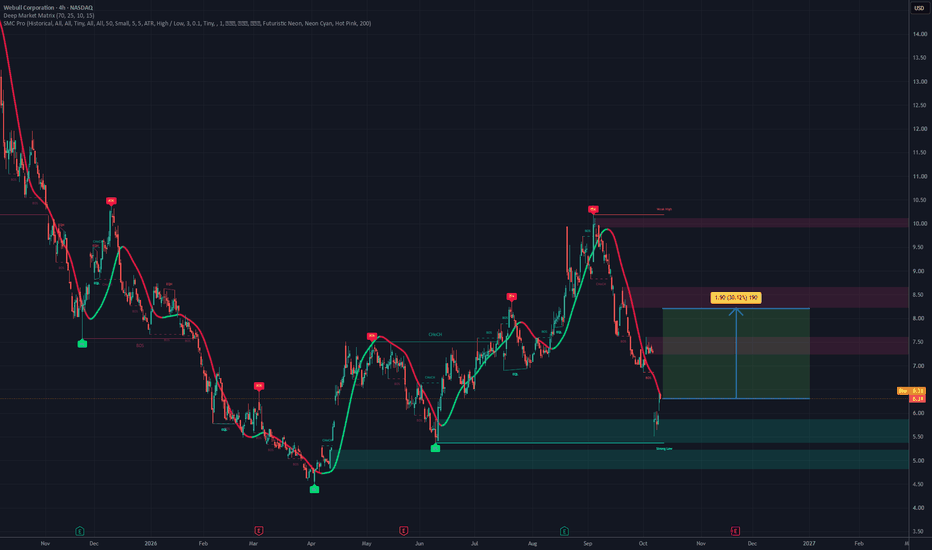
Webull (BULL) — Potential Rebound Toward $8.20 (+30%)Webull Corporation has recently pulled back sharply after reaching the $10.00 resistance area. The price is now trading around $6.30 and approaching an important support zone between $5.40 and $5.80.
This area has previously acted as a strong reaction zone, making it an important level to watch. The recent sell-off has weakened the short-term structure, so buyers need to regain control before a stronger recovery can be confirmed.
The first important signal would be a sustained move back above