Support and Resistance
GbpCad Trade IdeaLast night I posted GC shorts Idea along with another post executing the trade. Price ended up hitting TP 6 minutes ago for a 1:3rr. Solid trade. Could potentially see price tap back into 1.87630.
Thank you Lord for this skill. Have a great day ! Currently 1 win and 1 trade stopped out in profit for the week.
Week 41 of 52 | SPCX Is This Finally the Breakout?NASDAQ:SPCX is sitting at one of the most important levels on the chart since the IPO.
The stock closed Friday at $158.96, up 7.35%, after trading as high as $159.84. Volume also increased sharply, which makes this breakout attempt more interesting than a simple low-volume move.
The chart has been building toward this for weeks.
After reaching an all-time high around $225, SPCX sold off hard and eventually found support near $108. From there, the structure started to improve. The stock stop
XAUUSD Bearish Market Structure Meets Sell-Side Liquidity.Gold continues to show a bearish market structure on the daily timeframe, with price forming lower highs and respecting the broader descending trendline. The recent rejection from the 4,700 buy-side liquidity zone has brought price back toward the 4,100–4,200 demand/support area, where buyers may attempt to defend the market.
The current structure suggests that price could first experience a corrective bullish retracement before the next potential bearish continuation. The highlighted 4,350–4,50
XAUUSD 1D | SMC Market Structure Liquidity & Trendline EducationXAUUSD 1D — Professional Candle-by-Candle Education
This chart explains why each candle can create buying or selling pressure, using SMC concepts such as liquidity, market structure, BOS, CHoCH, FVG, Order Blocks and the descending trendline. A candle should never be judged alone; its location and the candles before it determine whether buyers or sellers have the advantage.
1. First Bullish Candle — BUY Reason
Buyers enter from the lower demand area. The candle closes stronger than it opens, s
XAUUSD |Sell-Side Liquidity Taken → Bullish MSS → London ReversaXAUUSD | 15M 📊
Gold has been delivering lower throughout the session, pushing directly into a key discount / demand area around 4110–4112.
Price then swept the lows and reacted from the zone, followed by the first bullish Market Structure Shift (MSS). 👀
The idea here is not to blindly buy the low — I’m looking for confirmation that order flow is actually beginning to shift.
🔹 Current Setup
💧 Sell-Side Liquidity: Taken below the recent lows
📍 POI: 4110–4112 demand zone
📈 Confirmation: Bullish MSS
EURNZD: FVG Trade 🇪🇺🇳🇿
EURNZD will likely fill a fair value gap on an hourly time frame.
Expect a bullish continuation to 2.0005
❤️Please, support my work with like, thank you!❤️
I am part of Trade Nation's Influencer program and receive a monthly fee for using their TradingView charts in my analysis.
EURNZD - Looking To Sell PullbacksH1 - Strong bearish move.
Currently it looks like a pullback is happening.
Expecting bearish continuation until the two Fibonacci resistance zones hold.
If you enjoy this idea, don’t forget to LIKE 👍, FOLLOW ✅, SHARE 🙌, and COMMENT ✍! Drop your thoughts and charts below to keep the discussion going. Your support helps keep this content free and reach more people! 🚀
BankNifty levels - Oct 08, 2026Utilizing the support and resistance levels of BankNifty, along with the 5-minute timeframe candlesticks and VWAP, can enhance the precision of trade entries and exits on or near these levels. It is crucial to recognize that these levels are not static, and they undergo alterations as market dynamics evolve.
The dashed lines on the chart indicate the reaction levels, serving as additional points of significance. Furthermore, take note of the response at the levels of the High, Low, and Close va
Nifty levels - Oct 08, 2026Nifty support and resistance levels are valuable tools for making informed trading decisions, specifically when combined with the analysis of 5-minute timeframe candlesticks and VWAP. By closely monitoring these levels and observing the price movements within this timeframe, traders can enhance the accuracy of their entry and exit points. It is important to bear in mind that support and resistance levels are not fixed, and they can change over time as market conditions evolve.
The dashed lines
BTCUSDT: Holds the Channel Floor as 88,000$ Remains Within ReachHello everyone, here is my breakdown of the current BTCUSDT setup.
Market Analysis
BTCUSDT previously traded inside an upward channel with a fake breakout before breaking higher and shifting bullish. Price then formed a range and continued higher within a broader upward channel, testing the Resistance Zone near 88,000.
Currently, BTCUSDT is trading below the 88,000 Resistance Zone while holding above the 82,600 Support Zone and the upward channel. The recent rebound from support suggests buy
EURUSD | Bearish Trendline Rejection🔹 EURUSD remains in a clear bearish market structure, with price forming lower highs and lower lows beneath the descending trendline. The recent breakdown below the 1.1400 support area reinforces the bearish price action, while the former support now appears to be acting as resistance. Selling pressure has accelerated toward the 1.1200 region, leaving the 1.1000 liquidity area as an important downside zone to monitor. The overall technical analysis suggests that sellers currently have control wh
BTCUSDT Strengthens After the Range Bounce — 88,000 AwaitsHello traders! Here’s my technical outlook based on the current BTCUSDT (3H) chart structure. BTCUSDT previously traded inside a descending structure before breaking higher and shifting bullish. Price then formed a range near the Buyer Zone, tested higher levels, and bounced from support. Currently, BTCUSDT is trading below the 88,000 Seller Zone while holding above the 85,000 Buyer Zone and the ascending Support Line. The recent bounce from support suggests buyers are preparing for another move
XAGUSD (Silver) : Bearish Retest Setup at Key Support BreakdownExecutive Summary
Silver (XAGUSD) on the 4-hour time frame is breaking down below its recent consolidation floor around the $60.00 region. The price previously established strong support near $62.50 before breaking lower and forming a tight consolidation range between $60.00 and $62.50. The core thesis calls for a breakdown below the consolidation base, followed by a pullback retest into the breakdown zone to trigger a high-probability short trade. A successful continuation to the downside targ
S&P500 INDEX (US500): Important Breakout
US500 broke a major resistance cluster based on the current ATH.
The broken structure is now a strong demand area.
The index will likely continue rising and reach 0.79 level soon.
❤️Please, support my work with like, thank you!❤️
I am part of Trade Nation's Influencer program and receive a monthly fee for using their TradingView charts in my analysis.
S&P 500 ($SPX) 15m Technical MatrixS&P 500 ( SP:SPX ) 15m Technical Matrix: Wedge Exhaustion at ATH & Breakout Below 17-EMA Opens Corrective Pullback Vector to 200-EMA (7,739)
### 🇺🇸 S&P 500 ($SPCFD / SPX) 15-Minute Intraday Technical Matrix (Ref: SPX_2026-10-07_09-13-04.png)
Following a powerful 3-day rally that carried the S&P 500 to new record highs, intraday price action on the 15-minute timeframe is signaling structural exhaustion. The ascending wedge pattern has tightened at the top, leading to a breakdown below the lower
BTC: 254 BTC bid at 83500 vs 149 offered at 85000The book is lopsided to the downside. 254 BTC is resting on the bid at 83500 against 149 BTC offered at 85000 - about 1.7 times more size waiting below than above.
THE BOOK RIGHT NOW
149 BTC of asks at 85000
119 BTC of asks at 84500
spot 84261
254 BTC of bids at 83500
234 BTC of bids at 83000
within 1% of mid the book is 53% bid
CONTEXT
Volume POC at 85562, value area 84275 to 86650
CVD over 4h is +940 BTC
Open interest -0.32% on the hour with price -0.03% - reads as long liq
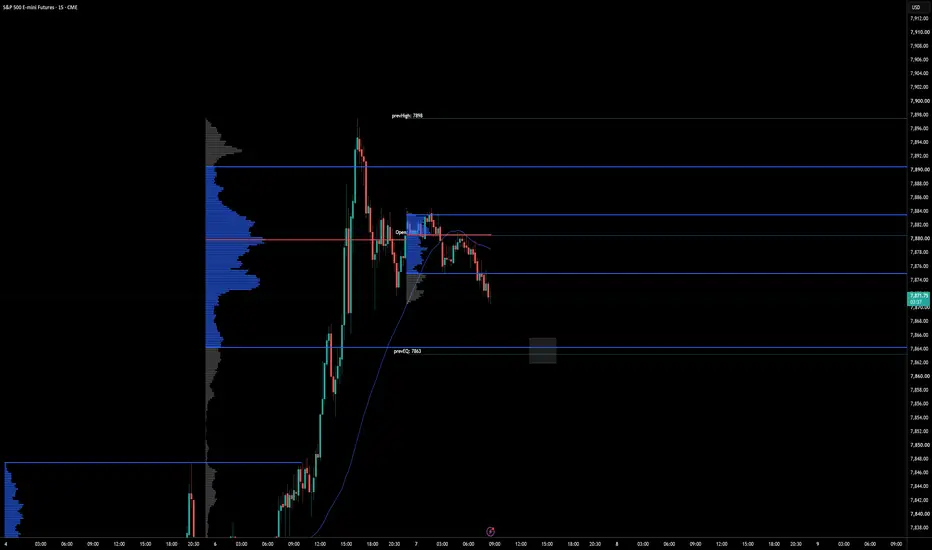
ES Long Setup – Untested pdVAL + pdEQ ConfluenceToday I’m watching the 7864 area for a potential scalp long.
This level marks the pdVAL, which remains untested, with additional confluence from the pdEQ just below at 7863.
That gives us a nice defined zone of interest should price rotate lower into it during today’s session.
As always, this is reaction dependent - if price trades into the 7864–7863 zone, I’ll be monitoring the reaction and looking for confirmation before considering a scalp long.
Key confluence:
- pdVAL — 7864 (untested)
XAUUSD — 4,184 Retest or 4,041 Sweep?
Gold is trading around 4,149, holding just above the H2 support at 4,134. The broader structure remains bearish while price stays below the descending trendline.
Macro News
Gold remains under pressure from a firm U.S. dollar and elevated Treasury yields, with the 10Y and 30Y yields recently reaching multi-decade highs. Meanwhile, October Fed hike expectations have fallen sharply after weak labor data, but markets still price a high probability of another hike in December.
The simple read
4,1