Nifty levels - Oct 08, 2026Nifty support and resistance levels are valuable tools for making informed trading decisions, specifically when combined with the analysis of 5-minute timeframe candlesticks and VWAP. By closely monitoring these levels and observing the price movements within this timeframe, traders can enhance the accuracy of their entry and exit points. It is important to bear in mind that support and resistance levels are not fixed, and they can change over time as market conditions evolve.
The dashed lines
Support and Resistance
BTCUSDT: Holds the Channel Floor as 88,000$ Remains Within ReachHello everyone, here is my breakdown of the current BTCUSDT setup.
Market Analysis
BTCUSDT previously traded inside an upward channel with a fake breakout before breaking higher and shifting bullish. Price then formed a range and continued higher within a broader upward channel, testing the Resistance Zone near 88,000.
Currently, BTCUSDT is trading below the 88,000 Resistance Zone while holding above the 82,600 Support Zone and the upward channel. The recent rebound from support suggests buy
EURUSD | Bearish Trendline Rejection🔹 EURUSD remains in a clear bearish market structure, with price forming lower highs and lower lows beneath the descending trendline. The recent breakdown below the 1.1400 support area reinforces the bearish price action, while the former support now appears to be acting as resistance. Selling pressure has accelerated toward the 1.1200 region, leaving the 1.1000 liquidity area as an important downside zone to monitor. The overall technical analysis suggests that sellers currently have control wh
BTCUSDT Strengthens After the Range Bounce — 88,000 AwaitsHello traders! Here’s my technical outlook based on the current BTCUSDT (3H) chart structure. BTCUSDT previously traded inside a descending structure before breaking higher and shifting bullish. Price then formed a range near the Buyer Zone, tested higher levels, and bounced from support. Currently, BTCUSDT is trading below the 88,000 Seller Zone while holding above the 85,000 Buyer Zone and the ascending Support Line. The recent bounce from support suggests buyers are preparing for another move
XAGUSD (Silver) : Bearish Retest Setup at Key Support BreakdownExecutive Summary
Silver (XAGUSD) on the 4-hour time frame is breaking down below its recent consolidation floor around the $60.00 region. The price previously established strong support near $62.50 before breaking lower and forming a tight consolidation range between $60.00 and $62.50. The core thesis calls for a breakdown below the consolidation base, followed by a pullback retest into the breakdown zone to trigger a high-probability short trade. A successful continuation to the downside targ
S&P500 INDEX (US500): Important Breakout
US500 broke a major resistance cluster based on the current ATH.
The broken structure is now a strong demand area.
The index will likely continue rising and reach 0.79 level soon.
❤️Please, support my work with like, thank you!❤️
I am part of Trade Nation's Influencer program and receive a monthly fee for using their TradingView charts in my analysis.
S&P 500 ($SPX) 15m Technical MatrixS&P 500 ( SP:SPX ) 15m Technical Matrix: Wedge Exhaustion at ATH & Breakout Below 17-EMA Opens Corrective Pullback Vector to 200-EMA (7,739)
### 🇺🇸 S&P 500 ($SPCFD / SPX) 15-Minute Intraday Technical Matrix (Ref: SPX_2026-10-07_09-13-04.png)
Following a powerful 3-day rally that carried the S&P 500 to new record highs, intraday price action on the 15-minute timeframe is signaling structural exhaustion. The ascending wedge pattern has tightened at the top, leading to a breakdown below the lower
BTC: 254 BTC bid at 83500 vs 149 offered at 85000The book is lopsided to the downside. 254 BTC is resting on the bid at 83500 against 149 BTC offered at 85000 - about 1.7 times more size waiting below than above.
THE BOOK RIGHT NOW
149 BTC of asks at 85000
119 BTC of asks at 84500
spot 84261
254 BTC of bids at 83500
234 BTC of bids at 83000
within 1% of mid the book is 53% bid
CONTEXT
Volume POC at 85562, value area 84275 to 86650
CVD over 4h is +940 BTC
Open interest -0.32% on the hour with price -0.03% - reads as long liq
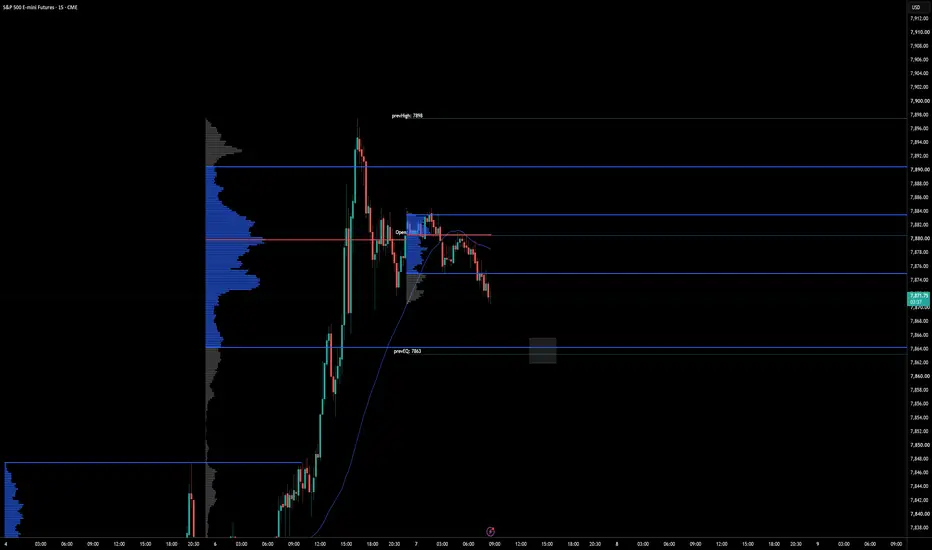
ES Long Setup – Untested pdVAL + pdEQ ConfluenceToday I’m watching the 7864 area for a potential scalp long.
This level marks the pdVAL, which remains untested, with additional confluence from the pdEQ just below at 7863.
That gives us a nice defined zone of interest should price rotate lower into it during today’s session.
As always, this is reaction dependent - if price trades into the 7864–7863 zone, I’ll be monitoring the reaction and looking for confirmation before considering a scalp long.
Key confluence:
- pdVAL — 7864 (untested)
XAUUSD — 4,184 Retest or 4,041 Sweep?
Gold is trading around 4,149, holding just above the H2 support at 4,134. The broader structure remains bearish while price stays below the descending trendline.
Macro News
Gold remains under pressure from a firm U.S. dollar and elevated Treasury yields, with the 10Y and 30Y yields recently reaching multi-decade highs. Meanwhile, October Fed hike expectations have fallen sharply after weak labor data, but markets still price a high probability of another hike in December.
The simple read
4,1
LINK: Positive Headlines, but the Hourly Reversal Remains UnconfChainlink has attracted supportive headlines. According to Bloomingbit, the project welcomed the CFTC’s effort to clarify crypto market regulation, highlighting discussions around oracles and Proof of Reserve. The initiative remains at the consultation stage and does not establish mandatory adoption of Chainlink.
Meanwhile, Barry Silbert’s comments on tokenization and 24/7 trading reinforce the broader narrative around blockchain infrastructure. In my view, this supports interest in Chainlink’
GBPAUD 4H — Double Bottom Setup Targeting 1.9550Hook:
This retracement is landing on the exact level that confirmed the double bottom in the first place — that's not a coincidence worth ignoring.
Market Context:
FX:GBPAUD carved out two nearly identical lows (1.8614 and 1.8633) before reclaiming the neckline and rallying toward 1.900. Price is now pulling back into that same neckline zone before the next leg higher.
Reasoning:
1- Symmetrical double bottom : two lows just 19 pips apart confirms genuine demand at this level, not a ran
XAUUSD: THE GOLDEN POCKET IS LOADEDListen up, traders. If you’re panicking about this pullback, you’re playing checkers while the smart money plays chess.
Look at the 15M chart. We had a strong impulse move up, and now we are testing the Golden Pocket. This isn't a crash; this is a textbook discount phase.
Here is exactly how I’m trading it:
🎯 THE SETUP (LONG BIAS):
We are currently sitting right in the sweet spot between the 0.705 and 0.79 Fibonacci retracement levels (roughly 4133 - 4127). Look at the purple box—price is con
NZD-CHF Free Signal! Sell!
Hello,Traders!
NZDCHF is rejecting from the horizontal supply area after a liquidity sweep and mitigation retest, with distribution supporting bearish continuation toward the marked take-profit level.
------------------
Stop Loss: 0.4685
Take Profit: 0.4662
Entry: 0.4674
Time Frame: 3H
------------------
Sell!
Comment and subscribe to help us grow!
Check out other forecasts below too!
Gold risks another leg lowerGold remains heavily influenced by both the US dollar and front-end US Treasury yields, demonstrating a persistent inverse relationship with both over recent periods.
With the US dollar ripping higher following September’s near-historic surge in two-year Treasury yields, it comes as little surprise to see gold has fallen sharply over the same period.
The price now finds itself squeezed between horizontal support at $4,120 on the downside and downtrend resistance running from the August 24 high
NASDAQ: Correction towards Fair Value Zone & 200 EMA ahead?Description:
On the daily chart of the US100 (NASDAQ), an interesting setup is forming for a potential corrective scenario.
Key Factors of the Analysis:
Bearish RSI Divergence: While price has printed higher highs (dashed red trendline on price), the RSI indicator is displaying lower highs over the same period (dashed red trendline on RSI). This bearish divergence signals fading upside momentum.
Fair Value Zone Target: If the pullback accelerates, a prominent Fair Value Zone around 29,80
GAL (PSX): Support Broken, Short Setup Toward 500/480Ghandhara Automobiles Limited (GAL), Daily Timeframe
GAL sold off sharply from the Aug-Sep highs and spent several sessions consolidating just below the 534-557 support zone. That support has now broken to the downside, which turns the zone into resistance. Price is currently at 526.94.
Trade Setup (Short)
Entry: 534.09
Stop Loss: 557.85 (above the broken support zone)
Target: 483.50 (next demand zone, where the June gap sits)
Risk to Reward: about 1:2.1
Why this setup?
A key support zone h
OGDC Head & Shoulders: Close Below 311 Targets 290/285OGDC is forming a head and shoulders pattern on the daily timeframe.
A daily close below the 311 neckline would confirm the breakdown, with downside targets at 290 and 285.
Levels to watch:
🔻 Neckline: 311 (daily close)
🎯 Targets: 290 / 285
Wait for the confirmed close below the neckline before acting on the pattern.
Not financial advice. Do your own research.
$BTC - Market Update (10/7)CRYPTOCAP:BTC got that lil bounce at 85k yesterday, but sellers capped it again.
Still chopping inside this symmetrical triangle. If price fails to get back inside the triangle, that would invalidate the setup.
Waiting for the apex to see if we finally break into the 90s or roll back into the 80s here.