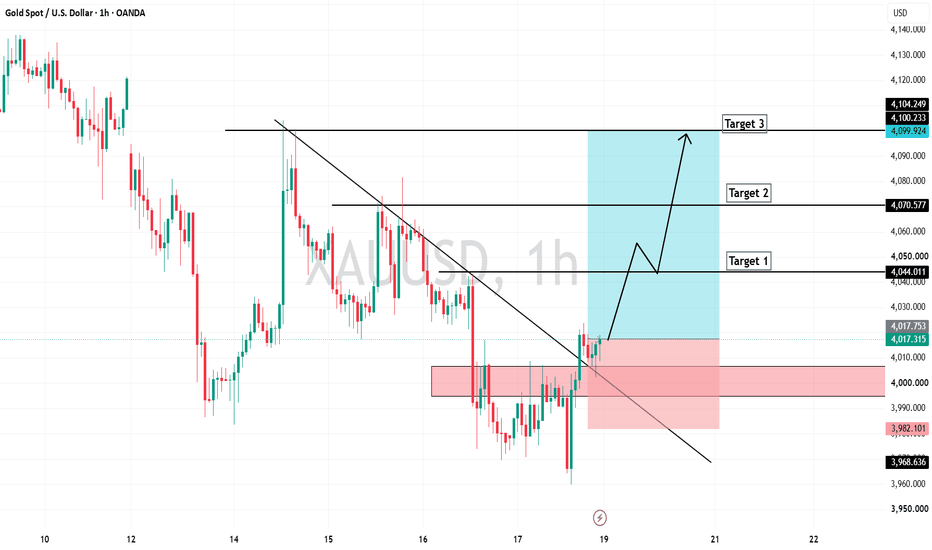
XAUUSD — Is 4,034 the Next Trap?Gold is trying to recover from the lower support area, but the bigger picture is still not fully bullish.
Price is trading around 4,010 - 4,020 after reacting from the 3,958 support zone.
At first look, this bounce may feel strong.
But when we zoom out, gold is still moving inside a descending channel.
And now price is getting close to the first important sell reaction zone near 4,034.
This is where traders need to slow down.
The simple read
Gold is still under medium-term bearish pressure while price stays inside the descending channel.
The current bounce is reaching the Fibo reaction area around 4,011 and moving toward the OB sell scalping zone at 4,034.
If sellers defend 4,034, gold may rotate lower again toward 3,958.
If 3,958 breaks, the next downside levels are 3,885 and 3,758.
If gold breaks and holds above 4,034, the next recovery target becomes 4,097.
But the stronger bullish view only becomes cleaner if price can reclaim 4,097 and escape the channel pressure.
Key price zones
Current price area: 4,010 - 4,020
First sell reaction zone: 4,034
Main resistance / sell zone: 4,097
Liquidity sell zone: 4,184
Main support zone: 3,958
Next lower support: 3,885
Deep support zone: 3,758
Bearish pressure weakens above: 4,034
Recovery becomes stronger above: 4,097
Trading plan
📉 Rejection scenario
If gold reaches 4,034 and shows rejection:
Sellers may try to push price back toward 3,958.
This keeps gold inside the descending channel.
I do not want to sell randomly in the middle.
The cleaner sell idea needs rejection confirmation from 4,034 or 4,097.
📈 Short recovery scenario
If gold breaks and holds above 4,034:
A short-term recovery may continue toward 4,097.
This would show that buyers are trying to fight back.
But this is still only a recovery inside a larger bearish channel unless 4,097 is reclaimed clearly.
No clean hold above 4,034 = no strong buy view.
📉 Deeper downside scenario
If 3,958 breaks clearly:
Gold may continue toward 3,885.
If sellers remain strong, the deeper support zone around 3,758 becomes the next area to watch.
This does not mean chasing the sell late.
It means waiting for clean confirmation and reaction around the next support zones.
Tiara’s View
A bounce from support is not always a reversal.
Sometimes it is only the market returning to resistance before choosing the next move.
For today, 4,034 is the first trap zone.
4,097 is the stronger resistance.
3,958 is the support that buyers need to protect.
Main view:
Gold is recovering short-term, but still inside a descending channel.
Below 4,034, sellers still have pressure.
Above 4,034, price may try to reach 4,097.
Below 3,958, the downside structure becomes heavier again.
Reaction first.
Confirmation second.
Trade last.
No confirmation = no trade.
Do you think gold will break 4,034, or reject from this trap zone first?  Short
Short
EURUSD: Rebounds from Support – Can Buyers Break the Trendline?Hello everyone, here is my breakdown of the current EURUSD setup.
Market Analysis
EURUSD previously traded inside an upward channel before breaking below support, confirming a bearish shift in market structure. Price then consolidated inside a broad range before breaking lower once again, extending the decline toward the 1.1410 Support Zone.
Currently, EURUSD is trading above the 1.1410 Support Zone while remaining below the 1.1470 Resistance Zone and the long-term descending trendline. Buyers are attempting to build a recovery from support, but the descending trendline continues to cap the upside.
My Scenario & Strategy
As long as EURUSD holds above the 1.1410 Support Zone and continues respecting the rising triangle support line, a bullish recovery remains possible. A breakout above the descending trendline could push price toward the 1.1470 Resistance Zone (TP1).
However, if EURUSD breaks below the 1.1410 Support Zone, the bullish outlook would weaken, and sellers could regain control with another move lower.
That’s the setup I’m tracking. Thank you for your attention, and always manage your risk. XAUUSD — Sell the 4,020–4,030 Retest
Fundamental Analysis
Gold remains sensitive to USD momentum, Treasury yields, and shifts in Fed rate expectations. Softer U.S. data could support a short-term recovery, but renewed dollar strength may keep the broader pressure tilted to the downside.
Technical Analysis
On the 1H chart, XAUUSD is trading near 4,004.55 below the marked 4,020–4,030 resistance zone. This area previously acted as support and may now become a sell zone after the breakdown. If price recovers into this region and fails to reclaim it, bearish continuation could target the strong support at 3,982.80 before extending toward the descending trendline near 3,925–3,930.
Important Key Levels
Current price: 4,004.55
Main sell zone: 4,020–4,030
Short-term support: 3,982.80
Short-term resistance: 4,020–4,030
Liquidity area: 4,090–4,108
Main target: 3,925–3,930
Invalidation: above 4,044.50
Trading Scenario
Main Sell Setup
Entry: 4,020–4,030
Stop Loss: 4,044.50
Take Profit 1: 3,982.80
Take Profit 2: 3,960
Take Profit 3: 3,925.80
Sell Condition
Wait for price to retest the 4,020–4,030 zone and show bearish rejection. A long upper wick, bearish engulfing candle, failed reclaim, or 1H close back below the zone may confirm seller pressure. If price breaks and holds above 4,044.50, the sell setup is no longer valid.
Overall View
The main bias remains bearish while XAUUSD stays below the former support zone and continues to respect the broader descending structure. The preferred plan is to wait for a recovery into 4,020–4,030 rather than chase price near current levels, with 3,982.80 as the first reaction area and 3,925.80 as the main downside target.
Do you also see 4,020–4,030 as the key sell zone, or are you waiting for a deeper liquidity sweep first? Short 
XAUUSD — Can 4,030 Stop Gold Again?Gold is trying to recover, but the chart is still not showing a clean bullish shift yet.
Price is trading around 4,010 after bouncing from the lower area, but the bigger structure remains inside a descending channel.
This is why I do not want to chase the bounce too early.
A bounce can look strong.
But if it happens below resistance, it can also become a trap.
The simple read
Gold is now approaching the 4,030 area.
This zone is important because it is the OB sell scalping area and also lines up with the current Fibonacci reaction structure.
If gold cannot break and hold above 4,030, sellers may still have control.
The first support to watch is 4,002.
If 4,002 breaks, price may continue toward 3,970.
And if 3,970 fails, the deeper target on the chart is 3,909.
The stronger resistance remains higher at 4,081.
So for me, 4,030 is the first test.
4,081 is the bigger test.
Key price zones
Current price area: 4,005 - 4,015
First reaction zone: 4,002
OB sell scalping zone: 4,030
Short-term resistance: 4,081
OB buy scalping / support zone: 3,970
Fibo extension target: 3,909
Bearish pressure weakens above: 4,030
Recovery becomes stronger above: 4,081
Trading plan
📉 If gold rejects from 4,030
The bounce may fail.
Sellers may try to push price back toward 4,002.
If 4,002 breaks, 3,970 becomes the next important support.
Below 3,970, the chart opens space toward 3,909.
I prefer waiting for rejection confirmation instead of selling blindly.
📈 If gold breaks above 4,030
A short-term recovery may continue.
The next upside area to watch is 4,081.
But this is still not a full bullish reversal unless gold can break and hold above 4,081 with strength.
No clean hold above 4,030 = no strong buy view.
📈 If gold pulls back to 3,970
This becomes the key support reaction zone.
A clean bullish reaction from 3,970 may create another recovery attempt.
But if 3,970 breaks clearly, I will watch 3,909 as the deeper reaction zone.
No reaction from support = no buy.
Tiara’s View
The market is giving a bounce, but not yet a full confirmation.
For today, the cleanest question is simple:
Can buyers push gold above 4,030?
If yes, the recovery may continue toward 4,081.
If no, the bounce may turn into another lower high inside the descending channel.
Main view:
Gold remains cautious below 4,030.
4,030 is the first resistance test.
4,002 and 3,970 are the nearest support zones.
3,909 is the deeper downside target if sellers keep control.
Reaction first.
Confirmation second.
Trade last.
No confirmation = no trade.
Do you think gold can break 4,030, or will sellers defend this zone again? Short 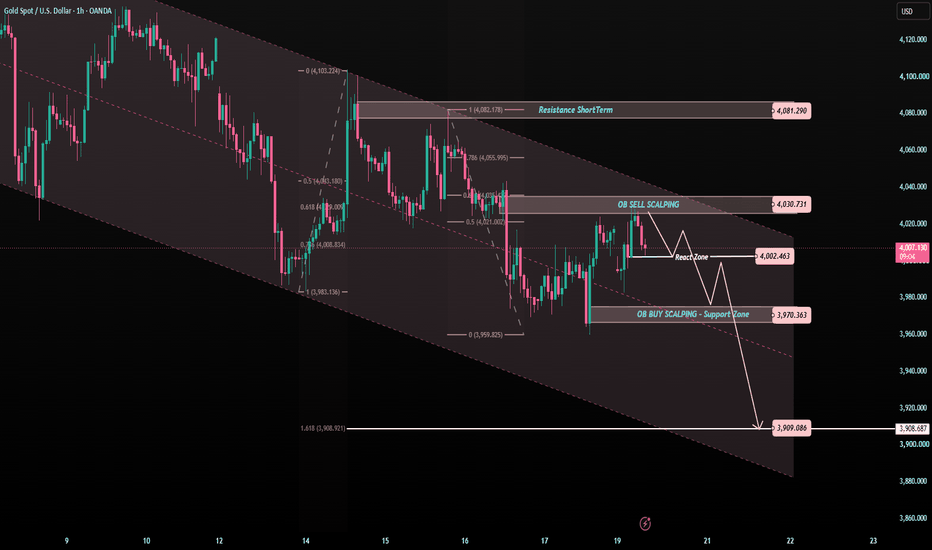
XAUUSD: Wave 5 Downside Remains Active
Gold is still trading under short-term bearish pressure after failing to hold above the recovery trendline. From Kelly’s view, the current structure suggests that price may be preparing for another downside continuation, with wave 5 still open towards the lower Fibonacci target zones.
The key idea is simple: gold may retest resistance first, but the bearish structure remains valid while price stays below the sell zone.
⟡ Market structure
The chart shows gold attempted to recover from the lower area, but the rebound lost strength near the 4,020–4,030 region. Price is now trading around 4,004 and reacting below the broken uptrend line.
This is important because the trendline that previously supported the recovery is now acting as a retest area. If gold cannot reclaim this line with strength, the current bounce may only be a correction before the next bearish leg continues.
The nearest sell-test area is around 4,005–4,012, while the stronger sell zone wave 4 sits near 4,020–4,030. As long as these zones hold, sellers still have the technical advantage.
➤ Key levels
◌ 4,005–4,012: sell-test trendline zone
◌ 4,020–4,030: sell zone wave 4 and main resistance
◌ 4,004: current price reaction area
◌ 3,982: first buy scalping reaction level
◌ 3,959: next support checkpoint
◌ 3,938–3,945: Fibonacci 1.618 target area
◌ 3,855–3,865: possible wave 5 completion zone
◌ Above 4,030: area where the bearish setup starts to weaken
⌁ Elliott Wave view
From an Elliott Wave perspective, gold appears to be developing the final part of a bearish 5-wave sequence.
Wave 1 started the downside move after the recovery failed.
Wave 2 created a short rebound but could not break the structure.
Wave 3 pushed price lower with stronger selling pressure.
Wave 4 is now likely forming as a retest into the trendline and sell zone.
If this resistance holds, wave 5 may continue towards 3,938–3,945 first, then 3,855–3,865 if momentum expands.
This is why Kelly would not treat the current bounce as a bullish reversal yet. The market is still below the key resistance and the Elliott structure still supports one more downside leg.
▸ Trading scenario
Preferred scenario: wait for price to retest the sell-test trendline or the sell zone wave 4 and show bearish confirmation.
Sell zone: 4,005–4,030 if rejection appears
Stop loss: above the confirmed rejection high or above 4,030
Take profit 1: 3,982
Take profit 2: 3,959
Take profit 3: 3,938–3,945
Take profit 4: 3,855–3,865 if wave 5 extends strongly
Alternative scenario: if gold breaks above 4,030 and holds with strong acceptance, the bearish wave 5 setup weakens. In that case, price may move into a larger corrective recovery before the next direction becomes clear.
⌁ Kelly’s view
For Kelly, this is still a sell-the-retest structure. Gold has not fully reversed yet, and the current reaction is happening under the broken trendline and wave 4 resistance.
The cleaner plan is to wait for confirmation near resistance, not chase price while it is already close to support.
Gold remains vulnerable below the sell zone.
If sellers defend 4,005–4,030, wave 5 may continue towards the Fibonacci targets below.
Share your view below.
Short 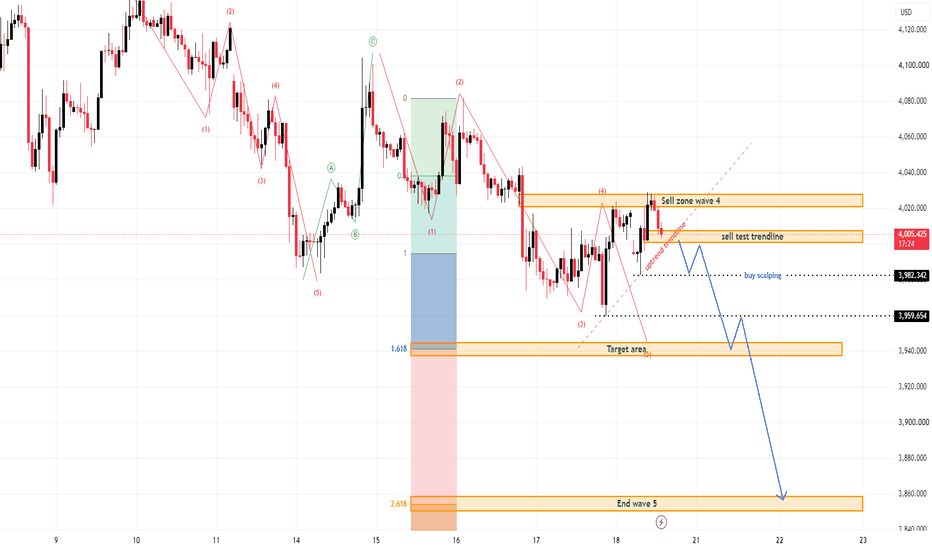
62.5k–65k: Don’t Let This Range Fool YouGood morning, traders ☀️🌴
On Friday, when Bitcoin was trading around 62,500, I said that “I don’t expect the correction to continue toward 60,800 and 60,000,” and also noted that “if Bitcoin manages to hold the current levels during the U.S. session, I expect another attempt to break 65k in the very near term.”
🎯 That is exactly what we saw on the chart: a move to 64,918 on Saturday, followed by a push to 65,050 during today’s Asian session.
✅ Those targets have now been reached, so let’s focus on the next ones.
🦬🚀 If Bitcoin breaks above 65k and secures a convincing close above the level, I expect the rally to accelerate toward 67,600.
I’ve mentioned this level many times before, but repetition is the key to success😵💫💰
“67,600 is the next major horizontal resistance, originally formed in February–March 2026 and confirmed once again in June.”
🐻🧨 The bearish scenario, however, remains unchanged.
If the correction regains momentum and Bitcoin starts trading below the 4H EMA 200 (currently around 63,850), the key support levels remain:
• 62,500 – Major support where Bitcoin has been consolidating since early June.
• 60,800 – Local horizontal support.
• 60,000 – Strong horizontal support.
One more thing I’d like to add.
Don’t let this beautiful 62,500–64,890 range, with its almost perfect reactions at both boundaries, lull you into a false sense of confidence. Despite the clean rejections from the upper boundary, price can easily bounce from the 4H EMA 200 and quickly continue toward 67,600.
For that reason, I strongly discourage blindly shorting the top of the range or longing the bottom. ❗️Consolidation ranges like this are often observation zones before a larger move unfolds—not trading zones❗️
Peace, everyone 🌄
⚠️ Disclaimer:
All information shared on this channel is for educational and informational purposes only and is not investment advice. The author is not responsible for your trading decisions. Always manage your risks and make decisions independently. MASON XAUUSD – Key Support And Resistance Setup
XAUUSD is trading around 4,010 after recovering from the lower support area, but price is still moving below the main descending trendline. The short-term reaction shows buyers are defending the support zone, but the broader structure still needs confirmation before a stronger bullish move can be trusted.
The priority plan is to trade from strong support and resistance zones, with sell pressure still favoured if gold rejects from the upper Fibonacci resistance areas.
Technical View
Gold is currently trading below the descending trendline, which means the market is still under short-term bearish pressure. Even though price has reacted from the lower area, the recovery remains corrective while gold stays below the trendline and key resistance zones.
The 3,991–3,997 area is the main buy zone on the chart. This zone aligns with the Fibonacci 50 reaction area and sits above the 3,982 support. If gold pulls back into this area and holds, a short-term bullish reaction may appear.
However, the upside still has two important resistance zones. The first one is the 4,051–4,055 sell scalping FVG zone. This area may create the first bearish reaction if price recovers from the buy zone.
The stronger resistance is around 4,078–4,085, marked as the sell zone and Fibonacci 50 area. This zone is important because it aligns with the previous structure, Fibonacci resistance, and the descending trendline region. If gold reaches this zone and rejects, it may confirm another lower high before price turns down again.
The 3,982 level is the key support. If gold loses this level, the bullish reaction becomes weak, and price may move back toward the stronger support range around 3,960–3,970.
Key Zones
Current price: 4,010
Main buy zone: 3,991–3,997
Key support: 3,982
Strong support: 3,960–3,970
Sell scalping FVG zone: 4,051–4,055
Major sell zone: 4,078–4,085
Descending trendline resistance: 4,055–4,085
Invalidation for sell view: above 4,085
Trading Plan
Sell Priority: 4,051–4,055
Condition: wait for bearish rejection, failed breakout above the FVG zone, or price staying below the descending trendline.
SL: above 4,085
TP1: 3,991–3,997
TP2: 3,982
TP3: 3,960–3,970
Alternative Sell Scenario
If gold pushes higher into 4,078–4,085, wait for a clear bearish rejection from this major resistance zone before looking for sell continuation. This would be the stronger resistance-based sell setup.
SL: above 4,095
TP1: 4,051–4,055
TP2: 3,991–3,997
TP3: 3,982
Buy View
Buy is possible only as a short-term reaction from the 3,991–3,997 zone or near 3,982 support. The condition is clear bullish rejection, price holding above support, and a lower-timeframe higher low formation.
Buy Zone: 3,991–3,997
SL: below 3,982
TP1: 4,051–4,055
TP2: 4,078–4,085
Final View
Overall, gold is reacting from support, but the market has not broken the descending trendline yet. The cleaner plan is to wait for price to reach the strong decision zones. A reaction from 3,991–3,997 may support a short-term buy, while rejection from 4,051–4,055 or 4,078–4,085 keeps the bearish structure active.
Will gold hold the 3,991–3,997 support zone and recover, or reject from resistance and return toward 3,982?
Long 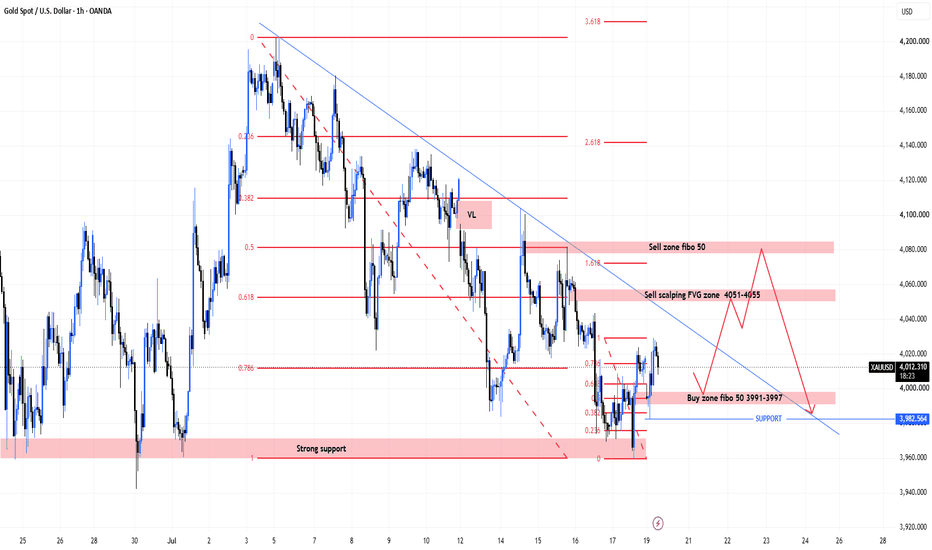
 Short
Short
 Short
Short
Gold achieved a resounding victory this week.Gold Price Analysis for Next Monday: Looking at the current market, on the weekly chart, gold's overall trend is weak, with consecutive weekly candlesticks closing lower. The price is under pressure below all moving averages, which are turning downwards and forming strong resistance. Each small rebound lacks buying support, and pullbacks after rallies have become the norm. Key support levels have been breached one after another, and there are currently no signs of a bottom on the weekly chart. The overall downtrend is established, and there is still room for further decline. The resistance level to watch is 4080, and the support level is 3850. On the daily chart, the trend continues to weaken, with the price firmly under pressure below the 5, 10, and 20-day moving averages. The bearish alignment of these moving averages forms layers of resistance, and the Bollinger Bands are widening downwards, with the price closely following the lower band, indicating a clear downtrend. The daily chart clearly shows a bearish trend, and the technical pressure is significant. A strong reversal is unlikely in the short term, and the overall trend is expected to remain weak and volatile downwards. The resistance level to watch is 4020-4050.
Gold Technical Analysis: On the 4-hour chart, the price is consolidating within a range, lacking sustained upward or downward momentum. The price is fluctuating between support and resistance levels, encountering resistance at short-term moving averages and falling back, while finding support near lower levels with some buying. Neither bulls nor bears have established a clear dominant position. Moving averages are flattening, Bollinger Bands are narrowing, and the trading range is continuously compressing. The MACD is crossing below the zero line, indicating alternating bullish and bearish momentum without a clear directional signal. The key resistance level to watch is 4050, while short-term support is at 3960, with a crucial support level at 3940. A break below 3940 would open up further downside potential. In summary, the recommended strategy for gold trading next Monday is to primarily sell on rallies and secondarily buy on dips. The key resistance level to watch in the short term is 4020-4050, while the key support level is 3960-3940. Please keep up with the pace of the market. Short 
LINKUSD Triple Resistance Above 2023 Breakout SupportChainlink is trading just above a major breakout level from the long consolidation structure that began in 2023. That former breakout area is now acting as an important support pivot, while price is also pressing into a significant overhead resistance cluster.
The key issue here is the three-trendline resistance confluence directly above current price. LINK is currently below all three resistance lines, which keeps this area as the main decision zone.
At the same time, the daily chart is showing bullish RSI divergence, which suggests downside momentum has weakened. RSI is also currently above its average, keeping the bullish recovery attempt alive for now.
Bullish scenario
For the bullish thesis to strengthen, I would want to see:
A breakout above the full three-trendline resistance zone
Two daily closes above that entire zone
Ideally, a retest of the broken resistance as new support before continuation
If that breakout is confirmed and support holds on the retest, the next major upside objective would be a move toward the long-term macro breakdown retest shown above.
Alternate bullish pathway
Even if price gets rejected initially, that would not automatically invalidate the bullish case.
A controlled rejection and pullback could allow LINK to build a potential inverse head & shoulders structure, which may create a second breakout attempt later. I am not treating that pattern as confirmed now, but it is a structure worth monitoring if price pulls back constructively rather than breaking down impulsively.
Bearish scenario
If price remains rejected at the resistance confluence and RSI falls back below its moving average, the current bullish divergence thesis would weaken.
In that case, the next downside support areas I would watch are near:
5.75
4.94
Current takeaway
This is a wait-for-confirmation setup.
The market is sitting between an important breakout support and a major overhead resistance cluster. Bulls need to prove strength with two daily closes above the full confluence zone. Until that happens, this remains a conditional setup rather than a confirmed breakout.
Educational analysis only, not financial advice. Short 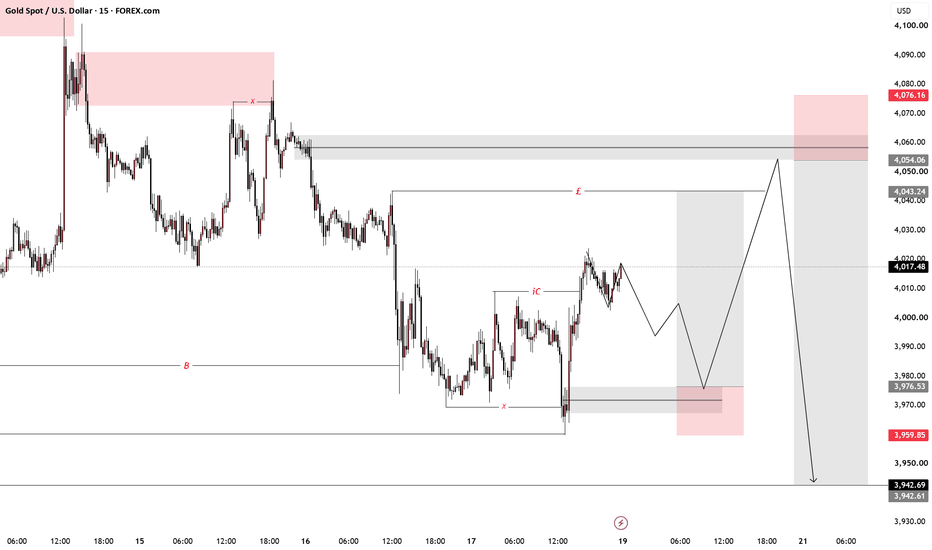
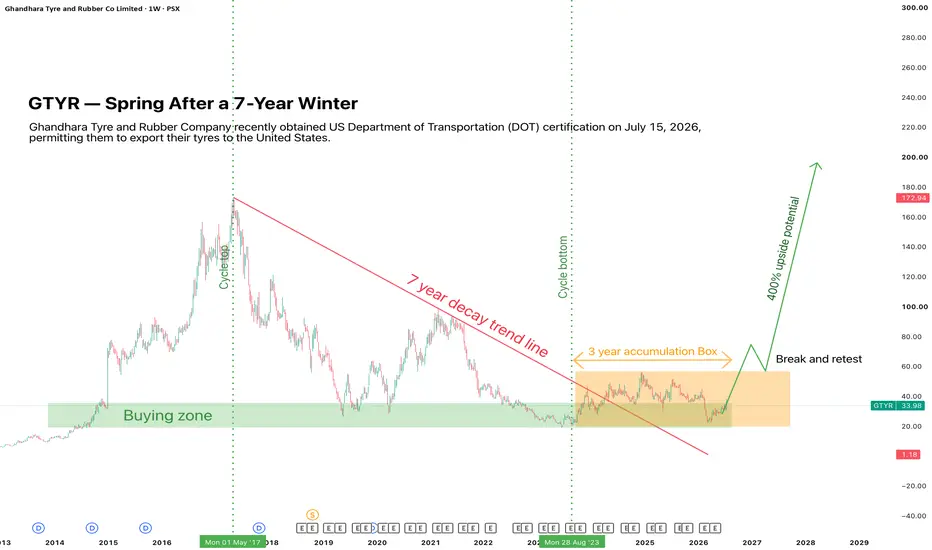
GTYR — Spring After a Seven-Year Winter: Long-Term Accumulation Ghandhara Tyre and Rubber Company Limited has spent approximately seven years declining from its previous major cycle peak. The prolonged downtrend has now been broken, while price continues to stabilize inside a broad three-year accumulation structure.
Significant fundamental catalyst
On July 15, 2026, GTYR announced that it had obtained certification from the United States Department of Transportation, confirming compliance with applicable US vehicle-safety standards and enabling the company to export tyres to the United States. This development may support export diversification and access to a substantially larger international market.
Technical Structure
The weekly chart shows three important developments:
• The seven-year descending trendline has been broken.
• Price has repeatedly attracted demand within the approximately PKR 20–35 buying zone.
• A multi-year accumulation range is developing below the PKR 55–60 resistance area.
The recent recovery may represent the early stage of a structural transition from long-term accumulation into a potential markup phase.
Bullish Confirmation
The bullish thesis would gain strength if GTYR:
• Produces a sustained weekly close above PKR 55–60
• Retests the breakout area successfully as support
• Develops a sequence of higher highs and higher lows
• Breaks resistance with expanding volume
A confirmed breakout could initially expose PKR 75–90, followed by PKR 115–125. Under a full long-term re-rating scenario, the previous cycle-high region around PKR 165–175 could eventually become relevant.
Risk and Invalidation
The projected 400% upside represents a long-term potential scenario, not an immediate or guaranteed target.
Failure to break the accumulation ceiling may keep GTYR range-bound. The setup would weaken if price loses the PKR 25–30 area on a sustained weekly closing basis, while a decisive breakdown below the long-term buying zone would invalidate the present accumulation thesis.
Conclusion
After a seven-year structural decline and nearly three years of base-building, GTYR may be entering an important transition period. The break of the long-term downtrend, combined with the new US export certification, creates a constructive long-term narrative.
However, confirmation still requires a decisive breakout and successful retest of the accumulation range. Until then, this remains a developing bullish thesis rather than a confirmed expansion.
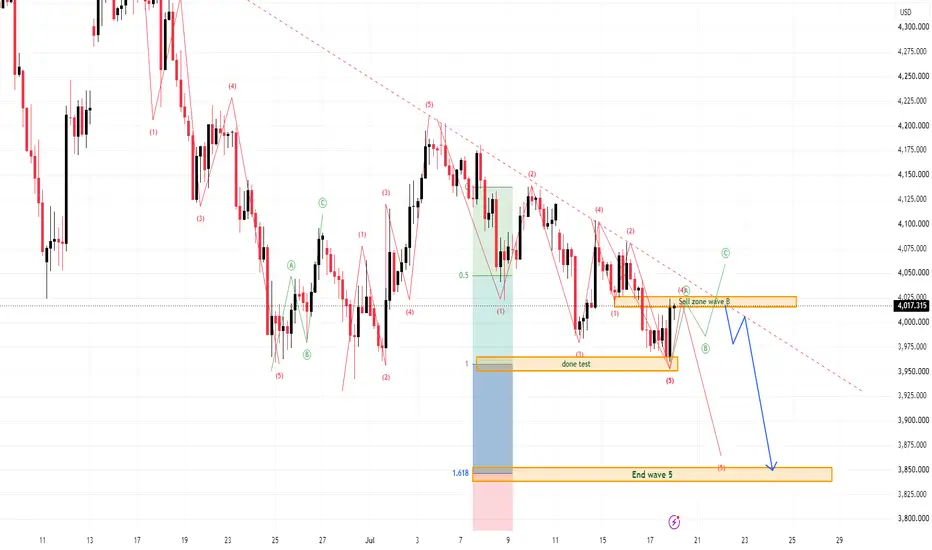
This analysis is for educational purposes only and does not constitute financial advice. XAUUSD: Weekly Downside Still Targets the Final Wave 5 Zone
Gold is still trading inside a broader bearish structure, and the weekly outlook continues to favour downside continuation. From Kelly’s view, the latest recovery looks more like a corrective rebound into resistance, while the main Elliott structure still suggests that wave 5 may extend lower.
The key idea is simple: as long as gold remains below the descending trendline and the sell wave B zone, the bearish weekly scenario stays active.
⟡ Market structure
The chart shows gold has been respecting a clear descending trendline, with repeated lower highs forming across the structure. Each recovery attempt has been capped under resistance, showing that buyers still lack strong control.
Price recently tested the lower support around 3,955–3,970 and bounced slightly, but the rebound is still weak. The nearest sell area is around 4,017–4,025, where the chart marks the sell wave B zone.
If gold retests this zone and fails to break above it, sellers may continue pushing price lower towards the final Elliott wave target near 3,845–3,855.
➤ Key levels
◌ 3,955–3,970: recent low and done test area
◌ 4,017–4,025: sell wave B zone and short-term resistance
◌ 4,050–4,075: higher resistance if the rebound expands
◌ 3,845–3,855: final wave 5 target area
◌ Above 4,075: area where the bearish weekly setup starts to weaken
⌁ Elliott Wave view
From an Elliott Wave perspective, gold appears to be developing the final bearish phase of a larger 5-wave decline.
Wave 1 started from the upper structure.
Wave 2 formed a corrective rebound but failed below trendline resistance.
Wave 3 pushed price lower with stronger bearish pressure.
Wave 4 may now be forming as a small recovery into the sell wave B zone.
If this resistance holds, wave 5 may continue lower towards the 1.618 Fibonacci extension area near 3,845–3,855.
This is why Kelly would not treat the current bounce as a full reversal yet. The market is still below the descending trendline, and the structure continues to favour sell reactions from resistance.
▸ Trading scenario
Preferred scenario: wait for gold to retest the 4,017–4,025 sell zone and show bearish confirmation.
Sell zone: 4,017–4,025 if rejection appears
Stop loss: above the confirmed rejection high or above 4,075
Take profit 1: 3,955–3,970
Take profit 2: 3,900
Take profit 3: 3,845–3,855
Alternative scenario: if gold breaks above 4,075 and holds with strong acceptance, the bearish wave 5 setup weakens. In that case, the market may shift into a larger corrective recovery before the next weekly direction becomes clear.
⌁ Kelly’s view
For Kelly, the weekly structure still favours selling the rebound. Gold has reacted from support, but the bounce remains corrective while price stays below the sell wave B zone and the descending trendline.
The cleaner plan is not to chase the low. Wait for price to retest resistance, then watch whether sellers defend the structure.
Gold may still have one more bearish leg ahead.
If the sell zone holds, the final wave 5 target remains open for next week.
Share your view below.
Short 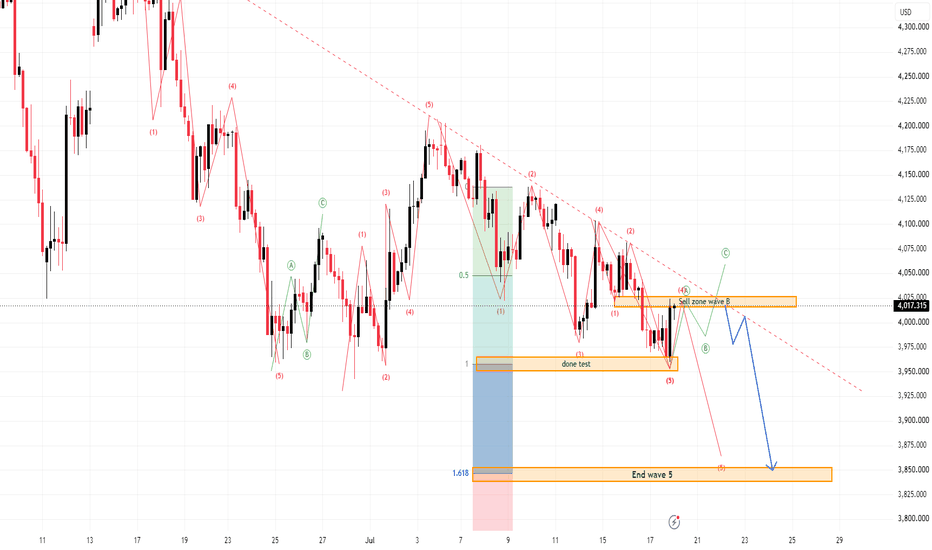
How Will Gold React After the Major Economic News?Market Outlook
Trend
* The medium-term trend remains bearish, with price continuing to trade within a descending channel and still unable to break the Lower High market structure.
* Price is currently reacting from the 3,963 support zone, but it must break above the descending trendline to confirm a bullish reversal.
Resistance Levels
🔵 4,095 – Immediate resistance, aligned with the descending trendline and a key supply zone.
🔵 4,200 – Major resistance and the next upside target if a successful breakout occurs.
* An H4 candle close above 4,095 would confirm a breakout from the descending channel and open the door for further gains toward 4,200.
* If price is rejected at this level, the bearish trend is likely to resume.
Support Levels
🟢 3,963 – Immediate support and a key demand zone currently supporting price.
🟢 3,850 – Strong support and the next downside target if the current support is broken.
* Holding above 3,963 keeps the short-term recovery scenario intact.
* An H4 candle close below 3,963 would confirm a bearish breakout and increase the probability of a decline toward 3,850.
⸻
Trading Scenarios
📈 Bullish Scenario: Price holds above 3,963 and breaks above 4,095, opening the way toward 4,200.
📉 Bearish Scenario: An H4 candle closes below 3,963, targeting 3,850. Alternatively, if price rallies to 4,095 but is rejected, the preferred strategy remains to sell in line with the prevailing downtrend. Short 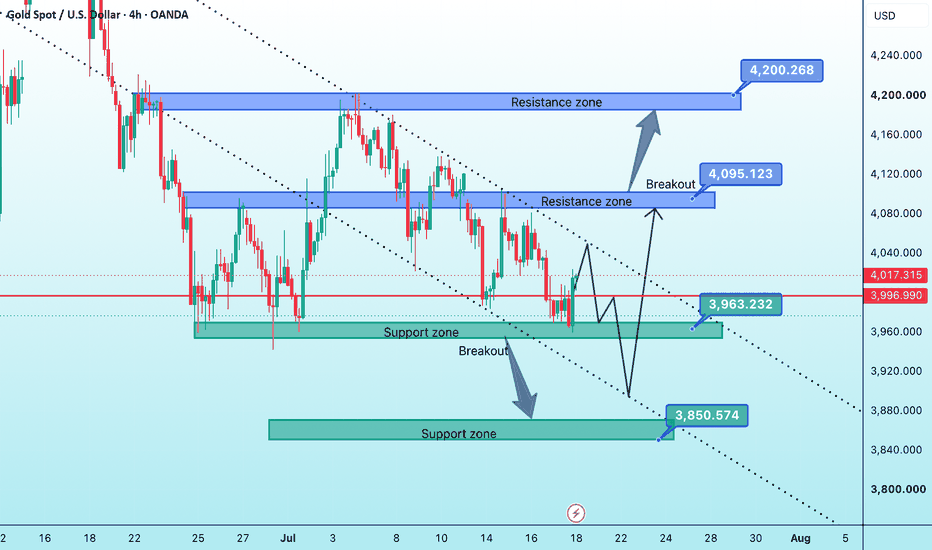
Long