Trend Lines
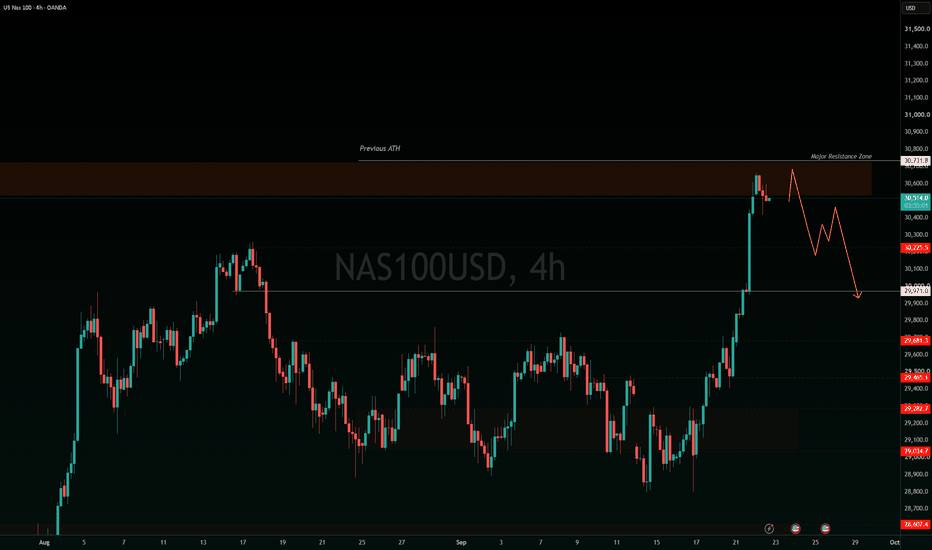
USNAS100 | ATH in Sight After a 650-Pip Rally!
NASDAQ has extended its bullish leg exactly as projected, rallying around 650 pips / 2.3% from our previous 29970 pivot and reaching the 30550 area.
Technically
The bullish momentum could extend toward the 30730 all-time high, where the market may face strong selling pressure and potentially begin a bearish correction.
A confirmed move and stability below 30520 would strengthen the bearish scenario toward 30275, followed by 29970.
On the other hand, a confirmed breakout above the 30730 ATH
EURUSD: Rebounds From 1.1430 Support — 1.1500 In FocusHello everyone, here is my breakdown of the current EURUSD setup.
Market Analysis
EURUSD previously traded inside a range before breaking lower and shifting into a corrective structure. Price then tested the Support Zone multiple times with breakouts before rebounding.
Currently, EURUSD is trading below the 1.1500 Resistance Zone while holding above the 1.1430 Support Zone. The recent rebound from support suggests buyers may attempt another move toward resistance.
My Scenario & Strategy
As
XAUUSD: Buyers Look to Extend the Rebound Toward 4,430$Hello everyone, here is my breakdown of the current XAUUSD setup.
Market Analysis
XAUUSD previously traded inside a range before breaking higher and shifting bullish. Price then formed a triangle structure with multiple breakouts before testing the Resistance Zone.
Currently, XAUUSD is trading below the 4,430 Resistance Zone while holding above the 4,310 Support Zone and the ascending Trend Line. The recent rebound from support suggests buyers may attempt another move toward resistance.
My
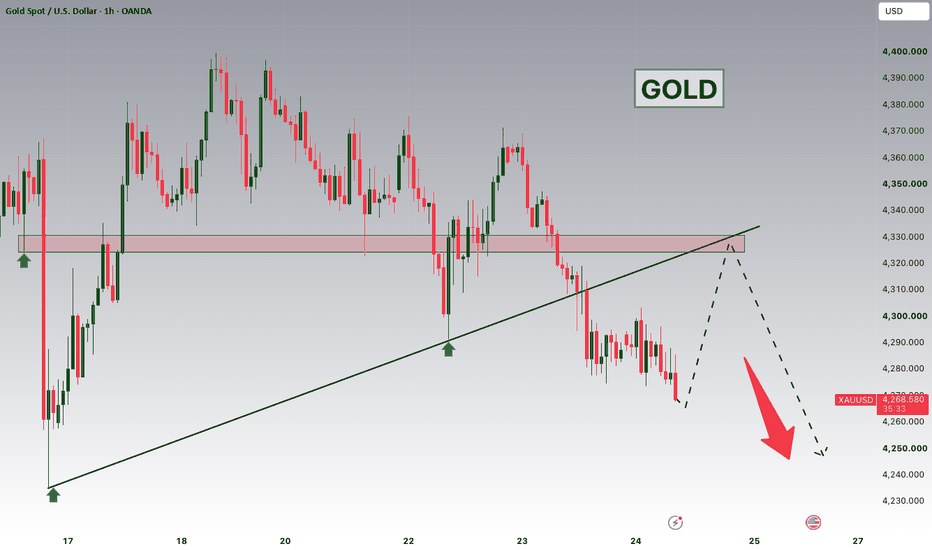
GOLD Breakout and Potential Retrace!Hey Traders, in today's trading session we are monitoring XAUUSD for a selling opportunity around 4,325 zone, Gold was trading in an uptrend and successfully managed to break it out. Currently is in a correction phase in which it is approaching the retrace area at 4,325 support and resistance area.
Trade safe, Joe.
Outlook for GOLD trends in the coming month
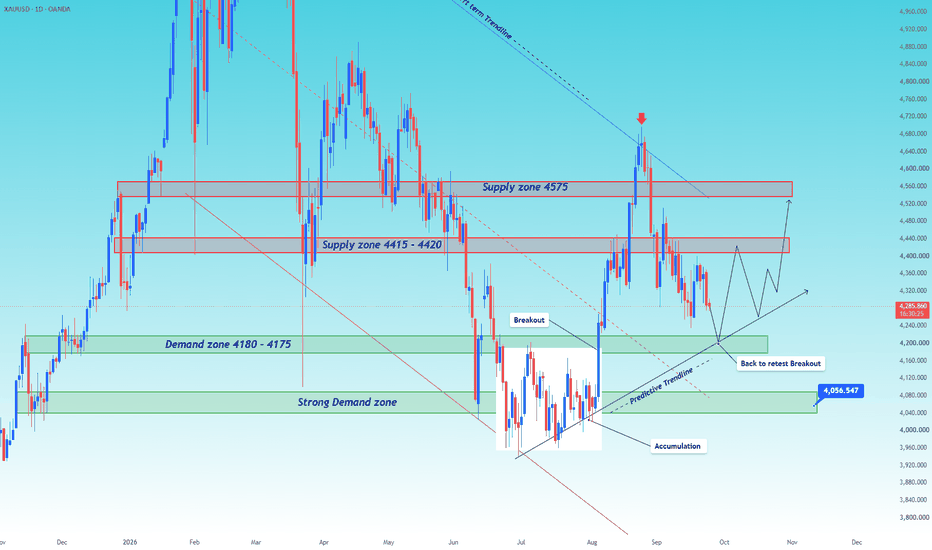
⏺ The market remains in a recovery phase, but price is still moving closely along the short-term descending trendline. At this stage, the market may need to accumulate and build additional liquidity before gaining enough momentum to break above this trendline and confirm a stronger bullish continuation.
⏺ In the short term, price may experience another correction toward the 4295 - 4290 Demand Zone, with the possibility of a deeper liquidity sweep around 4280 before buyers regain control. If th
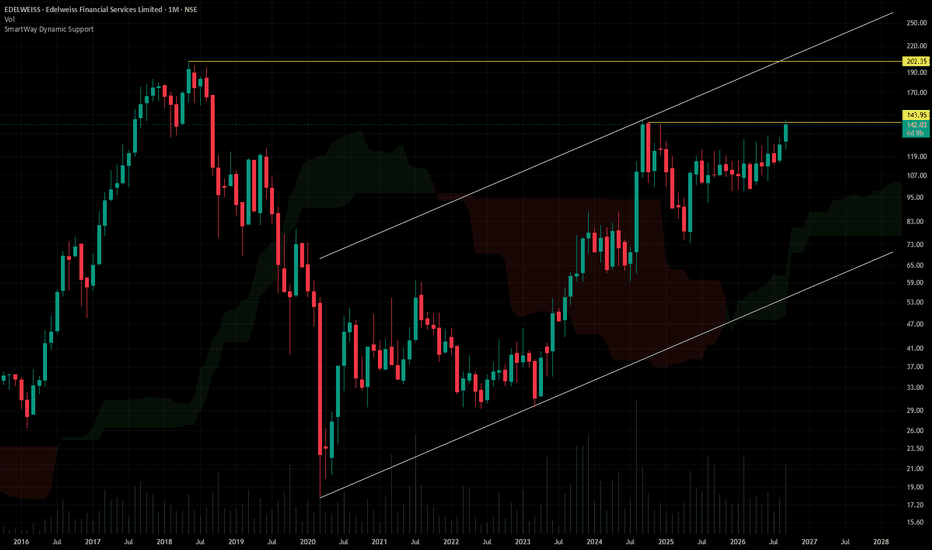
EDELWISSE## Edelweiss Financial Services Ltd. (CMP ₹143.00, NSE: EDELWEISS)
**The SmartWay Research Desk | 24 September 2026**
A Mumbai‑based diversified financial services company, incorporated in 1995. Edelweiss Financial Services operates across **credit, asset management, wealth management, insurance, and advisory businesses**, serving retail, corporate, and institutional clients.
**Promoter Holding (Jun 2026):** **Rashesh Shah & Associates — \~32.4% stake (no pledges)**
### FY22–FY26 Snapshot
-
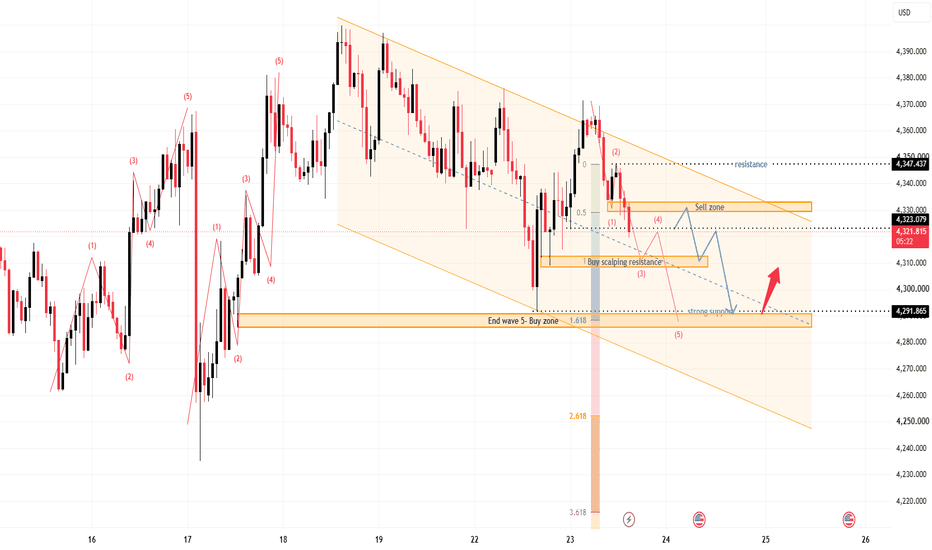
XAUUSD — Wave 5 Lower Toward 4,290
From Kelly’s view, gold remains inside a clear bearish structure and continues to respect the descending channel. Price is currently trading around 4,324, below the key resistance area near 4,347, while the latest rebound has failed to change the sequence of lower highs.
The key idea is simple: the current recovery may develop into a corrective Wave (4) toward the 4,329–4,334 sell zone, before another bearish leg targets the 4,292–4,285 Wave (5) completion area.
⟡ Market structure
Gold is st
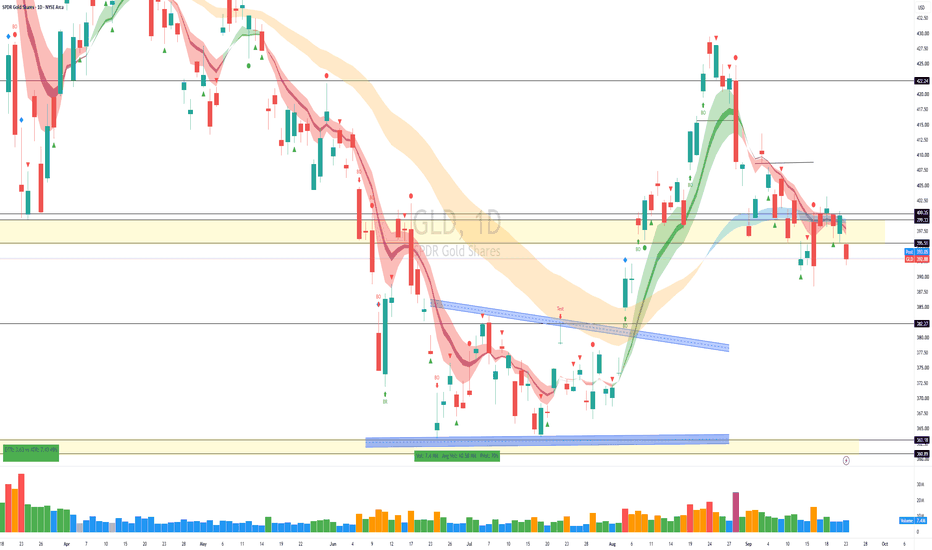
GLD Analysis: Gold Breaks 395 on Low Volume, Gap Down Fade in PlCONTEXT
For the last 5-6 days, 400 has been the key level on GLD:
- Long over 400
- Choppy between 395-400
- Bearish under 395
The market has now broken 395.
For CFDs, search XAUUSD. For futures, GC1!
KEY LEVELS
- 400: key level
- 395: breakdown level now being watched
- Downside targets: 390, 385, 382
WHAT THE CHART SHOWS
The break of 395 came with average volume much lower, less than 30%. Volume is not supporting the trend. For today's session, the setups on watch were a Gap Down Fade or a
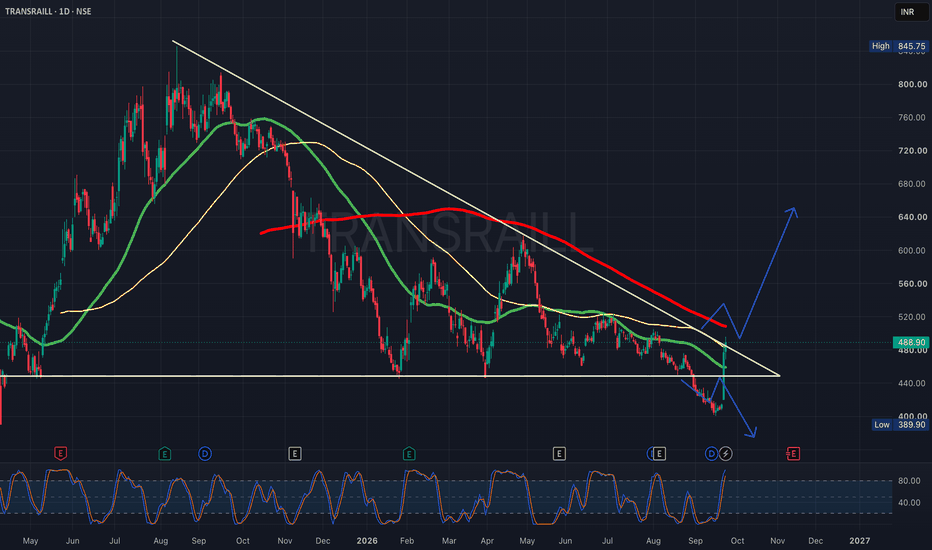
TRANSRAILL — Breakdown & Retest Long-Term Descending TrendlineTRANSRAILL has been trading under a long-term descending trendline after its major high around ₹845.
The stock recently broke below the important ₹445–450 horizontal support and fell toward ₹390, confirming a significant deterioration in the previous structure.
The current move is a strong rebound from the ₹390 area and price is now approaching the descending trendline and the ₹480–530 resistance zone.
Key levels:
🔹 ₹390–400 — recent swing-low / major support
🔹 ₹445–450 — previous support, n
SPY Daily: Bouncing From 5/12 EMA, 766.5 Low Is the Level
SPY's Sept 23 session went up, then choppy, then down. Banks are the reason SPY is much weaker than QQQ.
KEY LEVELS
- Sept 23 low: 766.5
- Downside targets below it: 762 and 760
WHAT THE CHART SHOWS
The down move came on volume 32% higher than average: 54M vs 41.5M. On the daily chart, price is bouncing from the 5/12 EMA, which makes the 766.5 low the big level to watch.
SCENARIOS
Bullish case: If 766.5 holds, I will look for a long on smaller timeframe curls.
Bearish case: If 766.5 breaks,
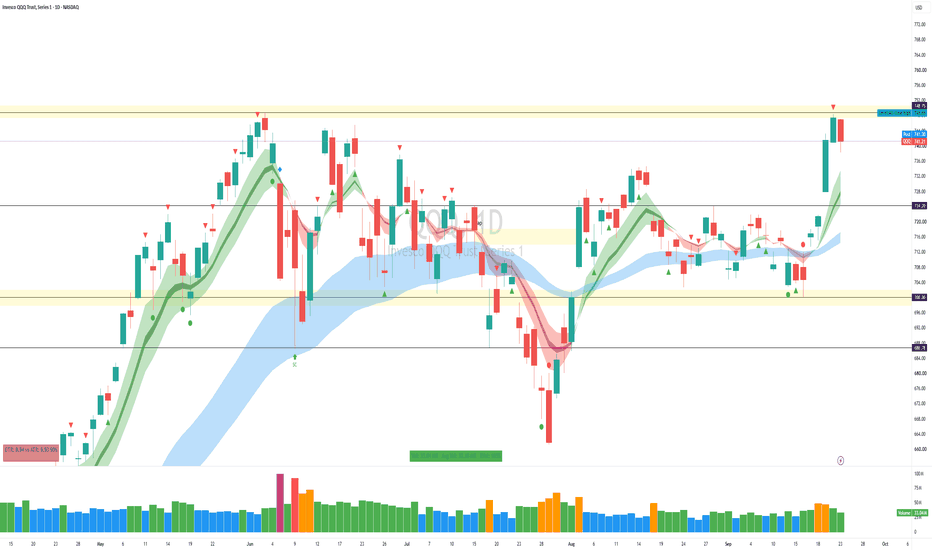
QQQ Analysis: Profit Taking After ATH Test, PDL Decides Sept 24After testing the all-time high, QQQ's move in the Sept 23 session reads as profit taking. That was the expected reaction at the ATH, and it puts the previous day low (PDL) in focus for Sept 24.
KEY LEVELS
- PDL (Sept 23 low):
- All-time high:
- Levels below the PDL: 734, 732, 730
WHAT THE CHART SHOWS
Price tested the ATH and pulled back. That pullback looks like profit taking at a major level, not a confirmed reversal yet. The PDL is the line between a normal pullback and a deeper move.
EURNZD is in The Selling Trend Due to TrendlineHello Traders
In This Chart EURNZD 4 HOURLY Forex Forecast By FOREX PLANET
today EURNZD analysis 👆
🟢This Chart includes EURNZD market update)
🟢What is The Next Opportunity on EURNZD Market
🟢how to Enter to the Valid Entry With Assurance Profit
This CHART is For Trader's that Want to Improve Their Technical Analysis Skills and Their Trading By Understanding How To Analyze The Market Using Multiple Timeframes and Understanding The Bigger Picture on the Charts
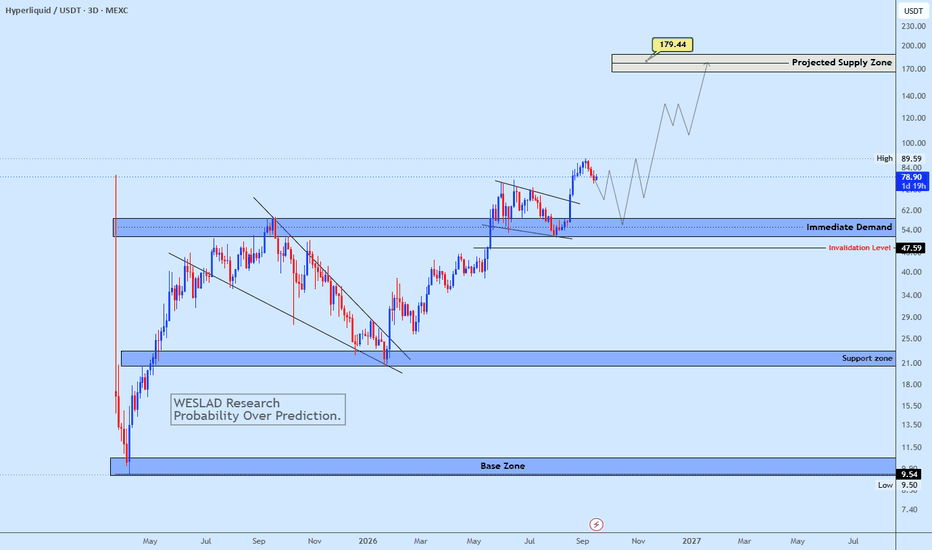
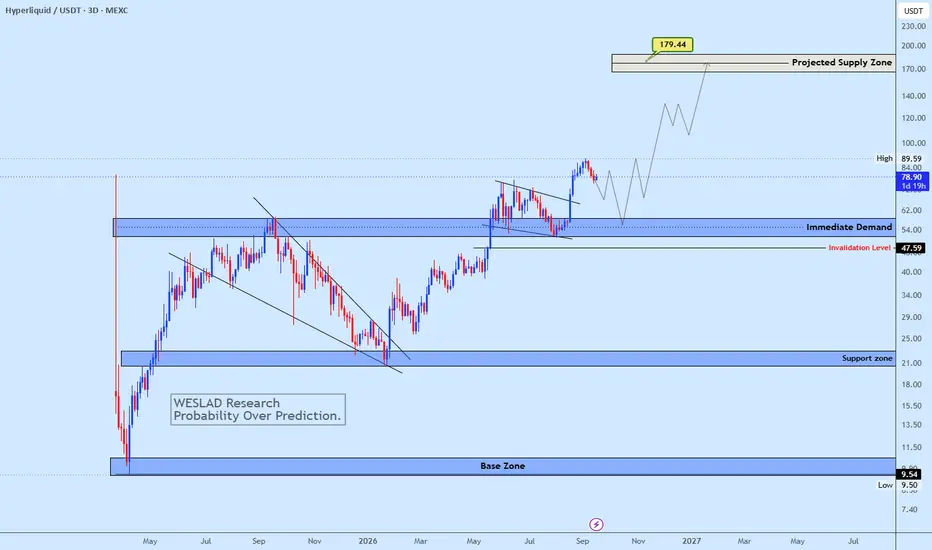
HYPE Bullish Continuation StructureHYPE continues to hold a bullish higher-timeframe structure, with price trading above the 52–59 immediate demand zone. A healthy pullback into this area could provide another reaction, while a break above 89.59 would strengthen the continuation structure toward 130, followed by the 170–180 projected supply zone. The bullish structure remains valid above 47.59.
Probability over prediction.
WESLAD Research
Week 39 of 52 | MCD Down 30%—Finally Cheap?McDonald’s is not a stock we normally see falling 30% from its all-time high. That alone makes the current area worth watching.
But a lower price does not automatically make a stock cheap, and touching support does not mean the bottom is already in.
For several years, NYSE:MCD traded inside a well-defined ascending channel. That structure eventually broke near $300, and the stock never managed to reclaim it. Since then, every rebound has been followed by more selling, pushing the price from
Week 37 of 52 | META From $524 to $650—Now Comes the Hard PartSeven weeks ago, NASDAQ:META was trading near $530 after a sharp post-earnings selloff.
In our Week 31 idea, we said the business was not broken. Revenue was still growing, but investors were worried about how quickly Meta was spending money on AI without showing a clear return.
Technically, we identified $530–$540 as the first support area and said that a move back above $600 would be the first real sign that buyers were taking control again.
That is exactly what happened.
META reached $
REAL - Multi-Timeframe Confluence TradeIt's been a while since I've covered REAL as it has not offered many obvious opportunities in a while.
However, like the setup I outlined in my last post on NYSE:RDDT , REAL is approaching an enticing entry.
The condition for a trade here is for LTF sell-side liquidity to get taken at a level that lines up with a multi-year buying trendline.
Since the momentum-driven rally to $17, price has cooled off into a "safe" range between $9 and $12. The range is wide, so traders don't need to cal
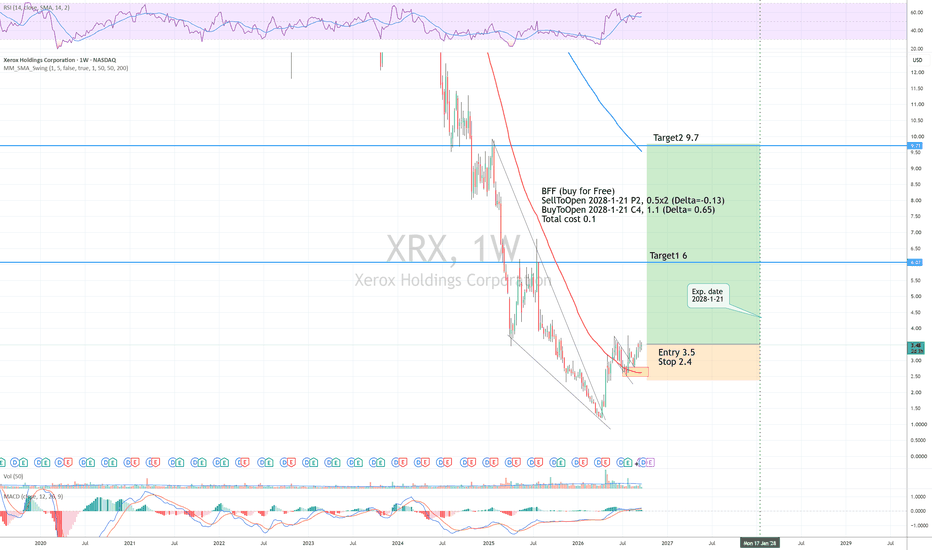
XRX LongWedge breakout + Wedge breakout + retest, weekly SMA50 as support
Entry 3.5
Stop 2.4
Target 6, 9.7
Risk management is much more important than a good entry point.
I am not a PRO trader. About 25% of my trades had been stopped quickly.
BFF (buy for Free)
SellToOpen 2028-1-21 P2, 0.5x2 (Delta=-0.13)
BuyToOpen 2028-1-21 C4, 1.1 (Delta= 0.65)
Total cost 0.1
If this option plan is stopped at 2.4, stop loss about 1.
EURUSD is Nearing a Strong Resistance Area!Hey Traders, in today's trading session we are monitoring EURUSD for a selling opportunity around 1.14400 zone, EURUSD is trading i na downtrend and currently is in a correction phase in which it is approaching the trend at 1.14400 support and resistance area.
Trade safe, Joe.
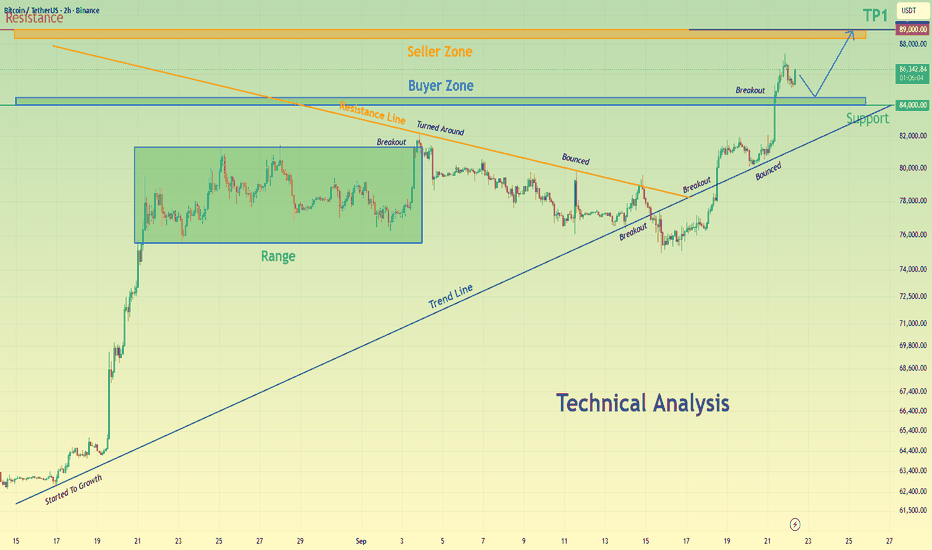
BTCUSDT Rebounds From 84K Buyer Zone — Can Bulls Reach 89K?Hello traders! Here’s my technical outlook based on the current BTCUSDT (2H) chart structure. BTCUSDT previously traded inside a range before breaking higher and later forming a descending structure. Price then bounced from the ascending Trend Line and broke above the Buyer Zone, shifting momentum bullish. Currently, BTCUSDT is trading below the 89,000 Seller Zone while holding above the 84,000 Buyer Zone and ascending Trend Line. The recent bounce from support suggests buyers are preparing for