TRANSRAILL — Breakdown & Retest Long-Term Descending TrendlineTRANSRAILL has been trading under a long-term descending trendline after its major high around ₹845.
The stock recently broke below the important ₹445–450 horizontal support and fell toward ₹390, confirming a significant deterioration in the previous structure.
The current move is a strong rebound from the ₹390 area and price is now approaching the descending trendline and the ₹480–530 resistance zone.
Key levels:
🔹 ₹390–400 — recent swing-low / major support
🔹 ₹445–450 — previous support, n
Trend Lines
SPY Daily: Bouncing From 5/12 EMA, 766.5 Low Is the Level
SPY's Sept 23 session went up, then choppy, then down. Banks are the reason SPY is much weaker than QQQ.
KEY LEVELS
- Sept 23 low: 766.5
- Downside targets below it: 762 and 760
WHAT THE CHART SHOWS
The down move came on volume 32% higher than average: 54M vs 41.5M. On the daily chart, price is bouncing from the 5/12 EMA, which makes the 766.5 low the big level to watch.
SCENARIOS
Bullish case: If 766.5 holds, I will look for a long on smaller timeframe curls.
Bearish case: If 766.5 breaks,
QQQ Analysis: Profit Taking After ATH Test, PDL Decides Sept 24After testing the all-time high, QQQ's move in the Sept 23 session reads as profit taking. That was the expected reaction at the ATH, and it puts the previous day low (PDL) in focus for Sept 24.
KEY LEVELS
- PDL (Sept 23 low):
- All-time high:
- Levels below the PDL: 734, 732, 730
WHAT THE CHART SHOWS
Price tested the ATH and pulled back. That pullback looks like profit taking at a major level, not a confirmed reversal yet. The PDL is the line between a normal pullback and a deeper move.
EURNZD is in The Selling Trend Due to TrendlineHello Traders
In This Chart EURNZD 4 HOURLY Forex Forecast By FOREX PLANET
today EURNZD analysis 👆
🟢This Chart includes EURNZD market update)
🟢What is The Next Opportunity on EURNZD Market
🟢how to Enter to the Valid Entry With Assurance Profit
This CHART is For Trader's that Want to Improve Their Technical Analysis Skills and Their Trading By Understanding How To Analyze The Market Using Multiple Timeframes and Understanding The Bigger Picture on the Charts
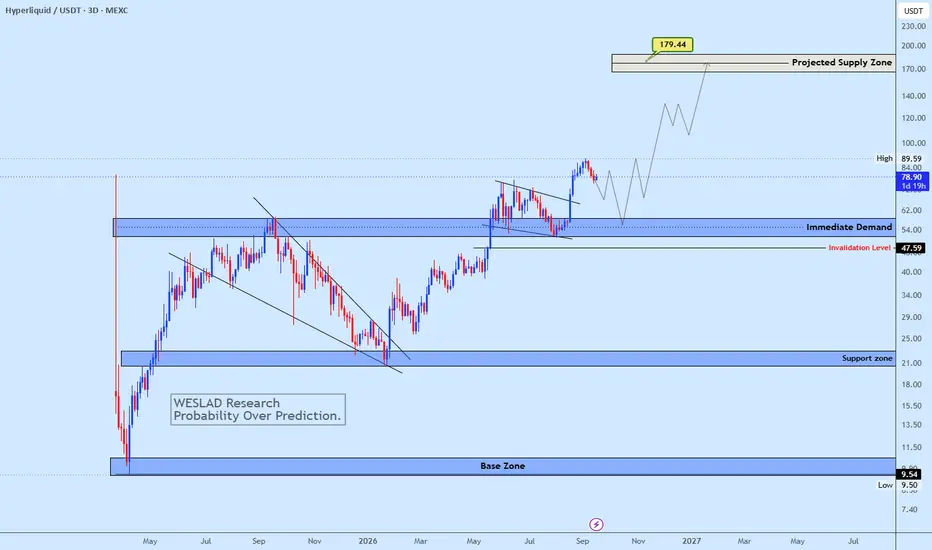
HYPE Bullish Continuation StructureHYPE continues to hold a bullish higher-timeframe structure, with price trading above the 52–59 immediate demand zone. A healthy pullback into this area could provide another reaction, while a break above 89.59 would strengthen the continuation structure toward 130, followed by the 170–180 projected supply zone. The bullish structure remains valid above 47.59.
Probability over prediction.
WESLAD Research
Week 39 of 52 | MCD Down 30%—Finally Cheap?McDonald’s is not a stock we normally see falling 30% from its all-time high. That alone makes the current area worth watching.
But a lower price does not automatically make a stock cheap, and touching support does not mean the bottom is already in.
For several years, NYSE:MCD traded inside a well-defined ascending channel. That structure eventually broke near $300, and the stock never managed to reclaim it. Since then, every rebound has been followed by more selling, pushing the price from
Week 37 of 52 | META From $524 to $650—Now Comes the Hard PartSeven weeks ago, NASDAQ:META was trading near $530 after a sharp post-earnings selloff.
In our Week 31 idea, we said the business was not broken. Revenue was still growing, but investors were worried about how quickly Meta was spending money on AI without showing a clear return.
Technically, we identified $530–$540 as the first support area and said that a move back above $600 would be the first real sign that buyers were taking control again.
That is exactly what happened.
META reached $
REAL - Multi-Timeframe Confluence TradeIt's been a while since I've covered REAL as it has not offered many obvious opportunities in a while.
However, like the setup I outlined in my last post on NYSE:RDDT , REAL is approaching an enticing entry.
The condition for a trade here is for LTF sell-side liquidity to get taken at a level that lines up with a multi-year buying trendline.
Since the momentum-driven rally to $17, price has cooled off into a "safe" range between $9 and $12. The range is wide, so traders don't need to cal
XRX LongWedge breakout + Wedge breakout + retest, weekly SMA50 as support
Entry 3.5
Stop 2.4
Target 6, 9.7
Risk management is much more important than a good entry point.
I am not a PRO trader. About 25% of my trades had been stopped quickly.
BFF (buy for Free)
SellToOpen 2028-1-21 P2, 0.5x2 (Delta=-0.13)
BuyToOpen 2028-1-21 C4, 1.1 (Delta= 0.65)
Total cost 0.1
If this option plan is stopped at 2.4, stop loss about 1.
EURUSD is Nearing a Strong Resistance Area!Hey Traders, in today's trading session we are monitoring EURUSD for a selling opportunity around 1.14400 zone, EURUSD is trading i na downtrend and currently is in a correction phase in which it is approaching the trend at 1.14400 support and resistance area.
Trade safe, Joe.
BTCUSDT Rebounds From 84K Buyer Zone — Can Bulls Reach 89K?Hello traders! Here’s my technical outlook based on the current BTCUSDT (2H) chart structure. BTCUSDT previously traded inside a range before breaking higher and later forming a descending structure. Price then bounced from the ascending Trend Line and broke above the Buyer Zone, shifting momentum bullish. Currently, BTCUSDT is trading below the 89,000 Seller Zone while holding above the 84,000 Buyer Zone and ascending Trend Line. The recent bounce from support suggests buyers are preparing for
OLLI: Trendline Flip — The Bargain Rally BeginsStory:
📊 The Pattern
OLLI has respected a multi-year rising trendline as support since 2020, and after a sharp decline from the $140 highs, it's now breaking above the descending trendline that capped every rally attempt on the way down.
⚡ The Confirmation
This week's candle is a turning out to be a breakout, and volume has been rising week over week into the move — real accumulation building, not a single-week spike.
🎯 Levels to Watch
🟢 Support: bullish while holding above $70
🔴 Resistance
STNG | Continued stock growth- Timeframe: Weekly
- Trade type: Buy stop order
- Price: 79.05
- Take Profit: Open
- Stop Loss: 73.99 (-6.40 %)
Idea: Long on a breakout above last week's high - bullish momentum continuation.
Entry: Buy stop above last week’s high.
Stop-loss: Below the low of the same candle.
If the weekly candle closes below this level, the trade is invalidated.
DAC | Continued stock growth- Timeframe: Weekly
- Trade type: Buy stop order
- Price: 143.14
- Take Profit: Open
- Stop Loss: 134.00 (-6.40 %)
Idea: Long on a breakout above last week's high - bullish momentum continuation.
Entry: Buy stop above last week’s high.
Stop-loss: Below the low of the same candle.
If the weekly candle closes below this level, the trade is invalidated.
Take Profit: Trailing stop following the lows of new weekly candles.
RDDT - This next move could be explosive!I'm excited about this one, but only on ONE condition.
The trigger: price sweeps the LTF sell-side liquidity at $143 on high volume, then reclaims it.
Why $143 matters: it has been the floor several times since August, so a lot of stops are sitting just below it. The HTF uptrend line from IPO lows runs into the same level. You rarely get LTF and HTF lining up this cleanly.
Why now: sellers have had every chance to reload, and they're coming into this zone with full force. If they ta
ESRT - The Case for a BottomI've talked about this setup before. ESRT's real estate portfolio (which includes the prized Empire State Building) along with its 90%+ lease rate point to a well-run company with well-managed assets.
For months I've pointed to one level, $3.93, as the spot where price needed to prove its taper and start the long road to recovery.
Last Friday was the 3rd-highest volume day in the company's history, and price closed right on $3.93.
Capitulation or distribution?
Volume that big at a key level
CADCHF: Important Breakout 🇨🇦🇨🇭
CADCHF broke and closed below a support line of a rising wedge pattern on a daily.
It opens up a potential for a further decline.
The price will likely continue falling soon and reach 0.5825
❤️Please, support my work with like, thank you!❤️
I am part of Trade Nation's Influencer program and receive a monthly fee for using their TradingView charts in my analysis.
ETH | Started with a Spark, Now We're On FireAlexa, play : Stargazing by The Neighbourhood
Alexa : get a way from me..you punk! go flirt with your LLMs
Self destruction mode activated. Three , two , one.
NO NOO! 💥💀
Finally guys , We are here and we are SO BACK
Do you smell that ? I smell money..Hopium is everywhere...Breath Boyz
MoonMaster is here babe and its SHOW TIME , alts pumpin one by one and many crypto bros thinkin after mockin Eth for being stable coins, maybe they should load after 15% green God candle
so lets take a clo
BSX - Holding on for dear life... But for how long?I don't believe in "support" as one line that refuses to give. Especially not on high time frames like the monthly and daily. Instead, I see multiple efforts at a single level holding as an area that's intentionally building liquidity (i.e. tons of buyers & sellers) - to either be:
A) broken and have fuel for a continuation downward
or
B) to be tapped into and reclaimed as fuel for a reversal upward.
I see this $42.60 level as just that.
And depending on how we react when the break does com