GOLD - Consolidation near 4,100. Bearish trend ICMARKETS:XAUUSD remains under pressure from the bearish trend and a strong dollar, confirming its bearish market structure. A retest of the 4,110 support is forming, along with a pre-breakout base...
Gold has resumed its decline and is threatening the $4,100 level after pulling back from $4,200.
In the near term, sellers remain in control due to elevated Treasury yields, a strong dollar, and rising oil prices, despite expectations of an October Fed rate hike having almost completely disap
Trend Line Break
XAUUSD — Liquidity Sweep + CHoCH + Trendline Break + Order Block
This analysis presents a complete SMC liquidity-based reversal model using liquidity sweep, market structure, trendline behavior, support/resistance, and Order Block confirmation.
The market initially remains under a descending trendline, showing that sellers are controlling the broader move. As price continues lower, previous swing lows become important because liquidity can accumulate below these levels. These lows may contain stop-loss orders from buyers as well as breakout sell orders.
Th
XAUUSD — Bearish Structure Below Sell Zone
Gold is still moving inside a clear bearish channel after failing to reclaim the upper resistance structure. From Kelly’s view, the chart suggests that XAUUSD remains under downside pressure, and the current rebound may only be a short correction before the next bearish wave continues.
The key idea is simple: gold is trading below the Sell zone, and as long as buyers cannot break back above this area, sellers may continue pushing price toward the lower support and final wave 5 target.
⟡ Marke
BITCOIN - The liquidity hunt phase ahead of the rally BINANCE:BTCUSDT.P continues to consolidate within the current bullish cycle. A liquidity-hunting phase is forming ahead of a possible continuation of the rally.
Bitcoin maintains a bullish market structure, with consolidation forming above the key resistance at 82,500. Within the current bullish trend, MM may form a manipulation around key liquidity zones. Fundamentally, the bullish drivers have faded, but technically, the market still looks strong.
The market is testing the 84,500–83,800
HYPEUSDT - The correction is over. Ready for the rally BINANCE:HYPEUSDT.P is consolidating near resistance formed within the trading range. The market is bullish, as is the altcoin’s trend, and I expect the rally to continue.
Bitcoin maintains its bullish structure and continues to consolidate with preconditions for further growth. A strong Bitcoin provides support to the entire altcoin market.
HYPEUSDT looks favorable for continuation of the main trend. The correction is over, and the focus is on the 91.800 trigger. A breakout of resistance c
Gold XAUUSD Market Structure, Order Blocks & Liquidity AnalysisThis analysis focuses on the current market structure of Gold (XAUUSD), with emphasis on market structure, liquidity, order blocks, trend-line interaction, and key reaction zones.
Price has been moving within a broader bearish structure, with a sequence of lower highs and lower lows visible across the chart. However, after the strong bearish displacement, price has entered a consolidation/ranging phase near the 4,120–4,200 area. This range is currently an important area to monitor for a potenti
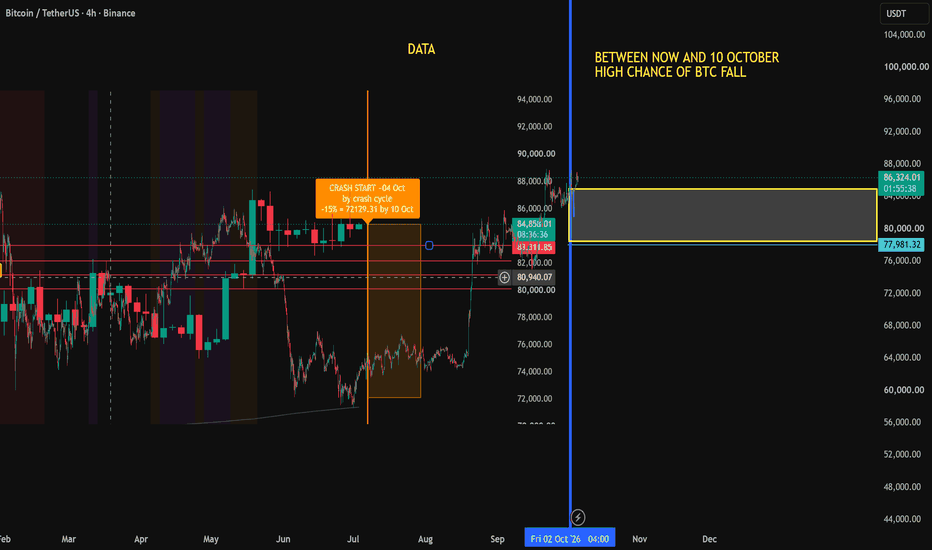
BETWEEN NOW AND 10 OCTOBER HIGH CHANCE BTC fallThe crash data has still the same confirmation trend on the crash trend, There is a bitcoin fall expecting, which can happen between the moment of now, and 10 OCTOBER.
This data is based on real algortmich trends of BTC, and we will follow it to see if the data can confirm out as it did before.
At this moment we indicate BTC as risk for HODL
GBP/JPY H4 Support Rejection with Breakout (05.10.2026)GBPJPY 4H has confirmed a clean falling wedge breakout following sustained accumulation above the 206.90 to 208.00 support zone. The descending trendline broken with strong candle confirmation signals bearish momentum fading and exposes the 213.00 resistance.
A sustained close below the 206.90 support zone invalidates the immediate bullish outlook. The setup strictly favors continuation toward the 215.00 psychological barrier. Price has broken above the Ichimoku cloud base and this structural
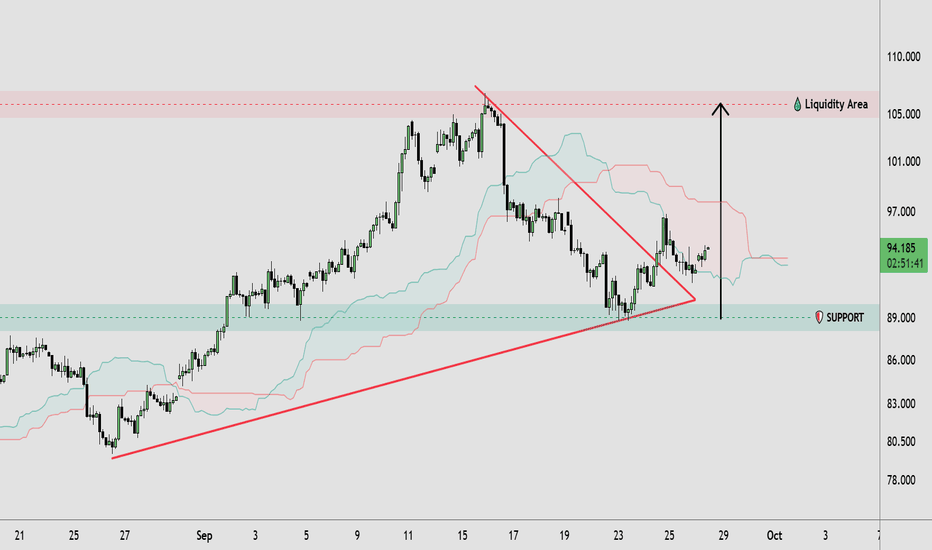
OILUSD — Rising Trendline Holds | Triangle Breakout in Focus🔹 OILUSD is showing a corrective structure after rejecting the 105–106 resistance and liquidity area. Price has moved lower within a contracting formation, while the rising trendline continues to provide support around the 89–90 region. Recent price action suggests consolidation above this support, with buyers attempting to stabilize after the previous decline. The 105–106 area remains a major resistance and liquidity zone, while the 89–90 region represents an important structural boundary.
🔸 I
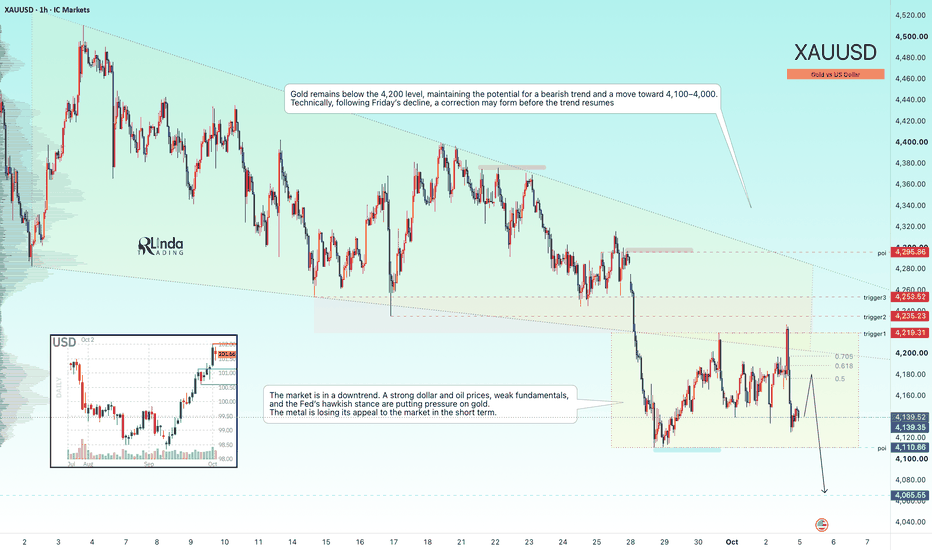
GOLD - Formation of a new range in a bear market ICMARKETS:XAUUSD is forming a short squeeze of resistance following Friday’s NFP release and, in line with the previously published scenario, continues to decline from the identified triggers.
The market remains in a bearish trend. A strong dollar and rising oil prices, a weak fundamental backdrop, and the Fed’s hawkish stance are putting pressure on gold. However, following Friday’s report, the market is beginning to question the continuation of interest-rate hikes. The fundamental backdr
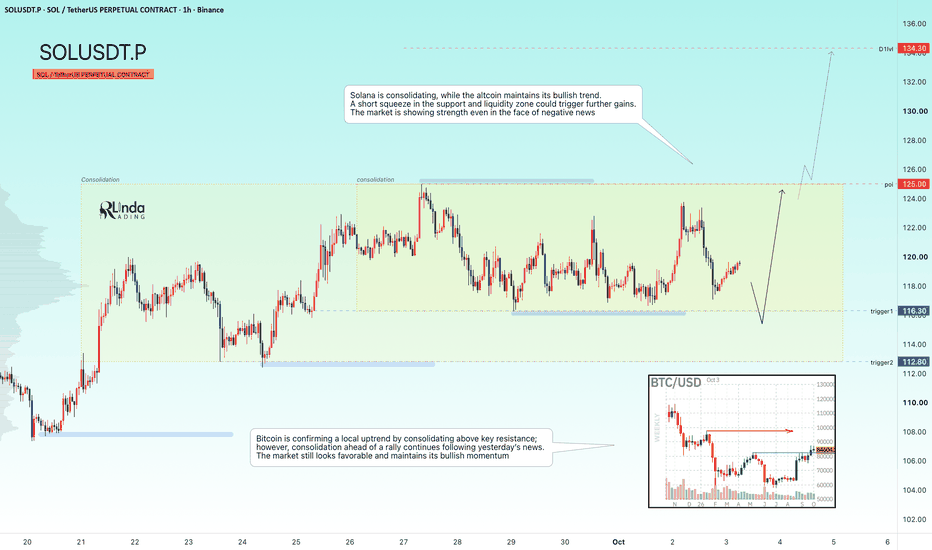
SOLUSDT - Consolidation Ahead of a Bullish DistributionBINANCE:SOLUSDT.P continues to consolidate after strong growth. Focus on the liquidity zone of 116.3–112.8; the counter-trend correction may end soon...
Bitcoin confirms the local bullish trend with consolidation above key resistance; however, consolidation before the rally continues after yesterday’s news. The market still looks favorable and maintains bullish momentum.
Solana is in consolidation; the altcoin maintains a bullish trend. A short squeeze of the support and liquidity zone cou
XAUUSD Gold Technical Analysis – Bullish Recovery Setup
XAUUSD is showing a potential bullish recovery from the support zone. Price is forming an ascending structure, with a possible breakout toward the 4,249 area. Key support remains around 4,100–4,120.
📊 Technical analysis only — trade with proper risk management.
GBP/USD Bullish Rebound Toward ResistanceGBP/USD is showing a bullish recovery from the **1.3180–1.3190 support zone**. Price has bounced strongly and is now trading around **1.3235**, suggesting buyers are attempting to push higher. A move above the nearby structure could open the way toward the marked resistance zone.
🎯 **Target: 1.3295**
🛡️ **Key Support: 1.3180–1.3190**
📈 **Bias: Bullish toward resistance**
The **1.3295 area** is the main target/resistance zone shown on the chart.
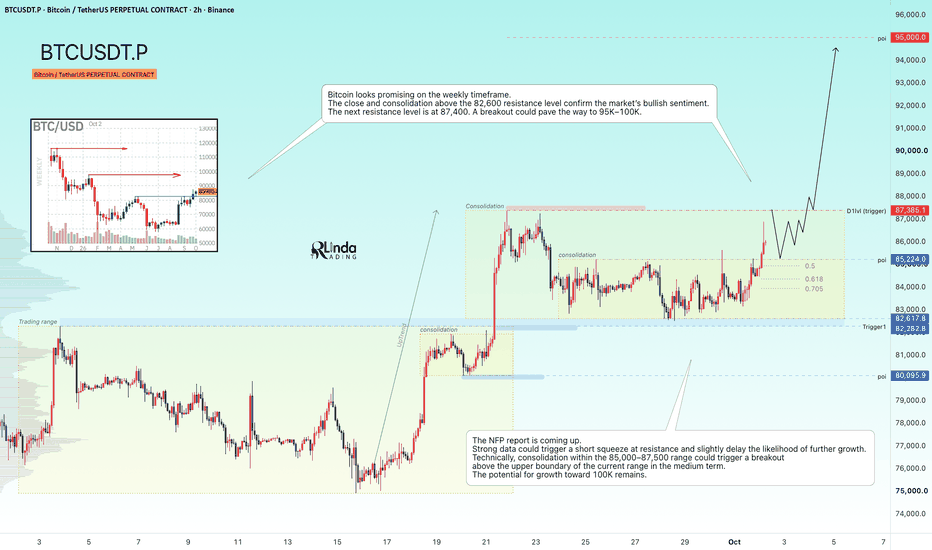
BITCOIN - Consolidation ahead of the NFP and ahead of the rally BINANCE:BTCUSDT.P looks favorable for continued growth in the medium term. Earlier, the market broke through the resistance formed on D1–W1 within the bearish trend, which confirms bullish hype.
In September, BTC behaved much stronger than the S&P 500 and gold; various analytical services point to activity from a large player. Overall, this is an indication of a strong market, especially against an unstable fundamental backdrop. Ahead is the NFP report, which could either strengthen the tr
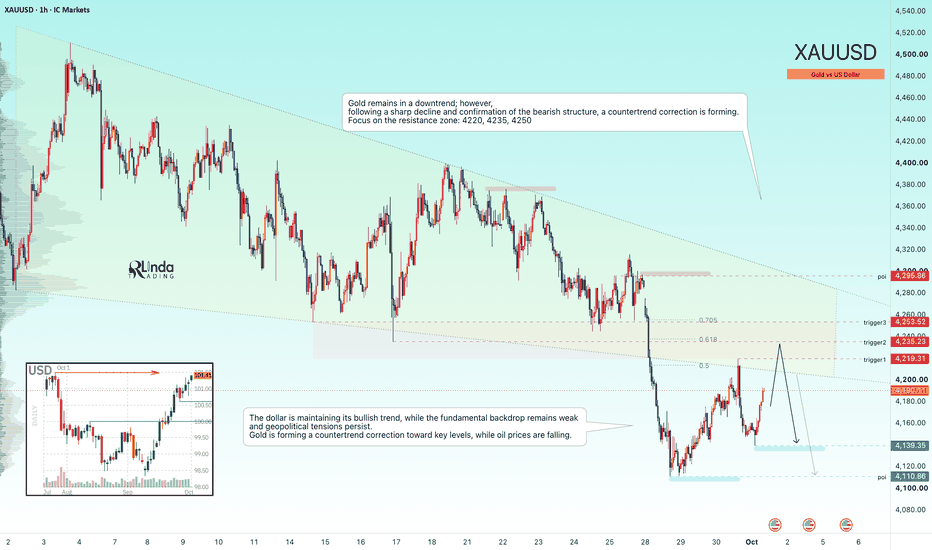
GOLD - A countertrend correction ahead of the news ICMARKETS:XAUUSD is bouncing from 4140 and forming a counter-trend correction toward areas of interest ahead of the news. The fundamental backdrop remains weak.
The dollar maintains its bullish trend, the fundamental backdrop is weak, and geopolitics remains tense. Rising oil prices amid a lack of progress in US–Iran talks via Qatar increased inflation concerns and supported Treasury yields and the dollar. A short-term bounce occurred after the release of August core PCE, but the positive
GOLD Institutional Market Structure & Liquidity Analysis
The chart is showing a developing bearish market structure after a significant rejection from the upper supply region. Price is currently trading around 4,164, with the most important structural decision area located between 4,003 and 4,390.
The market has already produced several BOS (Break of Structure) and CHoCH (Change of Character) signals. These indicate that the market has transitioned through different phases rather than moving in one uninterrupted direction.
At the current location,
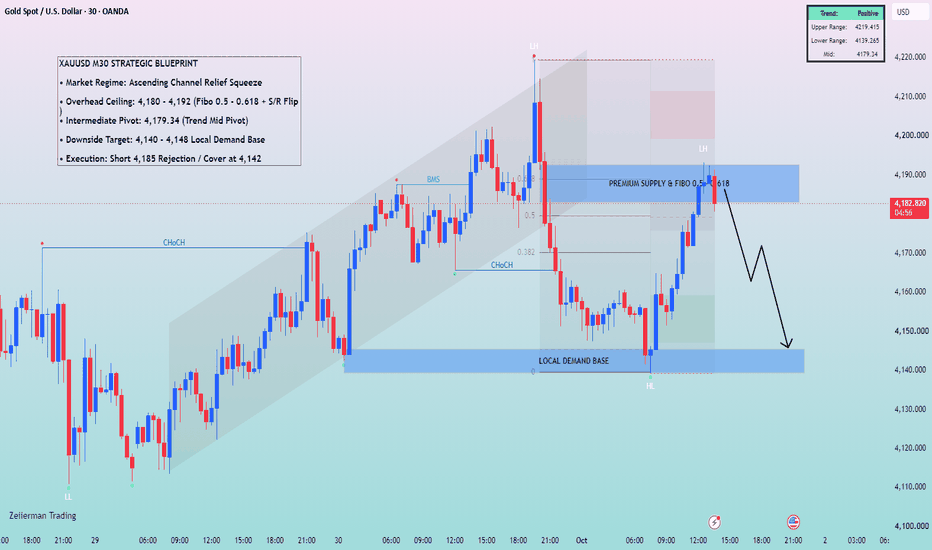
M30 Ascending Channel: 4,185 Plays to 4,142!
Macro Backdrop: Resilient US Dollar & Firm Treasury Yields Cap Bullion Relief
Gold (XAUUSD) trades near 4,172.090 (-0.08% floating) on Thursday morning, October 01, 2026, consolidating within an internal counter-trend channel following the swift rejection off the 4,220 swing high (LH). While structural sovereign debt debasement concerns and steady central bank bullion purchases maintain an overarching long-term safety floor, short-term price discovery remains constrained by the US Dollar Index
XAUUSD — Bullish Wave Setup From Buy Zone
Gold is showing a potential bullish recovery structure after reacting from the lower support area. From Kelly’s view, the chart suggests that XAUUSD may be building a new upside Elliott Wave sequence, with price currently holding above the Buy zone wave 3.
The key idea is simple: if buyers continue defending the lower buy zone, gold may push higher toward the resistance levels above, then extend toward the final wave 5 target.
⟡ Market structure
Gold is currently trading around 4,167, after bo
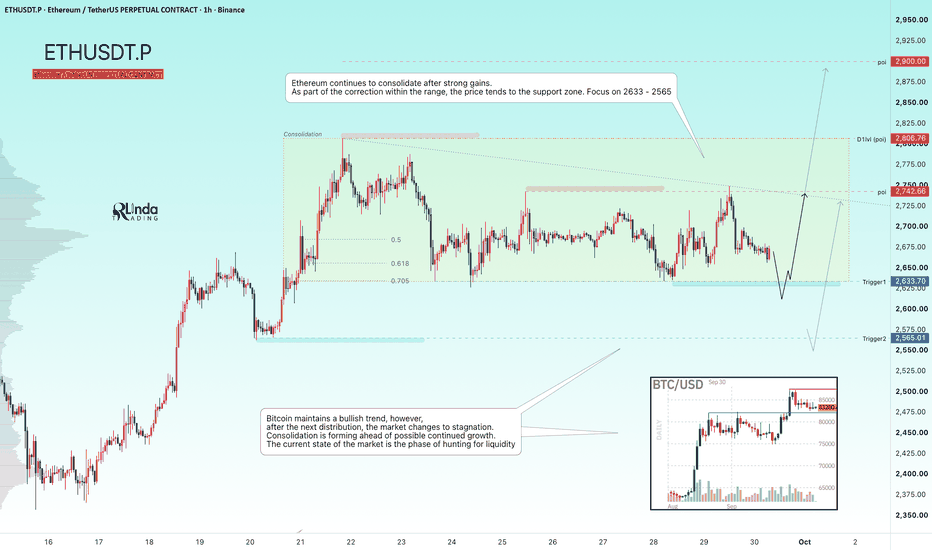
ETHUSDT - Consolidation (correction) on a bullish trendBINANCE:ETHUSDT.P is consolidating in the range of 2630–2800. The market maintains a bullish trend, and before the continuation of growth, MMs may form a local manipulation.
Bitcoin maintains a bullish trend; however, after another distribution, the market shifts into stagnation. A consolidation is forming before a possible continuation of growth. The current market state is a liquidity hunt phase.
Ethereum continues to consolidate after strong growth. Within the correction inside the rang
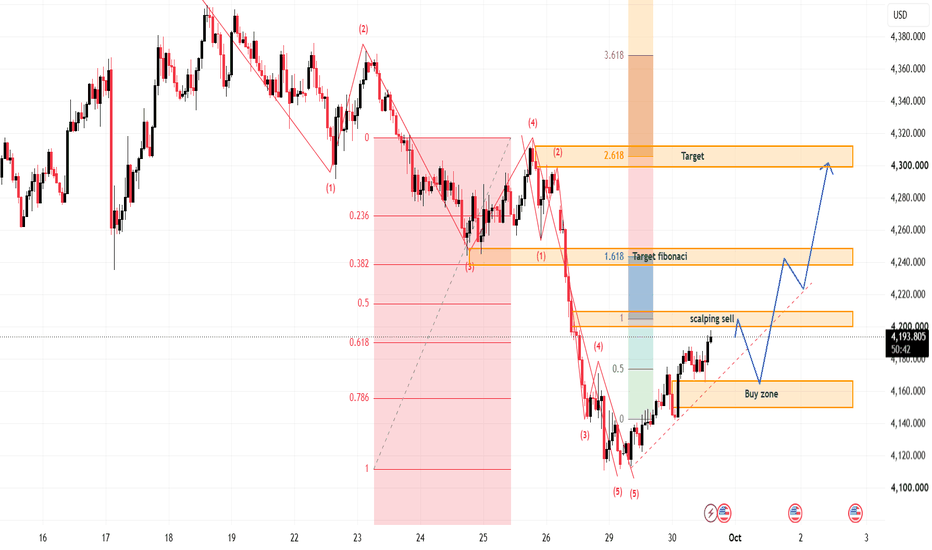
XAUUSD — Bullish Recovery From Wave 5 Low
Gold is showing a bullish recovery after completing the previous bearish wave near the lower support area. From Kelly’s view, the chart suggests that XAUUSD may be shifting into a short-term upside structure, with price now building higher lows above the recent wave (5) bottom.
The key idea is simple: gold may pull back slightly into the buy zone first, but as long as buyers defend that area, the next bullish wave can continue toward the Fibonacci target and the upper resistance zone.
⟡ Marke
US INTEREST + HOUSE BUBBLE US + ETF OUTFLOW MAIN REASON BTC 72KBitcoin is holding around 84K+, but the rally is losing steam and the macro picture is turning against it. Here is my bearish scenario.
Data shows that ETF getting step by step out after the cycle of BTC
one of the signals of manipulation crash market makers playing with volume, is the speed to use to increase the volume, and to force to have more up volume, with the goal of upcoming crash.
1. US interest rates
Treasury yields are climbing and analysts now talk about a 6% 10-year yield. High
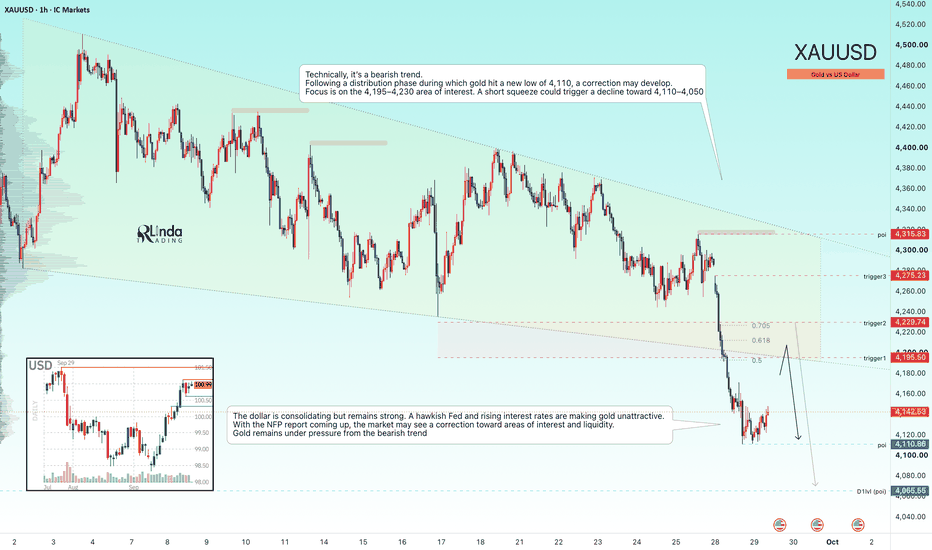
GOLD - Countertrend correction before newsICMARKETS:XAUUSD , after a bearish distribution, is forming a correction with the aim of hunting for liquidity. The market remains under pressure from the bears and in a downtrend...
The dollar is consolidating but remains strong. A hawkish Fed and rising interest rates make gold unattractive.
Gold remains vulnerable. Any recovery is likely to be sold unless Friday’s Nonfarm Payrolls (NFP) report significantly disappoints and reduces expectations of two rate hikes this year. The nearest re
SMC Trendline + Fibonacci 0.5–0.618 + 1.5–1.7 Target ModelSMC Trendline + Fibonacci 0.5–0.618 + 1.5–1.7 Target Model
This model combines Trendline Breakout, Liquidity Sweep, Fibonacci Retracement and Fibonacci Extension to build a structured SMC setup. The main idea is to use the trendline for direction, the 0.50–0.618 area for retracement/entry context, and the 1.5–1.7 extension area for potential target delivery.
1. TRENDLINE — FIND THE DIRECTION
First identify a clear trendline connecting meaningful swing highs or swing lows.
For a bullish setup
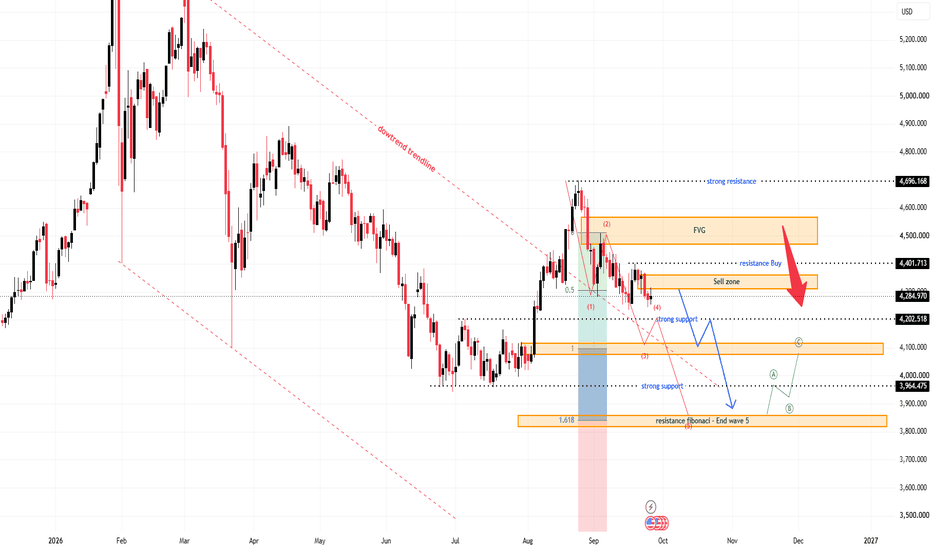
XAUUSD — Weekly Bearish Map Toward 3,850
Gold is entering next week with a heavy structure after failing to hold above the recovery zone. From Kelly’s view, the chart suggests that XAUUSD is still trading under the larger downtrend pressure, and the current price action looks more like a bearish continuation setup than a confirmed bullish reversal.
The key idea is simple: gold is still below the main sell zone and below the larger downtrend structure. If buyers cannot reclaim resistance, sellers may continue to push price toward the l