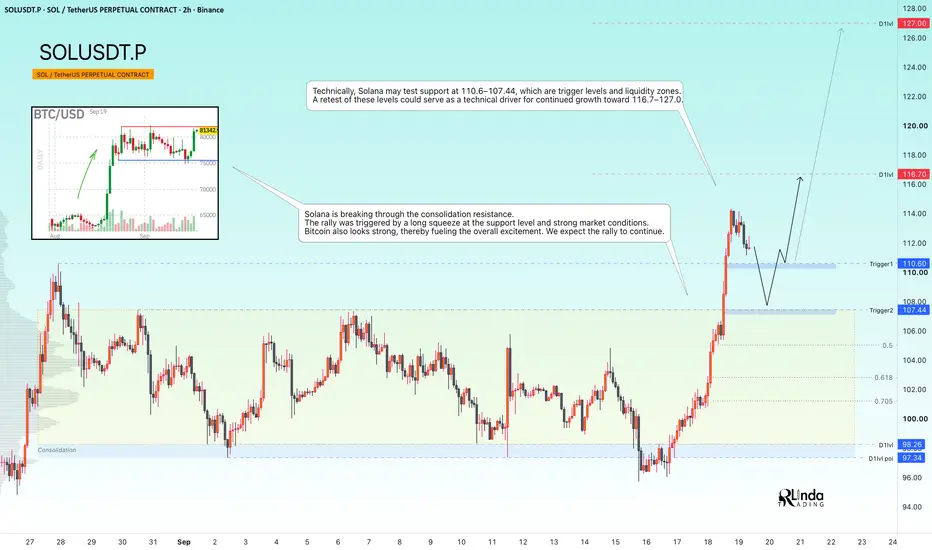
GOLD - The Hunt for Liquidity Ahead of a Decline ICMARKETS:XAUUSD continues to form a countertrend correction, driven by the decline in oil prices. The fundamental backdrop remains weak...
The dollar is stagnating after a strong rally triggered by the Fed’s hawkish stance and rising interest rates. However, the Dollar Index remains strong, which continues to put pressure on gold. At the same time, the decline in oil prices has given the metal some room to recover. The market remains highly dependent on geopolitical developments.
There is not much major news ahead next week, with the key focus on PMI data and Friday’s Durable Goods Orders. Technically, gold remains under pressure from the bearish trend
Resistance levels: 4,402, 4,434, 4,511
Support levels: 4,340, 4,250, 4,200
Gold is forming a countertrend correction. The dollar remains strong, while the fundamental backdrop is unfavorable for gold due to the Fed’s hawkish stance and rising interest rates.
Technically, the key focus is on two triggers: 4,402–4,434. A short squeeze could trigger a decline toward 4,340–4,250
Best regards,
R. Linda!  Short
Short
SOLUSDT - A hunt for liquidity ahead of the rally's continuationBINANCE:SOLUSDT confirms its bullish market structure. The long squeeze of support that we expected in the previous analysis played out perfectly. The bulls quickly took control of the situation and strengthened their positions...
Previously, we discussed how the market turned out to be stronger than expected: Bitcoin showed virtually no reaction to higher interest rates, the Fed’s hawkish stance, or the fact that the CLARITY Act was not passed. Consolidation continued, which further confirmed the strength of the market.
As for Solana, the altcoin is breaking through the consolidation resistance, suggesting that the coin is ready to continue its move higher. The rally was triggered by a long squeeze of support and the overall strength of the market
Resistance levels: 116.7, 127.0
Support levels: 110.6, 107. 44
Technically, Solana could retest the 110.6–107.44 support zone, which represents both key triggers and liquidity areas. A retest of these levels could become a technical catalyst for further upside toward 116.7–127.0
Best regards,
R. Linda!  Long
Long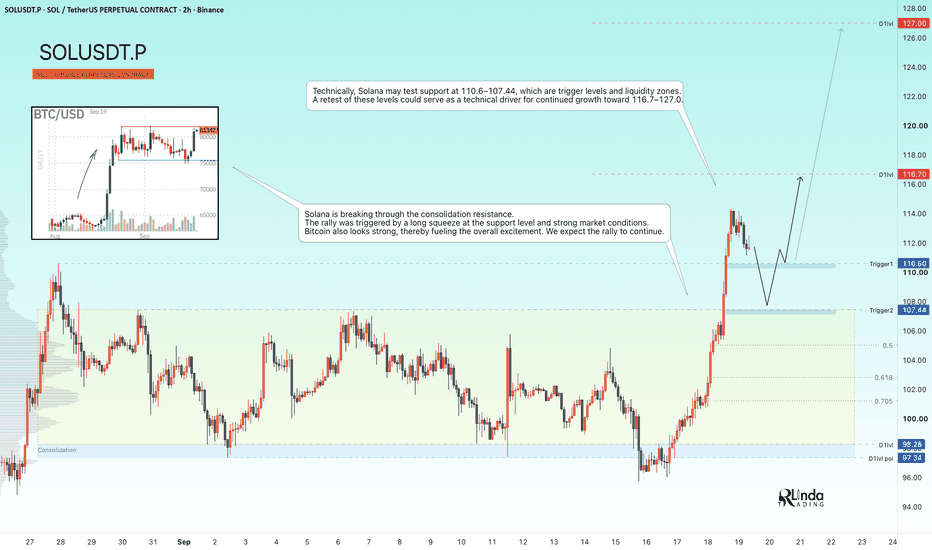
Gold Technical Analysis: Sellers Defend 4,400 Resistance ZoneHello traders! Here’s my technical outlook based on the current XAUUSD (4H) chart structure. XAUUSD previously traded inside a range before breaking higher and later forming a descending structure after turning around from the highs. Price then tested the 4,400 Seller Zone multiple times, where sellers rejected the upside. Currently, XAUUSD is trading below the 4,400 Seller Zone while holding above the 4,280 Buyer Zone and Support Line. The recent rejection from resistance suggests a possible continuation lower toward support. As long as XAUUSD remains below the 4,400 Seller Zone and respects the descending channel, the bearish scenario remains valid. A continuation lower could push price toward the 4,280 Buyer Zone (TP1). However, a breakout and close above 4,400 would weaken the bearish outlook and increase the possibility of further upside. Please share this idea with your friends and click "Boost" 🚀 Short 
BTCUSDT Long: Rebound from 75,000 as Price Targets 79,000Hello traders! Here’s my technical outlook based on the current BTCUSDT (3H) chart structure. BTCUSDT previously broke higher along the Demand Line and tested the 79,000 Supply Zone, where sellers rejected the upside before pulling back.
Currently, price holds below 79,000 while staying above the 75,000 Demand Zone and ascending Demand Line. The recent bounce suggests buyers are preparing for another move higher.
As long as BTCUSDT remains above 75,000 and respects the Demand Line, the bullish scenario remains valid. A continuation higher could target 79,000 (TP1). However, a break below 75,000 would weaken the bullish outlook. Manage your risk!  Long
Long
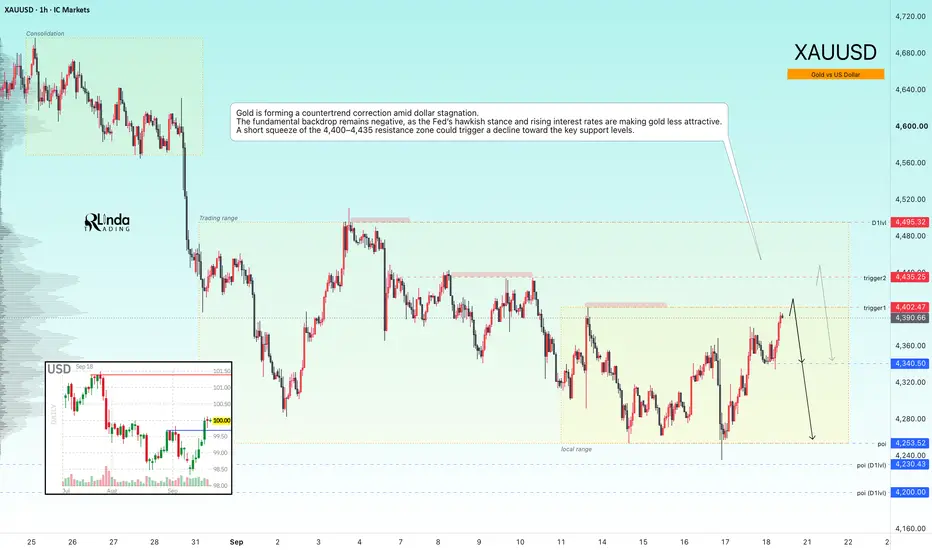
GOLD - A countertrend correction aimed at liquidity huntingICMARKETS:XAUUSD has been forming a countertrend correction toward the 4,400–4,430 liquidity zone since the session opened. The fundamental backdrop remains weak, and the market is still in a bearish trend
The dollar is stagnating after breaking through local resistance levels. The Fed’s hawkish stance and rising rates are supporting the Dollar Index, which is putting medium-term pressure on the metals market. However, the correction in oil prices is giving gold some room to recover as it tests key levels.
Gold is stabilizing, but further upside remains limited by the Fed’s hawkish outlook and geopolitical risks. The BOJ decision and developments in the Middle East will determine the short-term direction
Drivers:
Upside: further declines in oil prices and yields, de-escalation of the conflict, softer U.S. data, dovish BOJ.
Downside: escalation in the Middle East, higher oil prices, hawkish Fed stance, dollar strength
Resistance levels: 4,402, 4,435, 4,495
Support levels: 4,340, 4,253, 4,200
Gold is forming a countertrend correction amid dollar stagnation. A short squeeze of the 4,400–4,435 resistance zone — with the key focus on two triggers — could trigger a decline toward the key support levels. The formation of reversal patterns after the retest could provide a potential entry opportunity
Best regards,
R. Linda! Short 
HBAR Macro Symmetrical Triangle — $0.56 Breakout Target & $3.09 HBAR/USD | 1M Chart | Macro Technical Setup
HBAR is compressing inside a large multi-year symmetrical triangle, with price continuing to respect both the descending macro resistance line and rising support from the cycle lows.
On the monthly timeframe, this is becoming a significant compression structure. Price is currently around $0.084, so the setup remains unconfirmed — the important event would be a decisive breakout and higher-timeframe acceptance above the descending trendline.
The Triangle Measured Move
The height of the structure gives an approximate $0.389 measured move.
Depending on exactly where HBAR breaks the descending resistance, projecting that move from the breakout area puts the primary technical objective around:
$0.50–$0.56
That is particularly interesting because the measured move converges closely with the previous macro high / 1.0 Fibonacci level near $0.569.
This creates a clear technical roadmap if the triangle resolves upward:
Triangle breakout → $0.20 → $0.316 → $0.416 → ~$0.56
Key Fibonacci Levels
The chart identifies the following levels:
$0.070 — 0.236
$0.105 — 0.382
$0.145 — 0.500
$0.200 — 0.618
$0.316 — 0.786
$0.416 — 0.886
$0.569 — 1.000
The $0.20 region stands out because it is both the 0.618 retracement and approximately where HBAR would begin challenging the upper boundary of the macro structure.
What Happens Above the Previous High?
If HBAR eventually reclaims the ~$0.57 macro high, the Fibonacci extensions on this chart provide longer-term areas to monitor:
1.272 → $1.20
1.414 → $1.77
1.618 → $3.09
The 1.618 extension near $3.09 would represent roughly a 1,000%+ move from the potential breakout region shown on the chart.
Importantly, $3.09 is not the triangle measured-move target. The triangle itself points toward approximately $0.50–$0.56. The $1.20, $1.77 and $3.09 levels are longer-term Fibonacci extensions that would only become relevant if HBAR first breaks the triangle and ultimately clears its previous macro high.
Confirmation
For the bullish scenario, I'm watching for:
1. Break above the multi-year descending resistance
2. Monthly acceptance above the trendline
3. Reclamation of ~$0.20 / 0.618
4. Continuation toward $0.316 and $0.416
5. Challenge of the ~$0.56–$0.57 macro target zone
Until the upper trendline is broken, HBAR remains inside the triangle and the direction is not confirmed.
A decisive loss of the ascending macro support would invalidate the bullish triangle thesis.
This is a monthly macro setup, not a short-term trade. The structure could take considerable time to resolve.
Educational analysis only. This is not financial advice or a recommendation to buy or sell HBAR. Cryptocurrency markets involve substantial risk. Always conduct your own research and manage risk appropriately.  Long
Long
SOLUSDT - The Hunt for Liquidity Before Growth Resumes BINANCE:SOLUSDT.P continues to consolidate, just like the rest of the market. Technically, this is a favorable sign for further upside. However, important news is ahead...
Bitcoin is in consolidation, as is the rest of the market. Key news is ahead: the FOMC meeting and consideration of the cryptocurrency legislation.
Solana is also consolidating, while at the same time maintaining its local bullish trend amid expectations of upcoming news. Technically, a liquidity pool has formed below 97.34, which could be tested before a rally higher.
A long squeeze of the current range support could trigger further upside. However, a breakdown of the market structure on negative news could lead to a broader market decline
Resistance levels: 103.88, 107.4
Support levels: 98.3 - 97.3
A favorable fundamental backdrop, a false breakdown of support, and price consolidation above 98.3 could become a technical catalyst for further upside toward 103.88–107.4–110
Best regards,
R. Linda! Long 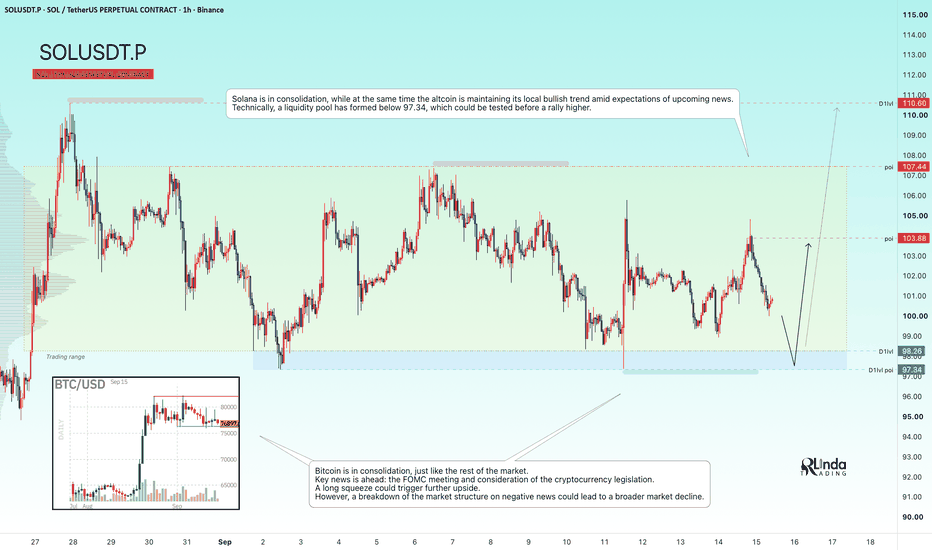
 Long
Long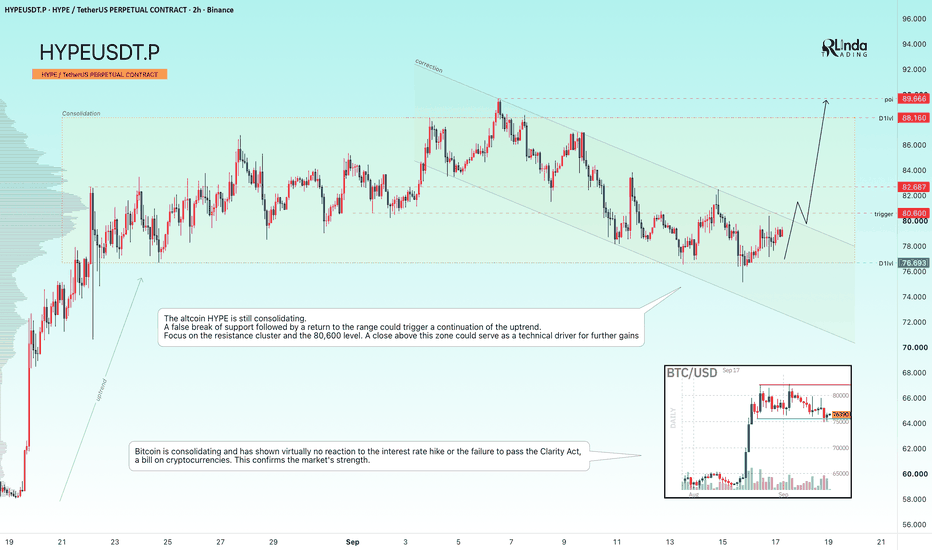
 Long
Long
 Long
Long
Long
Bearish Liquidity Sweep Setting Up Bullish Reversal Toward BSL?1. Overall Bias
The chart presents a Smart Money Concepts (SMC) / ICT-style technical analysis, outlining a full market cycle: consolidation → liquidity sweep → bearish expansion → reversal → retracement → renewed bullish setup targeting higher liquidity pools.
2. Element-by-Element Breakdown
A. Price Range (Aug 25–28)
Labeled "PRICE IN RANGE" — price consolidated in a tight horizontal box, indicating accumulation/distribution before a directional move.
A diagonal trendline inside this box shows minor internal structure (lower highs) hinting at seller pressure building before the breakdown.
B. MSS (Market Structure Shift) — Aug 28–29
As price broke below the range's low, it triggered a Market Structure Shift, confirming a change from ranging/bullish structure to a bearish directional bias.
This is the first technical confirmation that sellers had taken control.
C. First Fair Value Gap (FVG) — Post-MSS
Immediately after the MSS, an aggressive bearish candle created an imbalance (FVG) around the 4,480–4,520 zone (grey box).
This zone represents inefficient price delivery — a gap between buying and selling pressure — and is technically considered a potential resistance/rebalancing zone if price later revisits it.
D. Bearish Move (Fundamentally Driven)
The information box explicitly states this decline was triggered by FOMC fundamentals — implying a hawkish Fed outcome strengthened the USD, which inversely pressured Gold lower.
Price dropped sharply from ~4,520 down to ~4,300, marked clearly as "BEARISH MOVE."
E. Sell-Side Liquidity & Liquidity Sweep (Sep 1–2)
Price declined into a zone marked "SELL SIDE LIQUIDITY," where resting sell-stop orders (from range lows) were sitting.
The "LIQUIDITY SWEEP" label confirms price deliberately wicked below this level to grab liquidity (stop-hunt) before reversing — a hallmark SMC behavior where smart money engineers a move to fill large orders before reversing direction.
F. Second Fair Value Gap (FVG) — Recovery Leg
Following the sweep, an impulsive bullish leg formed a second FVG around 4,360–4,400.
This becomes a key support/Point of Interest (POI) zone, since price often retraces to fill such imbalances before continuing its intended direction.
G. Buy-Side Liquidity Sweep (Sep 3–4)
Price rallied aggressively into the "BUY SIDE LIQUIDITY" zone near 4,500–4,520, sweeping resting buy-stop orders above the prior swing highs.
This effectively completed a full liquidity cycle: sell-side sweep → bullish expansion → buy-side sweep.
H. Distribution / Bearish Retracement Channel (Sep 4–16)
After the liquidity grab, price entered a descending channel (marked by the diagonal trendline), retracing lower in a controlled, corrective structure.
This pullback is technically significant — it's retracing back into the FVGs/POIs created earlier, which is standard behavior for price to "rebalance" imbalanced zones before resuming its higher-timeframe direction.
I. Key POIs (Points of Interest) — Right Side of Chart
Three horizontal POI zones are marked as upside targets:
POI Approx. Level Significance
POI 1 ~4,520 Highest target, aligned with prior buy-side liquidity high
POI 2 ~4,480 Mid-range resistance/imbalance zone
POI 3 ~4,400 Nearest target, aligned with the FVG left during the bullish leg
These POIs represent untapped liquidity/imbalance zones above current price, forming the bullish thesis's technical targets.
J. Bullish Reversal (Sep 16–17, Current Price Action)
Price recently swept a fresh low (~4,240) and sharply reversed upward, labeled "BULLISH REVERSAL."
This is interpreted as another localized liquidity sweep, now acting as the launchpad for the anticipated move back toward the POIs.
Current price (4,308.50) is trading right at the edge of this reversal structure, suggesting the setup is actively developing, not yet confirmed.
K. Inset Chart (Bottom Left) — DXY (U.S. Dollar Index) Correlation
A smaller secondary chart, styled with candlesticks around the 99.90–100.30 range, appears to track the U.S. Dollar Index (DXY).
The upward-sloping arrow suggests an expected continuation or reversal in DXY that would inversely correlate with Gold's move — i.e., if DXY weakens from here, Gold gets fundamental tailwinds to reach the marked POIs.
This ties directly into the chart's core thesis (bottom text box): "The U.S. Dollar moved higher fundamentally due to FOMC data. Now, a downside move may occur. If USD weakens, Gold could move upward and target the key POIs."
3. Trade Thesis Summary
Catalyst: FOMC-driven USD strength caused Gold's initial bearish leg.
Liquidity Engineering: Price swept both sell-side and buy-side liquidity in sequence — a classic smart-money footprint.
Current Phase: Retracement/distribution phase is complete or nearing completion, with a fresh bullish reversal signal at the recent low.
Forward Expectation: Contingent on USD weakness, Gold is technically positioned to reclaim liquidity toward POI 3 → POI 2 → POI 1 (4,400 → 4,480 → 4,520+).
Invalidation Risk: If the USD continues strengthening or the bullish reversal fails to hold above recent lows (~4,240), the bearish channel could resume, delaying or invalidating the bullish POI targets. Long 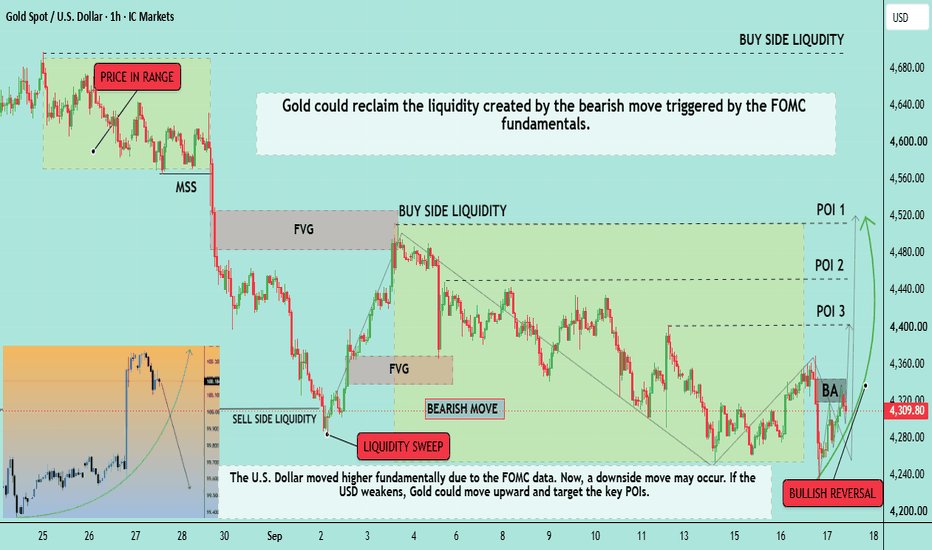
Gold Forecast: Bullish Recovery from Trend Line ContinuesHello traders! Here’s my technical outlook based on the current XAUUSD (3H) chart structure. XAUUSD previously traded inside a descending structure before breaking higher with a strong impulse and shifting bullish. Price then formed a range, tested the 4,440 Seller Zone, and pulled back before bouncing from the Buyer Zone and ascending Trend Line. Currently, XAUUSD is trading below the 4,440 Seller Zone while holding above the 4,300 Buyer Zone and the ascending Trend Line. The recent bounce from support suggests buyers are defending this area and preparing for another move higher. As long as XAUUSD remains above the 4,300 Buyer Zone and respects the ascending Trend Line, the bullish scenario remains valid. A continuation higher could push price toward the 4,440 Seller Zone (TP1). However, a breakdown and close below the Buyer Zone would weaken the bullish outlook and increase the possibility of further downside. Please share this idea with your friends and click "Boost" 🚀 Long 
GOLD - A countertrend correction ahead of the news ICMARKETS:XAUUSD is bouncing from support ahead of the news and forming a countertrend correction amid the dollar’s stagnation following a five-day rally. The FOMC meeting and comments from the regulator are ahead...
Technically, most of the hawkish risks have already been priced in, but gold will remain vulnerable if the Fed signals that it intends to keep rates elevated for an extended period. Geopolitical risks and high energy prices are providing support. Gold is caught between expectations of tighter monetary policy and safe-haven demand.
Technically, the market is moving toward a liquidity zone, which could be tested before another decline within the local trend
Drivers:
Downside: hawkish Fed, strong dollar, rising yields.
Upside: dovish Fed, weak dollar, geopolitical support
Resistance levels: 4,355, 4,402
Support levels: 4,250, 4,230, 4,200
Gold, having failed to reach the key levels at 4,230–4,200, is forming a countertrend correction ahead of the upcoming news — the interest rate decision. A short squeeze of the 4,355–4,400 resistance zone could trigger a decline toward the key areas of interest
Best regards,
R. Linda! Short 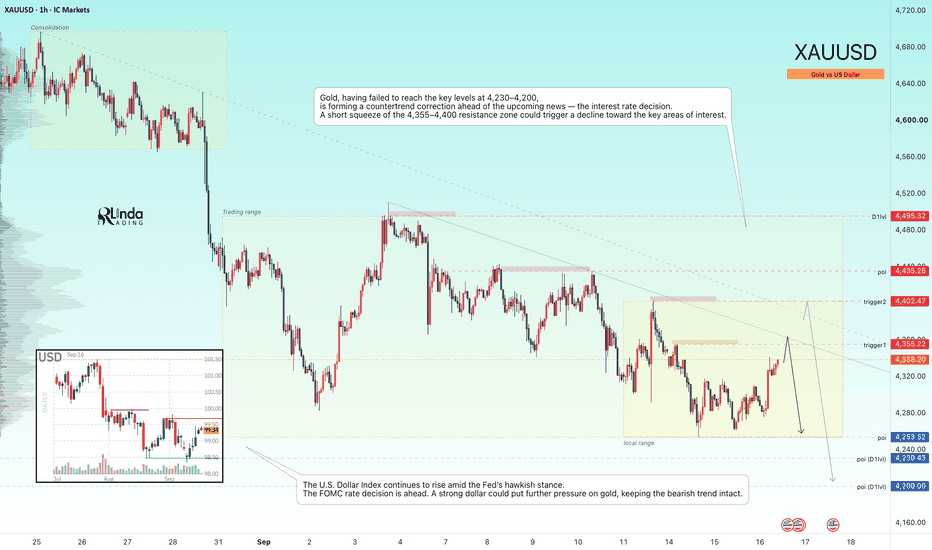
Solana : Triangle Breakdown—Is This Really a Bearish Reversal?Solana : Triangle Breakdown—Is This Really a Bearish Reversal?
SOL has broken below a visible triangle structure on the H4 chart.
At first glance, this looks bearish.
But when we zoom out and look at the higher-timeframe structure and the logarithmic chart, the picture becomes more complicated.
The breakdown has happened, but several important support levels below price have not yet been decisively lost.
That matters.
A pattern can break while the larger market structure is still intact.
So I don't consider this a high-conviction short setup yet.
The Bigger Picture
The recent move has been strong enough that the market may simply need to correct and rebalance before deciding on its next larger move.
The H4 chart is therefore giving us a warning, not necessarily a complete reversal signal.
For now, I would rather use the H4 structure to create a bearish bias and then move to the H1 timeframe to look for a cleaner short setup.
That's a much better approach than selling directly into the H4 breakdown.
The Important Scenario
If SOL continues lower and the remaining support levels begin to break with acceptance, the bearish scenario becomes much stronger.
But there is another possibility.
If price returns higher and recovers a significant portion of today's decline, the breakdown could turn out to be a liquidity event rather than the beginning of a sustained downtrend.
In that case, today's move may have done exactly what the market needed:
remove liquidity → create fear → rebalance the market → prepare for the next move.
This is why I don't want to make a strong conclusion from the triangle alone.
Day Trading Plan For now, my focus is:
H4: Directional context
H1: Search for the short setup
Lower timeframe: Entry confirmation
If H1 gives us a clean bearish structure after a pullback, rejection or liquidity sweep, the short becomes much more interesting.
If SOL instead reclaims the broken structure and recovers today's decline, I would step back and reassess the bearish thesis.
Don't confuse a pattern break with a confirmed trend reversal.
That's one of the most important lessons on this chart.
Final View
I would describe the current setup as:
Bearish — but not yet high conviction.
The triangle has broken, but the market still has important support underneath.
The logarithmic view also reminds us that after a strong directional move, correction is normal.
So rather than predicting that SOL must continue falling, I'm watching the H1 structure for confirmation.
If sellers prove themselves, we trade the short.
If the market reclaims the breakdown, we don't force the idea.
The chart doesn't owe us the direction we expect.
Our job is to react when the structure confirms it.
Fundamentally, Solana continues to have a large and active ecosystem across DeFi, payments, consumer applications and other on-chain activity. Recent network developments include the activation of Transaction V1, which increases the maximum transaction size from 1,232 to 4,096 bytes, expanding what can be executed in a single transaction.
At the same time, SOL remains highly sensitive to broader crypto liquidity and market risk. Recent market coverage has highlighted the importance of the roughly 100 Dollar area and the 103–106 Dollar resistance region, showing that price remains in a technically important area rather than a clean one-directional trend.
Risk Warning: This analysis is for educational purposes only and is not financial advice. Crypto assets are highly volatile. Wait for confirmation, define your invalidation and never risk more than you can afford to lose. Short 
BTCUSDT Short: Can Sellers Push Bitcoin Toward the 76,800?Hello traders! Here’s my technical outlook based on the current BTCUSDT (2H) chart structure. BTCUSDT previously traded inside a descending channel with multiple breakouts before testing the Supply Zone near 79,000, where a fake breakout occurred and sellers rejected the upside.
Currently, BTCUSDT is trading below the 79,000 Supply Zone while holding above the 76,800 Demand Zone and the Demand Line. The recent rejection and descending structure suggest a possible continuation lower toward demand.
As long as BTCUSDT remains below 79,000 and respects the Supply Line, the bearish scenario remains valid. A continuation lower could push price toward 76,800 (TP1). However, a breakout above 79,000 would weaken the bearish outlook. Manage your risk! Short 
GOLD - A bounce off support before falling to 4,200 ICMARKETS:XAUUSD remains under pressure from the Fed’s hawkish stance and a strengthening dollar. In the medium term, the market may maintain its bearish trend; however, this week, all attention is focused on the Fed’s rate decision and the regulator’s comments
The dollar is forming a countertrend correction but remains locally bearish. The dollar’s rise is putting additional pressure on the metals market. Gold is maintaining its bearish market structure amid the Fed’s hawkish stance, while the market is also pricing in a high probability of a rate hike. Yields at their highest levels since 2023 are reducing the attractiveness of non-yielding gold. Trump’s rhetoric, including his calls for lower rates while acknowledging uncertainty, as well as support for Warsh’s independence, have so far failed to change the overall hawkish stance.
Technically, gold could remain within the current range ahead of the news. A false breakdown of support could trigger a correction toward the liquidity zones before the downtrend resumes.
Resistance levels: 4,345, 4,389, 4,435
Support levels: 4,287, 4,230, 4,200
The market is aiming to test the 2,292–2,287 liquidity pool. As an initial reaction to the retest, the market could trigger a rebound toward the 4,345–4,389 areas of interest and liquidity, followed by another move lower toward 4,200
Best regards,
R. Linda! Short 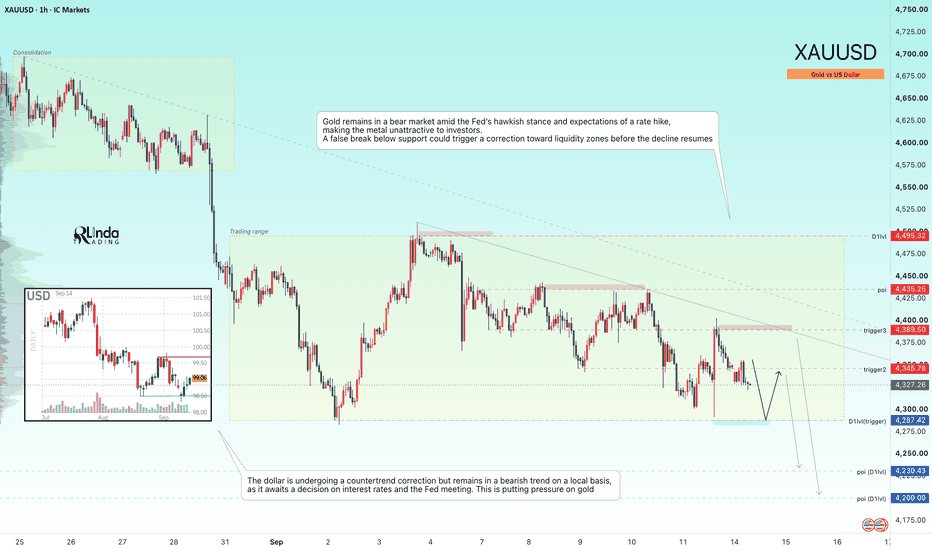
Gold Rebounds From Trend Line — 4,440 Resistance in FocusHello traders! Here’s my technical outlook based on the current XAUUSD (2H) chart structure. XAUUSD previously traded inside a range before breaking higher with a strong impulse and shifting bullish. Price then formed another range and moved toward the 4,680 Resistance Line, where sellers rejected the upside. Currently, XAUUSD is trading below the 4,440 Seller Zone while holding above the 4,310 Buyer Zone and ascending Trend Line. The recent bounce from support suggests buyers are attempting to regain control. As long as XAUUSD remains above the 4,310 Buyer Zone and respects the ascending Trend Line, the bullish scenario remains valid. A continuation higher could push price toward the 4,440 Seller Zone (TP1). However, a breakdown and close below the Buyer Zone would weaken the bullish outlook and increase the possibility of further downside. Please share this idea with your friends and click "Boost" 🚀 Long 
Short