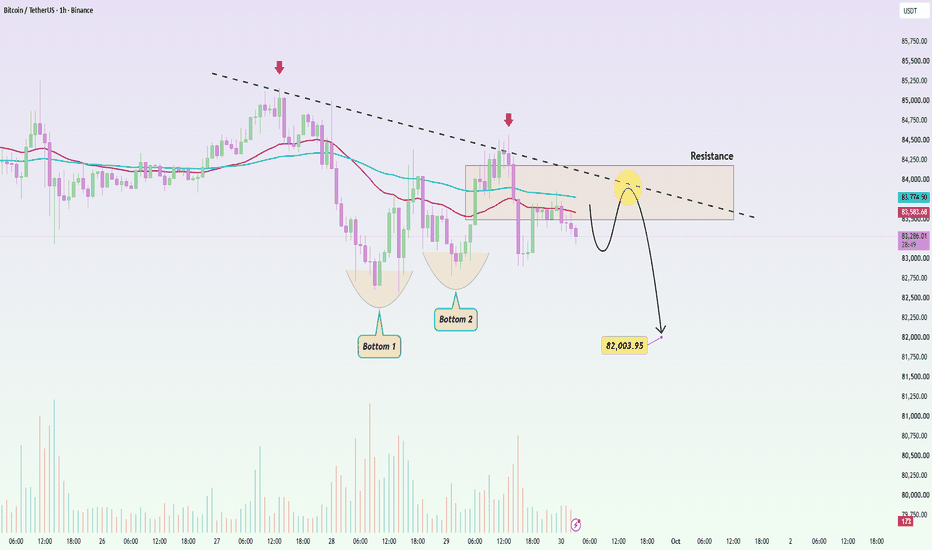
BTCUSDT: Bearish Setup, Next Downward WaveBitcoin is still struggling beneath a clear descending trendline, and the latest recovery has once again failed around the $83,600–$84,300 resistance area. Price is also trading below both short-term EMAs, which keeps the immediate structure tilted toward sellers.
The two recent lows may resemble a double bottom, but that pattern is not enough on its own. A double bottom normally needs a convincing break of the neckline before the bullish reversal is confirmed.
A small rebound back into $83,50
W-pattern
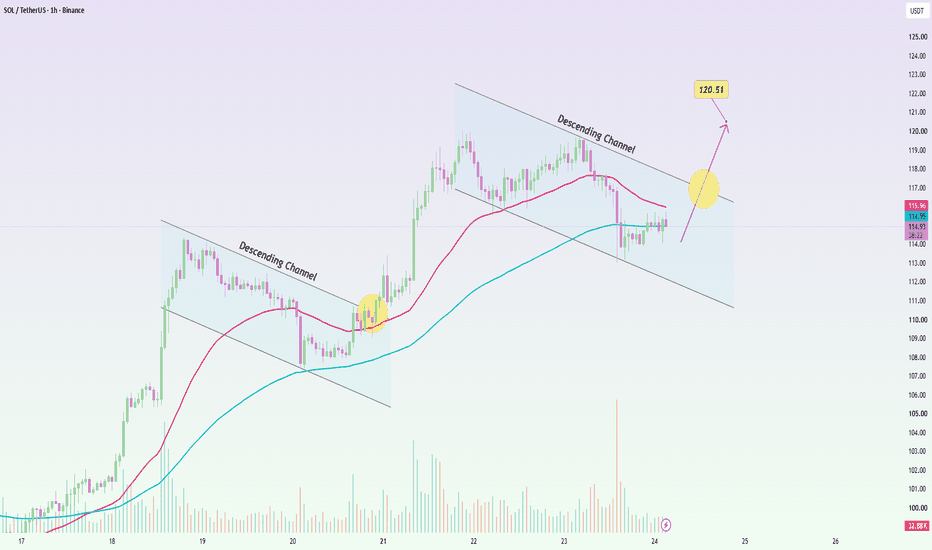
SOLUSDT: Continuation structure, Bulls hold advantageSOLUSDT is trading around 115.2 USDT after bouncing off the 113–114 zone. The price is currently holding above the EMA89 (near 114.95) but remains below the EMA34 and the upper boundary of the descending channel; consequently, the 116–117 USDT area will determine the next move.
If SOL maintains the 114–115 level and clearly breaks out of the 116.5–117 zone, the short-term structure will improve significantly. In that scenario, I lean towards an extension to 118–119, followed by a move toward th
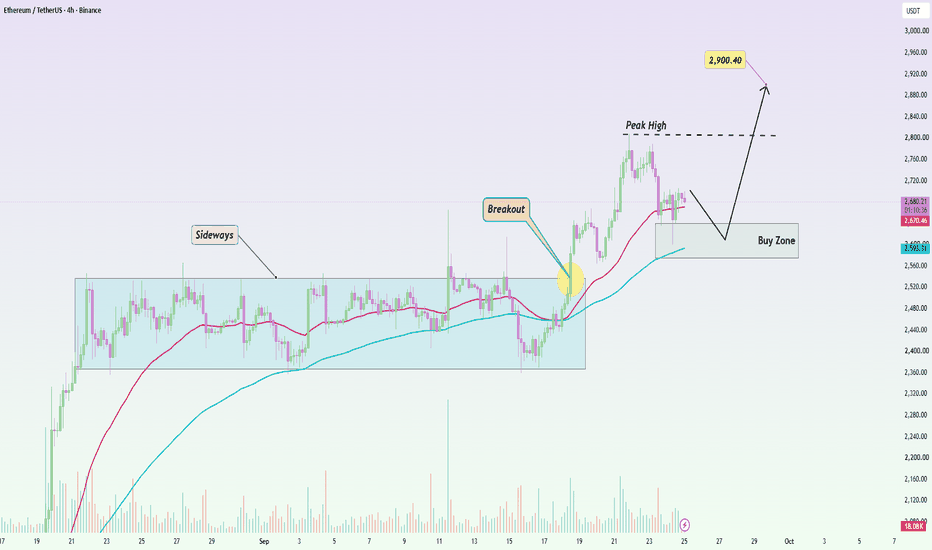
ETHUSDT: Pullback Buy Zone, Open Way to 2.900Ethereum remains constructive on the H4 chart after breaking out of its previous sideways structure around 2,520–2,550. That breakout triggered a strong expansion toward 2,800, followed by the pullback we are seeing now.
Price is currently around 2,680 and still holding near the faster EMA around 2,670, while the slower EMA continues rising near 2,590. This keeps the broader recovery structure intact.
The area I would watch most closely is 2,580–2,640. It combines the rising EMA with a previou
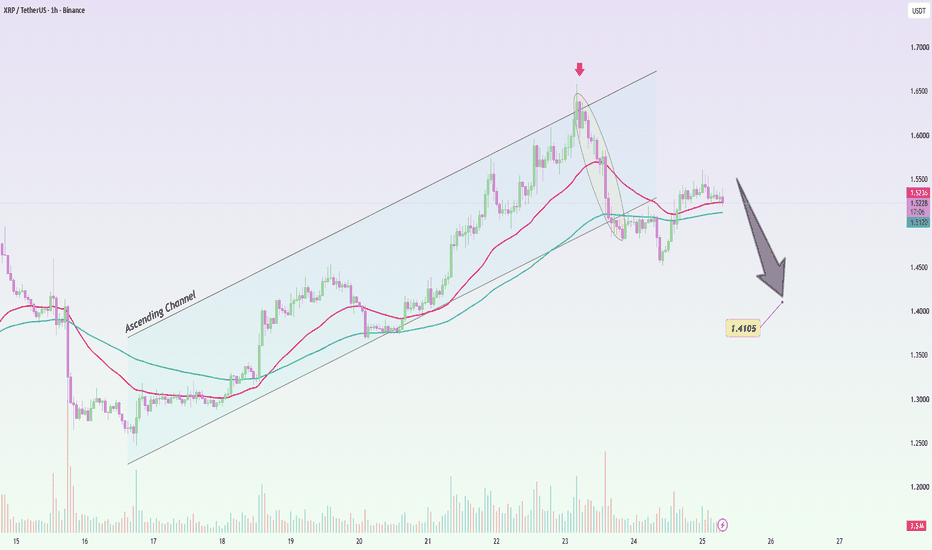
XRPUSDT: Broken Channel Keeps Aim 1.41XRP has lost the lower boundary of its ascending channel after being rejected from the $1.63–$1.65 area. That break changed the short-term structure, and the recovery that followed has so far failed to reclaim the former channel.
Price is now consolidating around $1.53, only slightly above the two H1 EMAs near $1.52–$1.51. As long as XRP remains capped below roughly $1.55–$1.57, this rebound can still be treated as a retest rather than a confirmed bullish recovery. A channel breakdown becomes m
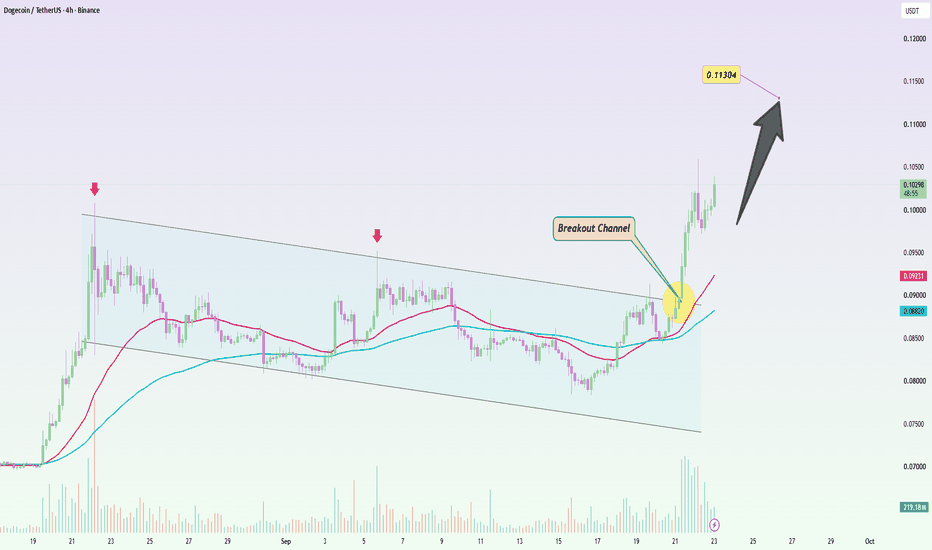
DOGEUSDT: Breakout descending channel, Bulls Aim 0.113DOGEUSDT is trading around 0.1029 USDT following a clear breakout from the descending channel that had been in place since late August. This breakout was accompanied by a significant surge in volume, while the price is currently holding firm above the EMA34 (approx. 0.0923) and EMA89 (near 0.0882), indicating a notably more positive H4 market structure.
After the rapid rally, I do not favor chasing the price. If DOGE undergoes a pullback but manages to hold the 0.097–0.100 zone, the likelihood
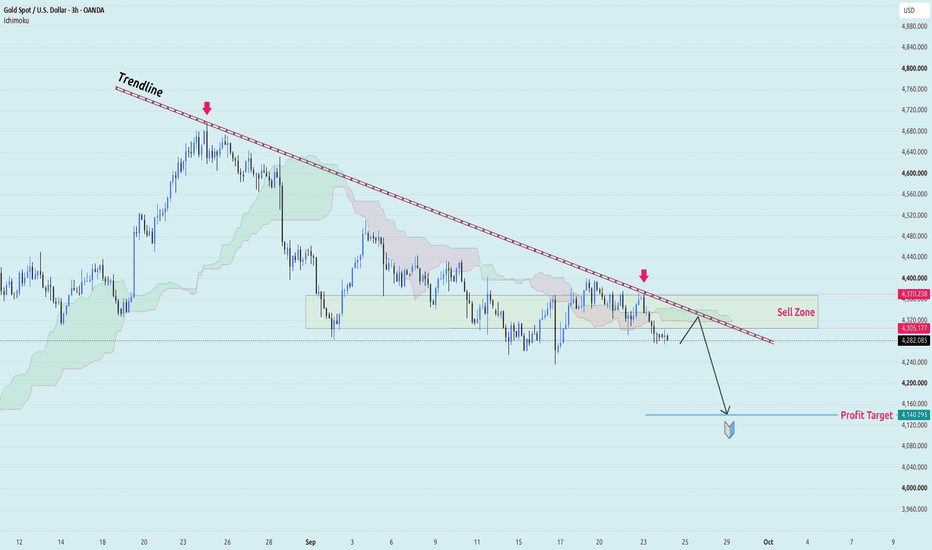
XAU/USD - Failing Down, Buyer Looks 4.140$OANDA:XAUUSD remains trapped below the long descending trendline, while the latest recovery has failed to regain the 4,305–4,370 sell zone. Price is also trading beneath the Ichimoku structure, keeping the broader H3 pressure tilted to the downside.
As long as Gold stays below 4,370 and sellers continue defending the trendline, I favor another bearish leg toward:
🎯 Target: 4,140
Macro Market: today’s backdrop supports the bearish technical picture. The US Dollar is holding near a two-mo
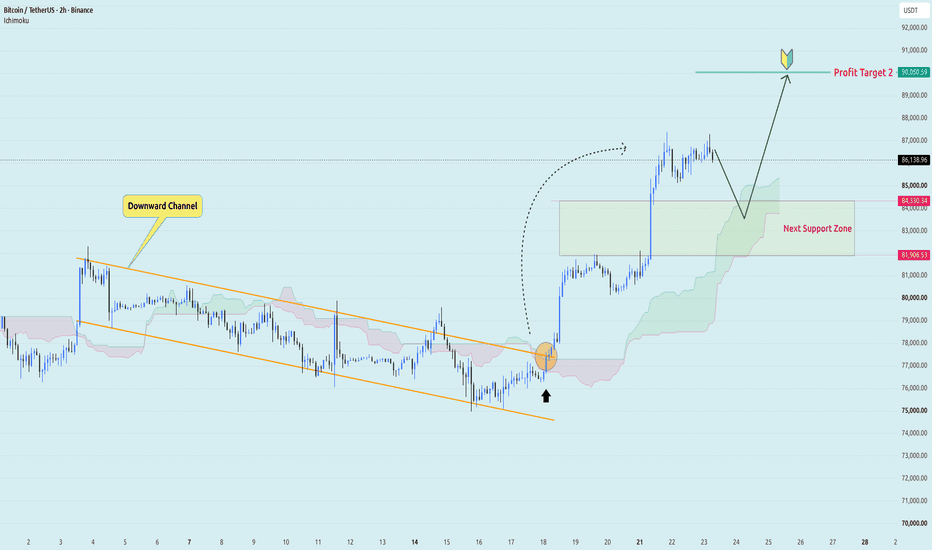
BTC/USDT - Momentum Strong, Buyers Push HigherBINANCE:BTCUSDT is holding above 86K after a strong breakout from the previous descending channel. Price is also trading well above the Ichimoku cloud, confirming that short-term momentum has shifted firmly back to buyers.
The key area now is the 81.9K–84.3K support zone. I would rather see a controlled pullback into this region than chase price after such a sharp expansion.
If buyers continue defending that structure, I’m watching:
🎯 Target: 90.05K
Macro Market: Bitcoin is getting mea
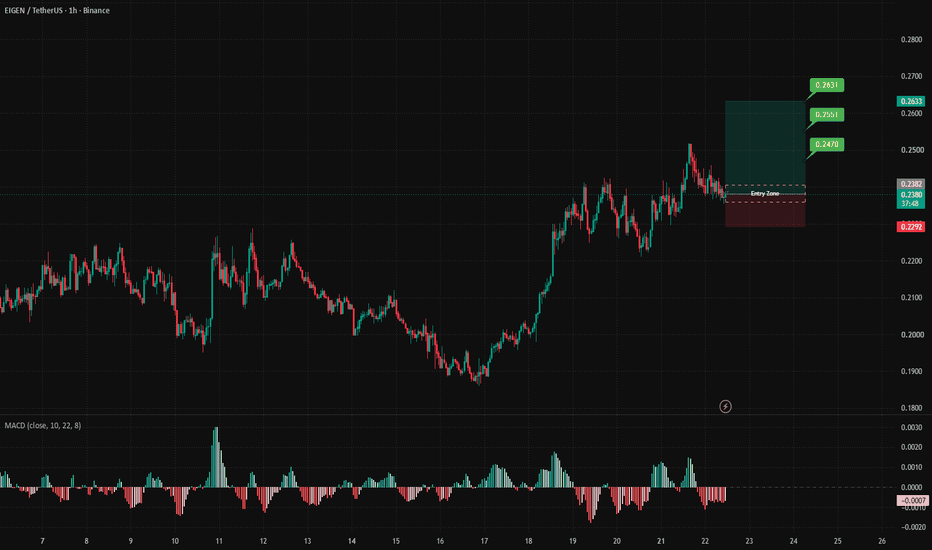
EIGEN ForecastBINANCE:EIGENUSDT The reason for selecting this setup is that the overall trend on the higher timeframe remains bullish, while on the lower timeframe we’re seeing a reasonable correction within that broader structure. This gives us room to expect another move to the upside. There is also a clear positive stimulus on the lower timeframe, which adds further support to the bullish scenario.
As always, proper risk management remains essential.
⚠️ Risk Disclaimer
This is just our market view, not
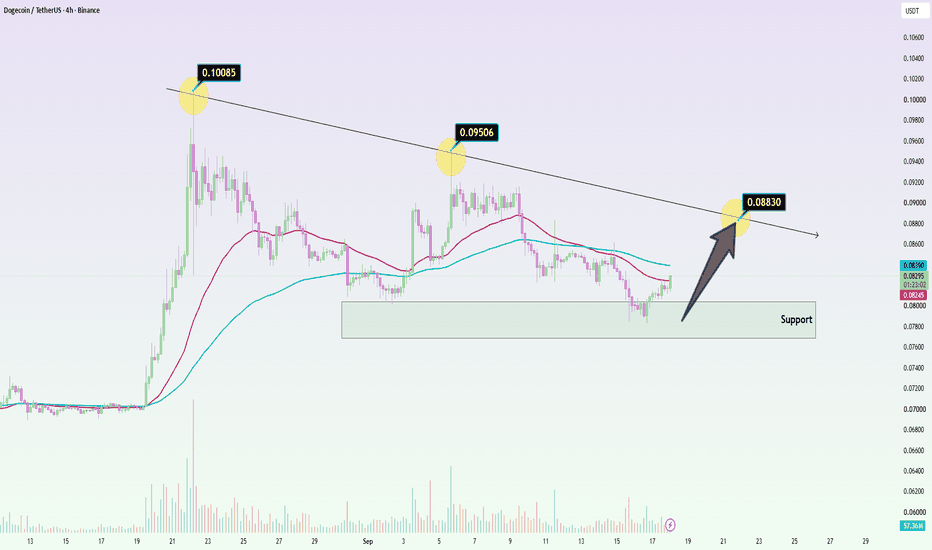
DOGEUSDT: Recovery Below the Trendline!DOGEUSDT is trading around 0.0829 USDT after bouncing back from the 0.0780–0.0805 support zone. This area has repeatedly attracted buying interest, and the current reaction indicates that sellers have failed to break this critical support structure.
Technically, the price is attempting to reclaim the EMA34 (around 0.0825) and move toward the EMA89 (near 0.0839). If DOGE maintains a "higher low" above the support zone and reclaims the 0.0840–0.0850 level, I lean toward the scenario of a continue
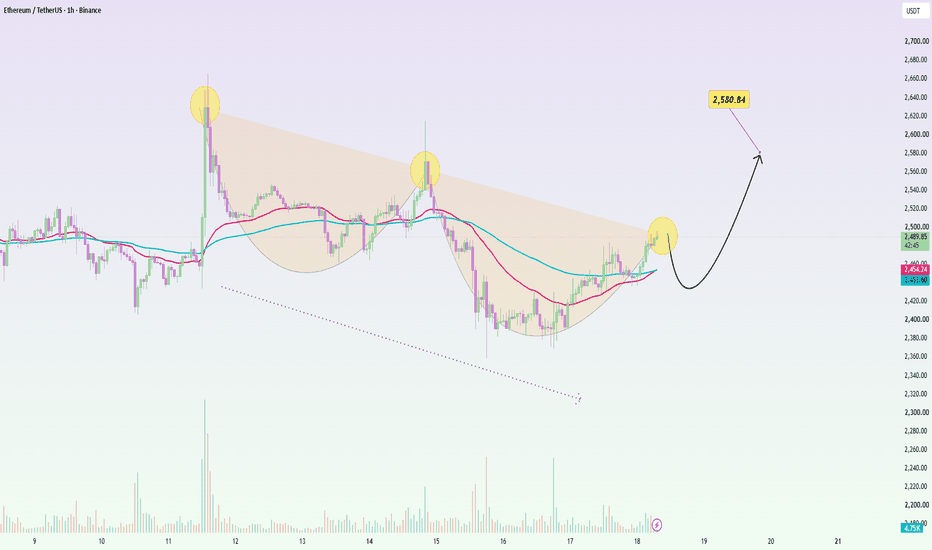
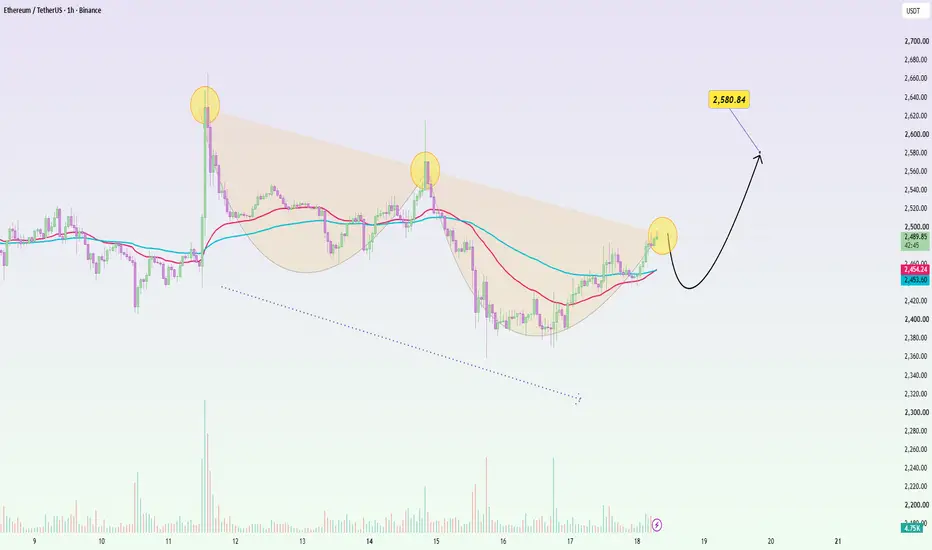
ETHUSDT: Bottom Structure, Recovery PhaseETHUSDT is trading around 2,492 USDT following a strong recovery from the 2,380–2,400 zone. The price has now reclaimed both the EMA34 and EMA89 (around 2,454), while the short-term structure is forming a distinct rounded bottom.
The 2,450–2,470 range is the area I am watching should a pullback occur. If the price holds above the EMA cluster and establishes a "higher low" here, the likelihood of breaking out past the 2,500–2,520 zone increases. In that event, the next target could extend to 2,5
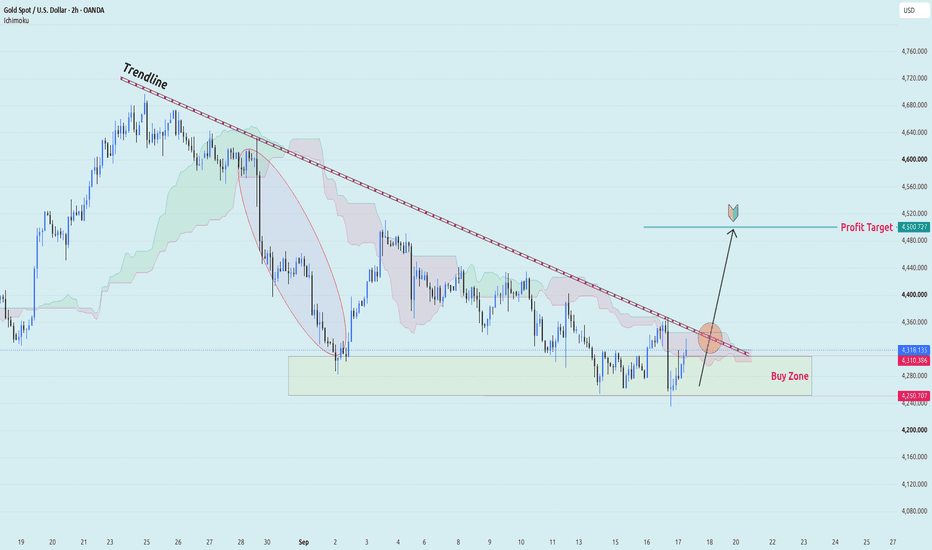
XAU/USD: Defends the Floor, Buyers Reclaim 4,500XAUUSD is reacting from the 4,250–4,310 buy zone, but price is still trapped below the long descending trendline and beneath the Ichimoku structure. This keeps the broader pressure bearish, while the current setup remains a conditional recovery trade.
If buyers continue to defend the zone and Gold breaks and holds above the descending trendline, I’m watching:
🎯 Target: 4,500
Macro Market: The Fed has now raised rates and signaled that further tightening remains possible. The decision push
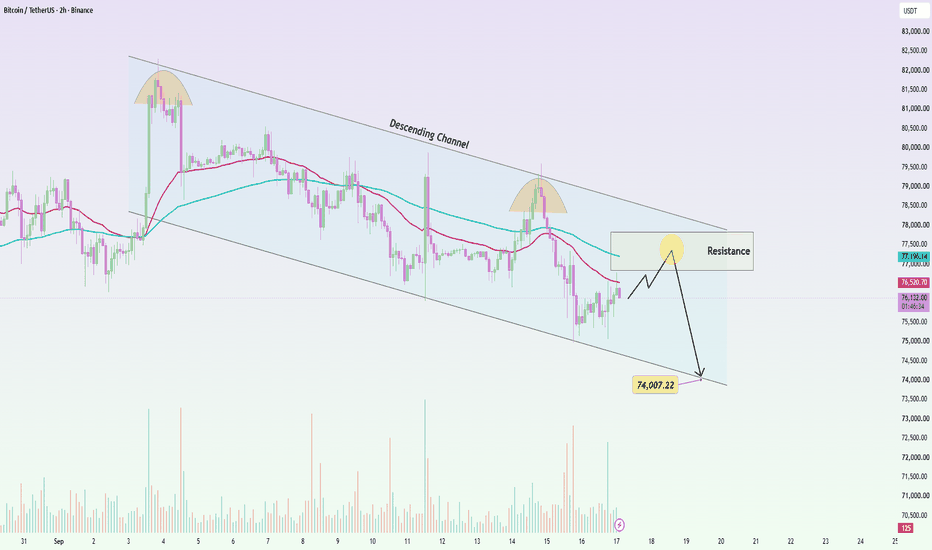
BTCUSDT: Bearish Take Control, Downward Wave!BTCUSDT is trading around 76,230 USDT and remains within a descending channel. The current rebound lacks the strength to alter the market structure, as the price stays below the EMA34 (approx. 76,530) and EMA89 (approx. 77,200), while the pattern of lower highs persists.
The 76,800–77,800 zone is a critical resistance area to watch. If BTC rallies to this region but faces rejection below the EMA cluster and the channel's upper boundary, I lean towards a scenario where the price drops to 75,000,
DOGEUSDT: Sideways Breakdown, Downside Risk PersistsDOGEUSDT is trading around 0.0802 USDT after breaking below a multi-day sideways range. The price is currently sitting below both the EMA34 (approx. 0.0819) and EMA89 (approx. 0.0833), indicating a clear shift in the H1 market structure toward the bearish side.
The 0.0815–0.0830 zone now serves as a key resistance area for a potential retest. If DOGE rallies but fails to reclaim the breakdown zone and the EMA cluster, I lean toward a scenario where the price continues to drop to 0.0790, subsequ
SOLUSDT: Downward pressure, Bears ContinueSOLUSDT is trading around 102.1 USDT after facing rejection once again at the resistance trendline extending from the 107 level. The price has yet to break the sequence of lower highs, indicating that sellers remain in control of the upside.
The 103.5–104.5 zone currently serves as a critical resistance area. If SOL attempts a rebound but fails at this level—subsequently losing the EMA34–EMA89 cluster around 101.7–102.0—I lean towards a scenario where the price drops to 100 USDT and extends tow
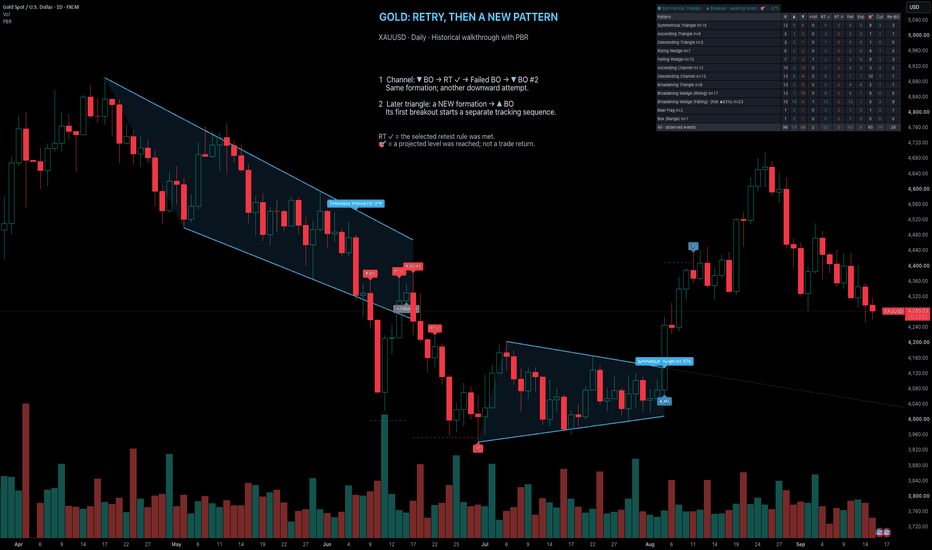
HOW-TO: Read Breakout Retries and New Patterns on GoldA second breakout inside the same formation and the first breakout of a new formation are different events. This historical XAUUSD daily example shows how to distinguish them with Pattern Breakout & Retest .
1. Follow the descending channel
The first structure is a five-touch descending channel, marked Q70. Price closes below its lower boundary and PBR records ▼ BO. A later RT ✓ confirms the selected retest rule. This chart uses “Touch = retest” with a sloped retest/failure reference, so the c
XAG/USD - Broken Trendline Keeps Price BelowOANDA:XAGUSD has already broken below the rising trendline and is now trading beneath the 68.54–70.34 sell zone. The rebound remains limited around the Ichimoku structure, so the H4 setup still favors a deeper correction if sellers defend this resistance.
If price fails to reclaim 68.54, I’m watching:
🎯 Target 1: 64.94
🎯 Target 2: 63.44
Macro Market: Brent above $100 and the US 10-year yield near 4.84% are keeping inflation and Fed-tightening risks elevated. So macro is mixed rather tha
SOLUSDT: Bearish Wave ContinuesSOLUSDT is trading around 101.8 USDT after breaking below the neckline of a Head & Shoulders pattern. The Left Shoulder – Head – Right Shoulder structure is clearly defined, and the price currently sits below the EMA34/89 cluster (around 103.2–103.3), indicating that short-term selling pressure dominates.
The 102.5–103.5 zone is a key area to watch for a retest. If SOL rallies but fails to reclaim the EMA cluster and the neckline, I lean towards a scenario where the price continues to drop to t
BTCUSDT: Channel Breakout, Bulls Push HigherBTCUSDT is trading around 77,930 USDT after breaking out of a descending channel and briefly pushing toward the 79,200 level. The current pullback is bringing the price back to retest the breakout zone around 77,700–78,000, an area that also converges with a cluster of short-term EMAs.
If BTC holds this zone and buying pressure returns, I lean toward a scenario where the price continues to recover to 79,200–79,500, subsequently extending toward the primary target near 80,500 USDT. Losing the 77
ETHUSDT: Trendline Caps Price, Bearish WaveETHUSDT is trading around 2,476 USDT, continuing to form lower highs beneath the resistance trendline. The price also remains below the EMA34–EMA89 cluster (approx. 2,483–2,484), indicating that the rebound lacks the strength to reverse the short-term structure.
The 2,485–2,510 range is a critical area to watch. If ETH rallies to this zone but faces rejection at the trendline and EMA cluster, I lean towards a scenario where the price drops back to 2,440, subsequently extending toward the 2,390
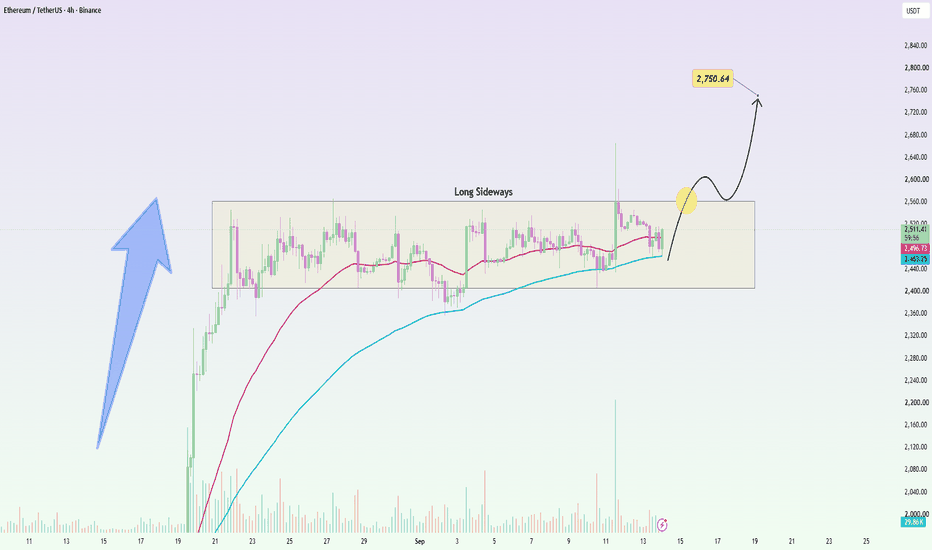
ETHUSDT: Bulls Hold Ground, Breakout PotentialETHUSDT is trading around 2,511 USDT following weeks of consolidation within the 2,400–2,560 range. A positive sign is that the price remains above the EMA34 (approx. 2,468) and EMA89 (approx. 2,463), indicating that buyers have not lost the H4 market structure.
The 2,550–2,570 zone is currently critical. If ETH achieves a decisive breakout above the range's upper limit—followed by a retest where this area holds as support—I lean towards an extension to the 2,620–2,650 level before targeting th
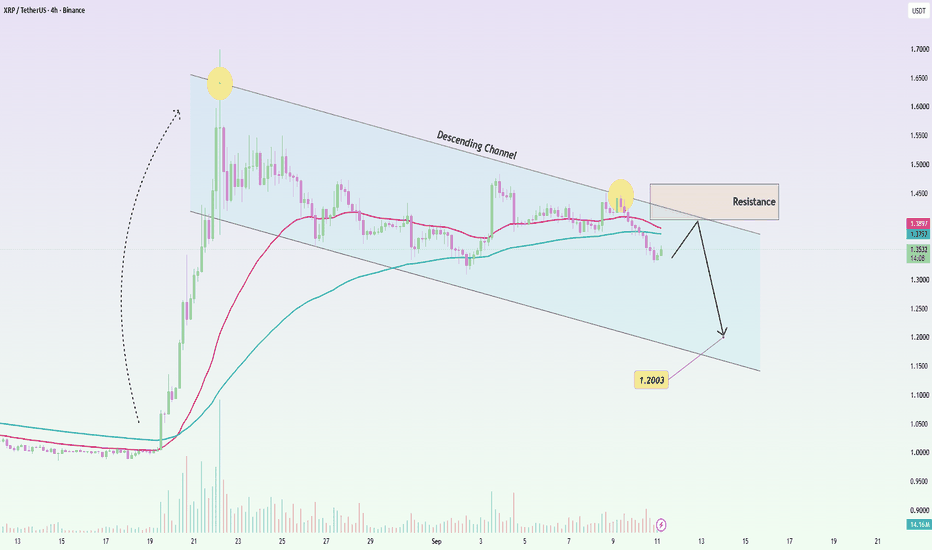
XRPUSDT: Bearish Channel Remains in ControlXRPUSDT is trading around 1.355 USDT and remains within a descending channel on the 4-hour (H4) chart. After multiple failed attempts to break the 1.44–1.46 zone, the price has dropped below both the EMA34 (near 1.390) and the EMA89 (near 1.380), indicating that short-term momentum remains bearish.
The 1.38–1.45 zone now acts as key resistance. If XRP rebounds but faces rejection below the EMA cluster and the upper boundary of the descending channel, I lean towards a scenario where the price dr
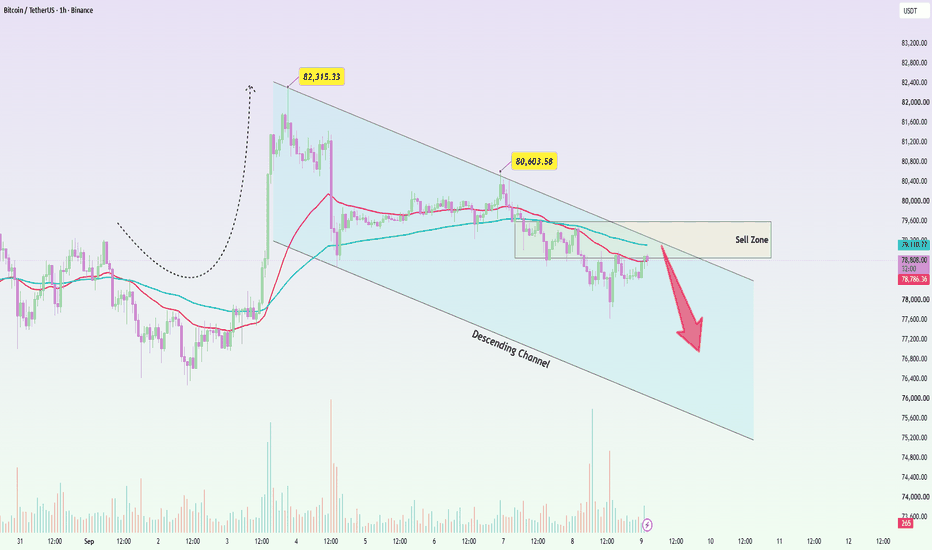
BTCUSDT: Lower Highs Prevail, Next Bearish SignalBTCUSDT is trading around 78,780 USDT and remains confined within a descending channel. Following the peak at 82,315, the most recent rebound reached only about 80,604, indicating that the "lower high" structure remains intact.
The 78,800–79,500 range is currently my primary focus, as it represents a confluence of a sell zone, the EMA34–EMA89 moving averages, and the upper boundary of the descending channel. If BTC attempts to rally but fails at this level, I lean towards a scenario where the p
Ethereum Price Analysis: Weekly Harmonic Structure DevelopingEthereum (ETH) price action is showing early indications of a potential higher-timeframe harmonic pattern developing on the weekly chart. Price has recently established support above the $2,383 region, which previously acted as a significant resistance level. Maintaining this area could be important for the continuation of the current technical structure.
If ETH remains above $2,383 and continues to develop constructive price action, the possibility of a move towards higher-timeframe resistance
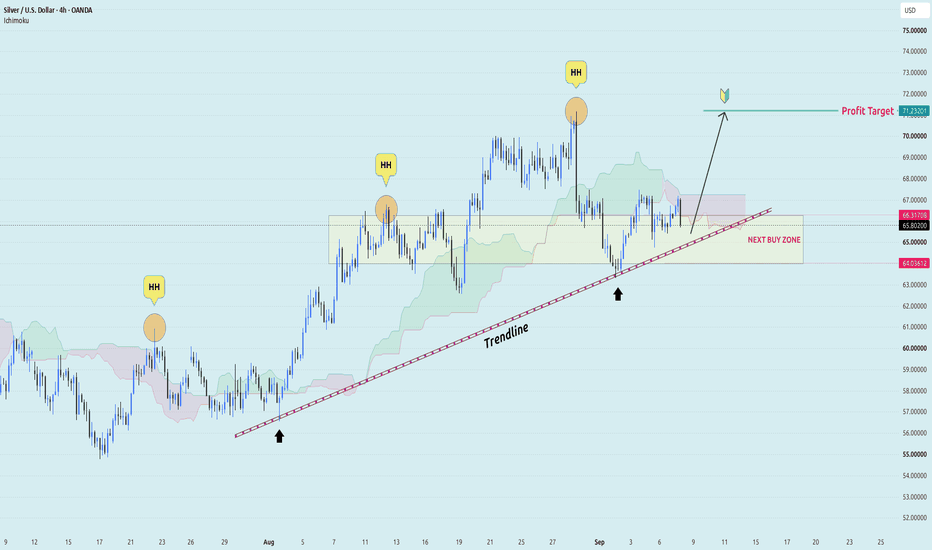
XAG/USD - Trendline Holds, 71.2 Remains for BullsGood day, Traders!
OANDA:XAGUSD is still maintaining a constructive H4 structure despite the recent pullback. Price continues to respect the rising trendline, while the broader sequence of higher highs shows that buyers have not fully lost control.
The key area I’m watching is 64.03–66.31. This zone lines up with the rising trendline and the nearby Ichimoku structure, making it the main area where I want to see buyers step back in.
If price continues to hold above this support and bullis