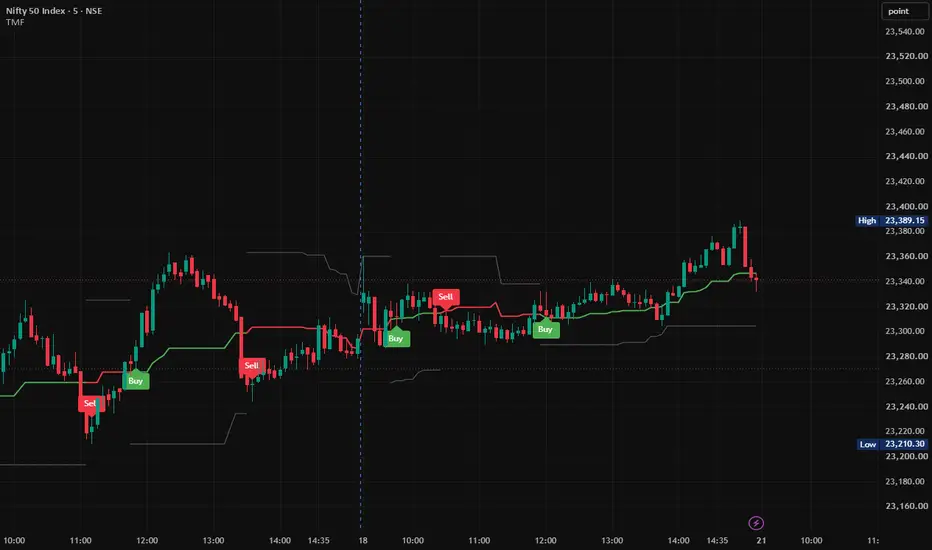
Supertrend Volatility LineSupertrend Volatility Line displays an ATR-based trend reference and a yellow pullback observation zone on the price chart. It is a visual indicator, not an automated strategy. Green identifies the bullish state, red identifies the bearish state, and the yellow band shows a volatility-scaled area next to the active line where users can observe a price retracement.
How it works
The calculation uses the chart's own timeframe and a fixed 14-bar Wilder ATR. ATR measures the size of price fluctuatio
אינדיקטור