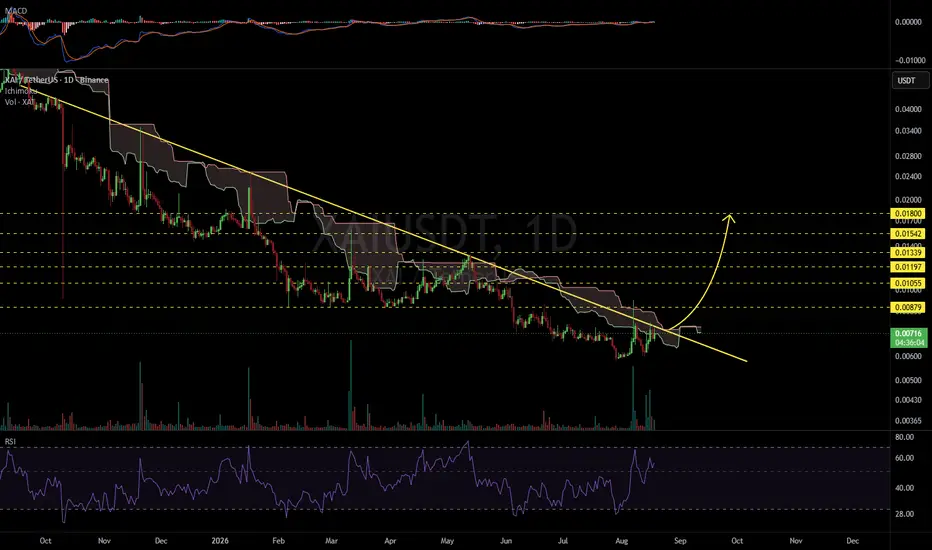
XAIUSDT 1D#XAI is testing the long-term descending resistance trendline along with the Ichimoku Cloud. Keep a close eye on the price action. In case of a solid breakout above these resistance levels, the potential upside targets are:
🎯 $0.00879
🎯 $0.01055
🎯 $0.01197
🎯 $0.01339
🎯 $0.01542
🎯 $0.01800
⚠️ Alway
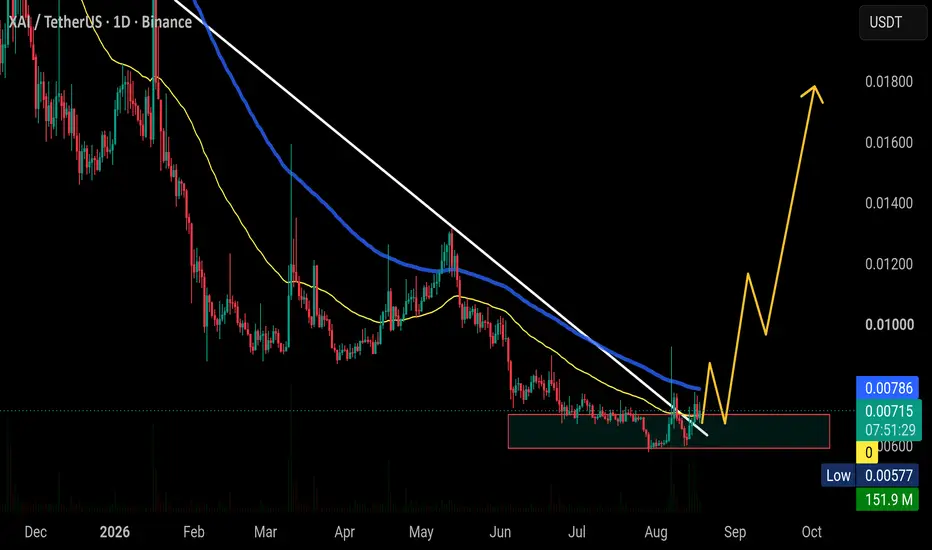
Can #XAI still rise?📊Can #XAI still rise?
🧠From a structural perspective, we are currently testing the S/R zone near the support line. We first need to see how it performs as support, so the probability of continued upward movement from here is relatively high.
➡️Market sentiment and trading volume are very good, so
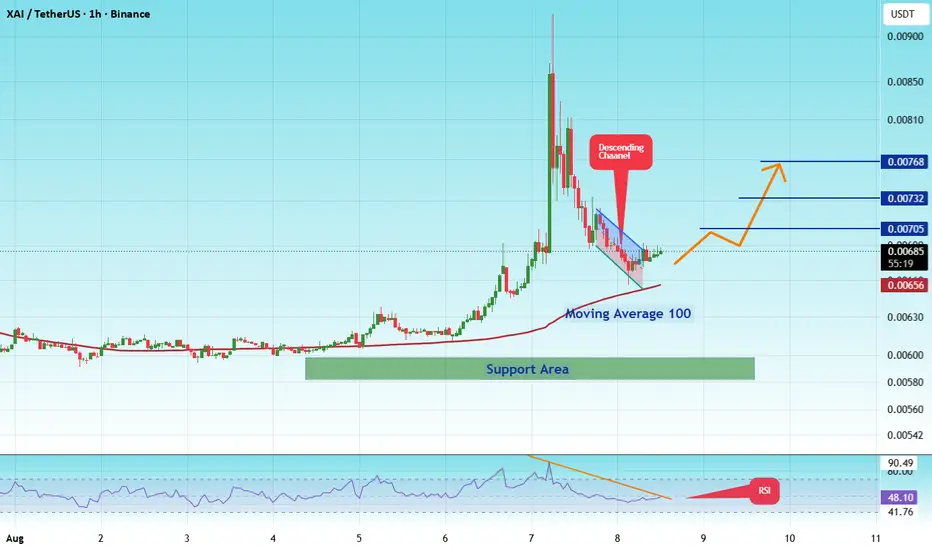
#XAIUSDT — Descending Triangle: Ready for Takeoff or Breakdow#XAI
The price is moving within a descending channel on the 1-hour timeframe and has reached the lower boundary. It is now poised for a bounce and is expected to retest this boundary.
The Relative Strength Index (RSI) indicates a downward trend, which is likely to continue given the overbought con
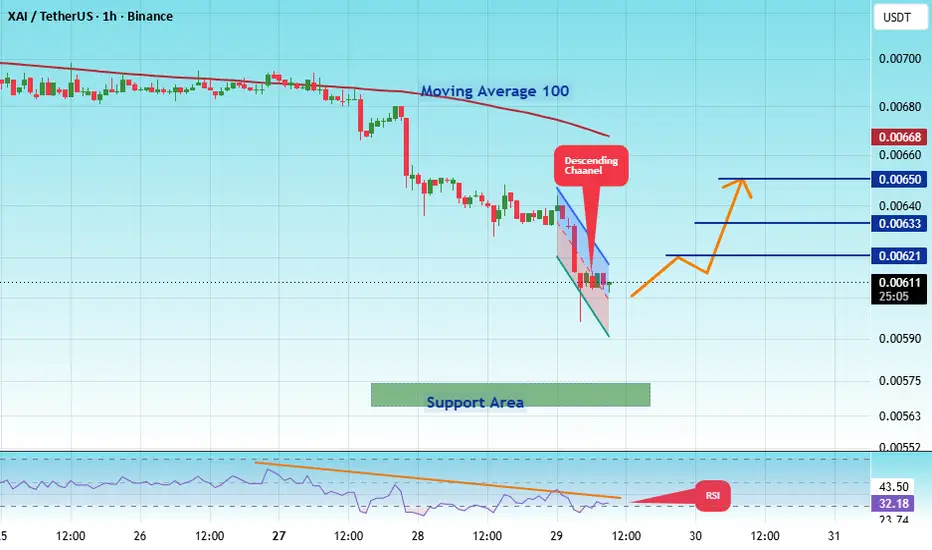
#XAIUSDT — Descending Triangle: Ready for Takeoff or Breakdow#XAI
The price is moving within a descending channel on the 1-hour timeframe and has reached the lower boundary. It is now poised for a bounce and is expected to retest this boundary.
The Relative Strength Index (RSI) indicates a downward trend, which is likely to continue given the overbought con
#XAIUSDT — Descending Triangle: Ready for Takeoff or Breakdow#XAI
The price is moving within a descending channel on the 1-hour timeframe and has reached the lower boundary. It is now poised for a bounce and is expected to retest this boundary.
The Relative Strength Index (RSI) indicates a downward trend, which is likely to continue given the overbought con
#XAIUSDT — Descending Triangle: Ready for Takeoff or Breakdow#XAI
The price is moving within a descending channel on the 1-hour timeframe and has reached the lower boundary. It is now poised for a bounce and is expected to retest this boundary.
The Relative Strength Index (RSI) indicates a downward trend, which is likely to continue given the overbought con
XAI/USDT (4h) Approaching the Apex of a Descending TriangleXAI/USDT is compressing inside a descending triangle on the 4H chart, with price gradually approaching the apex.
A confirmed breakout above the descending resistance could signal a bullish reversal. A breakdown below horizontal support would confirm bearish continuation and open the way for further
#XAIUSDT — Descending Triangle: Ready for Takeoff or Breakdow#XAI
The price is moving within a descending channel on the 1-hour timeframe and has reached the lower boundary. It is now poised for a bounce and is expected to retest this boundary.
The Relative Strength Index (RSI) indicates a downward trend, which is likely to continue given the overbought con
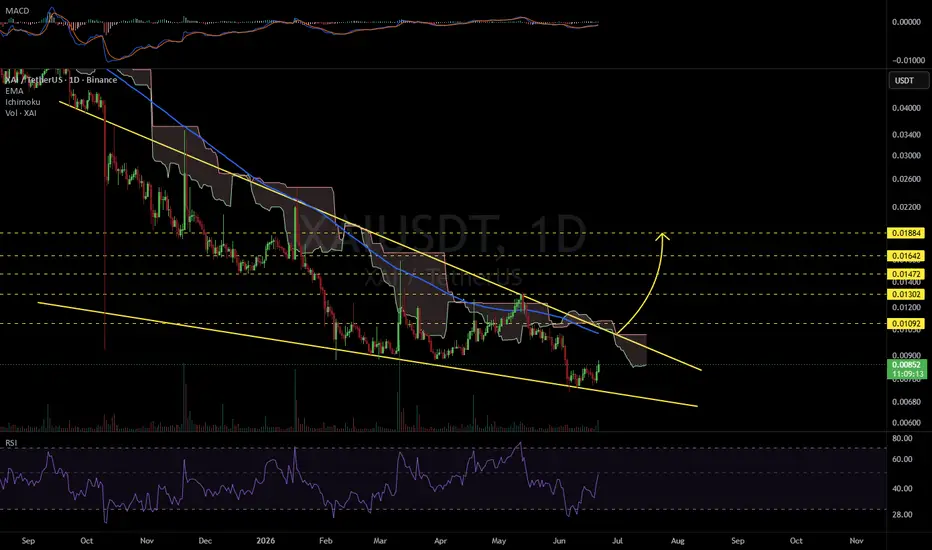
XAIUSDT 1D#XAI is moving inside a falling wedge pattern on the daily chart. In case of a breakout above the resistance cluster, which consists of the wedge resistance, the Ichimoku Cloud, and the daily EMA100, the potential upside targets are:
🎯 $0.01092
🎯 $0.01302
🎯 $0.01472
🎯 $0.01642
🎯 $0.01884
⚠️ Always
See all ideas
Summarizing what the indicators are suggesting.
Oscillators
Neutral
SellBuy
Strong sellStrong buy
Strong sellSellNeutralBuyStrong buy
Oscillators
Neutral
SellBuy
Strong sellStrong buy
Strong sellSellNeutralBuyStrong buy
Summary
Neutral
SellBuy
Strong sellStrong buy
Strong sellSellNeutralBuyStrong buy
Summary
Neutral
SellBuy
Strong sellStrong buy
Strong sellSellNeutralBuyStrong buy
Summary
Neutral
SellBuy
Strong sellStrong buy
Strong sellSellNeutralBuyStrong buy
Moving Averages
Neutral
SellBuy
Strong sellStrong buy
Strong sellSellNeutralBuyStrong buy
Moving Averages
Neutral
SellBuy
Strong sellStrong buy
Strong sellSellNeutralBuyStrong buy
Displays a symbol's price movements over previous years to identify recurring trends.