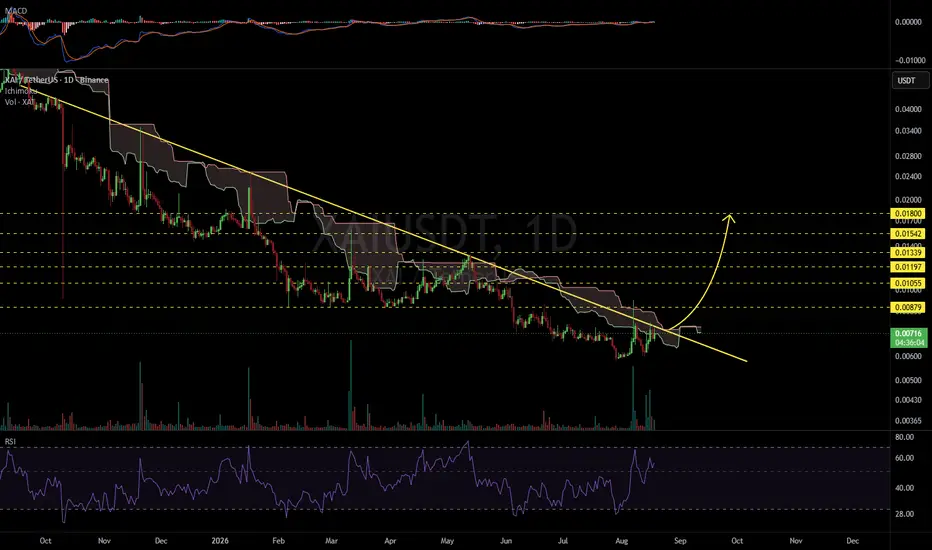
XAIUSDT 1D#XAI is testing the long-term descending resistance trendline along with the Ichimoku Cloud. Keep a close eye on the price action. In case of a solid breakout above these resistance levels, the potential upside targets are:
🎯 $0.00879
🎯 $0.01055
🎯 $0.01197
🎯 $0.01339
🎯 $0.01542
🎯 $0.01800
⚠️ Always use a tight stop-loss and apply proper risk management.
In-depth trading ideas
Can #XAI still rise?📊Can #XAI still rise?
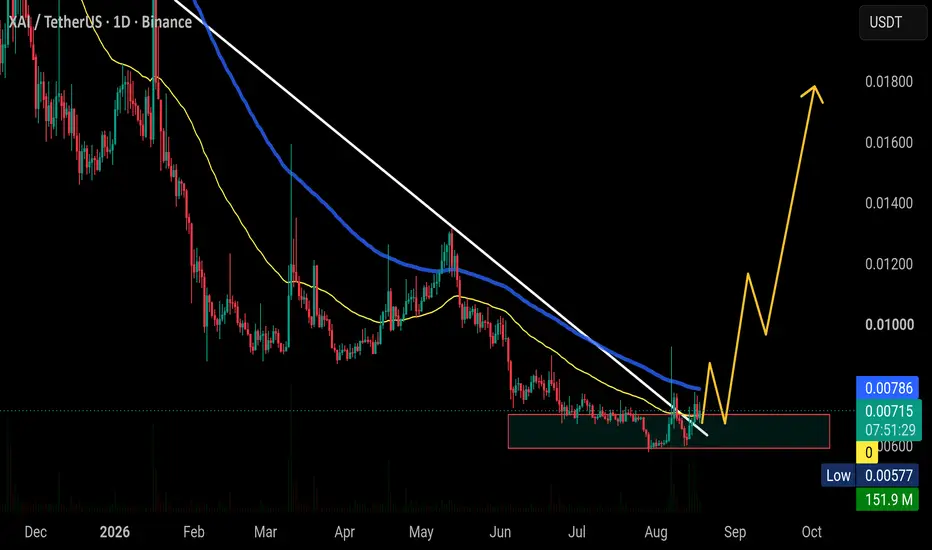
🧠From a structural perspective, we are currently testing the S/R zone near the support line. We first need to see how it performs as support, so the probability of continued upward movement from here is relatively high.
➡️Market sentiment and trading volume are very good, so the primary outlook is bullish.
🤜Follow me, and I will guide you through market changes. Remember to like💖 and share💬
BYBIT:XAIUSDT.P
#XAIUSDT — Descending Triangle: Ready for Takeoff or Breakdow#XAI
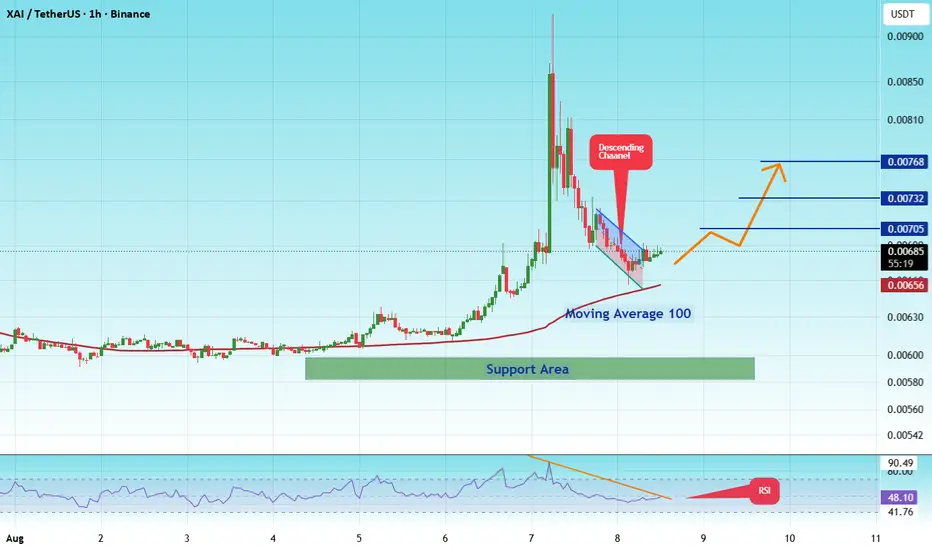
The price is moving within a descending channel on the 1-hour timeframe and has reached the lower boundary. It is now poised for a bounce and is expected to retest this boundary.
The Relative Strength Index (RSI) indicates a downward trend, which is likely to continue given the overbought conditions.
A key support zone (in green) has been identified at 00580. The price has bounced off this zone several times, making it a strong support level.
The price is trending towards the 100-period moving average, which we are approaching. This trend supports an upward move.
Entry Price: 0.00686
Target 1: 0.00705
Target 2: 0.00732
Target 3: 0.00768
You can close at the second target or wait for the third target. The choice is yours.
Stop Loss: At the resistance zone (in green).
Remember this simple rule: Money Management.
Any questions? Please leave a comment.
Thank you.
#XAIUSDT — Descending Triangle: Ready for Takeoff or Breakdow#XAI
The price is moving within a descending channel on the 1-hour timeframe and has reached the lower boundary. It is now poised for a bounce and is expected to retest this boundary.
The Relative Strength Index (RSI) indicates a downward trend, which is likely to continue given the overbought conditions.
There is a key support zone (in green) at 0.00708. The price has bounced off this zone several times, making it a strong support level.
The price is trending towards the 100-period moving average, which we are approaching. This trend supports an upward move.
Entry Price: 0.00810
Target 1: 0.00835
Target 2: 0.00861
Target 3: 0.00900
Stop Loss: At the resistance zone (in green)
Remember this simple rule: Money management.
Any questions? Please leave a comment.
Thank you.
#XAIUSDT — Descending Triangle: Ready for Takeoff or Breakdow#XAI
The price is moving within a descending channel on the 1-hour timeframe and has reached the lower boundary. It is now poised for a bounce and is expected to retest this boundary.
The Relative Strength Index (RSI) indicates a downward trend, which is likely to continue given the overbought conditions.
There is a key support zone (in green) at 0.00700. The price has bounced off this zone several times, making it a strong support level.
The price is trending towards the 100-period moving average, which we are approaching. This trend supports an upward move.
Entry Price: 0.00730
Target 1: 0.00742
Target 2: 0.00756
Target 3: 0.00774
Stop Loss: At the resistance zone (in green)
Remember this simple rule: Money management.
Any questions? Please leave a comment.
Thank you.
#XAIUSDT — Descending Triangle: Ready for Takeoff or Breakdow#XAI
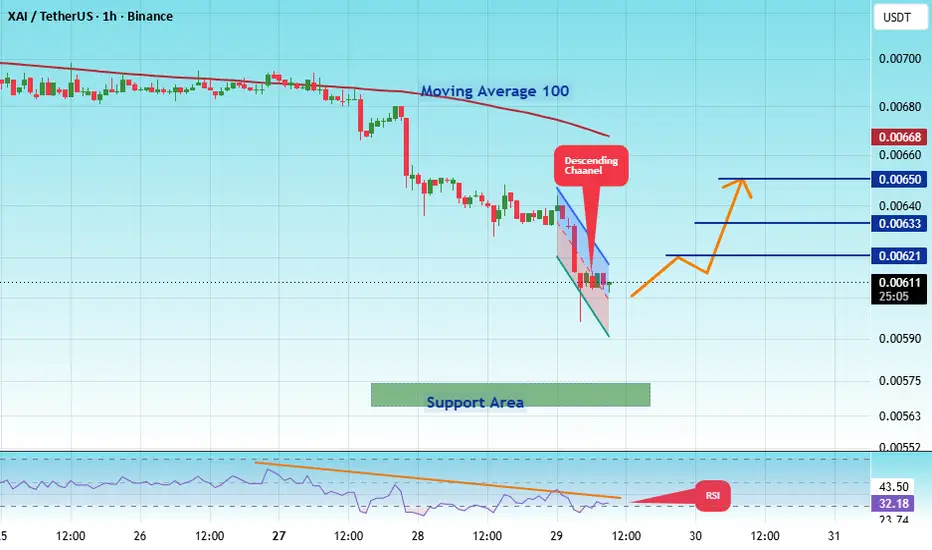
The price is moving within a descending channel on the 1-hour timeframe and has reached the lower boundary. It is now poised for a bounce and is expected to retest this boundary.
The Relative Strength Index (RSI) indicates a downward trend, which is likely to continue given the overbought conditions.
There is a key support zone in green at 0.00567. The price has bounced off this zone several times, making it a strong support level.
The price is trending towards the 100-period moving average, which we are approaching. This trend supports an upward move.
Entry Price: 0.00611
Target 1: 0.00621
Target 2: 0.00633
Target 3: 0.00650
Stop Loss: At the resistance zone in green
Remember this simple rule: Money Management.
Any questions? Please leave a comment.
Thank you.
XAI/USDT (4h) Approaching the Apex of a Descending TriangleXAI/USDT is compressing inside a descending triangle on the 4H chart, with price gradually approaching the apex.
A confirmed breakout above the descending resistance could signal a bullish reversal. A breakdown below horizontal support would confirm bearish continuation and open the way for further downside.
#XAIUSDT — Descending Triangle: Ready for Takeoff or Breakdow#XAI
The price is moving within a descending channel on the 1-hour timeframe and has reached the lower boundary. It is now poised for a bounce and is expected to retest this boundary.
The Relative Strength Index (RSI) indicates a downward trend, which is likely to continue given the overbought conditions.
There is a key support zone in green at 0.00647. The price has bounced off this zone several times, making it a strong support level.
The price is trending towards the 100-period moving average, which we are approaching. This trend supports an upward move.
Entry Price: 0.00670
Target 1: 0.00683
Target 2: 0.00695
Target 3: 0.00708
Stop Loss: At the resistance zone in green
Remember this simple rule: Money management.
Any questions? Please leave a comment.
Thank you.
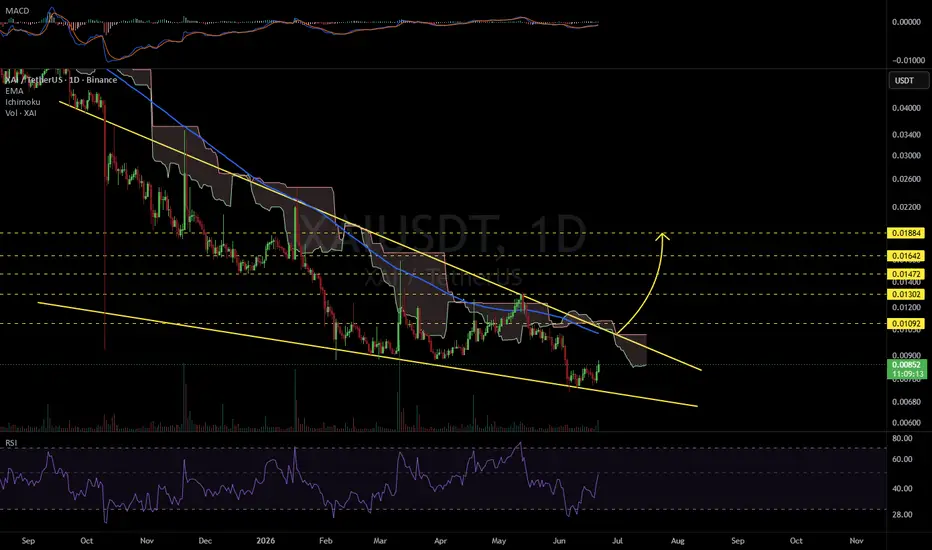
XAIUSDT 1D#XAI is moving inside a falling wedge pattern on the daily chart. In case of a breakout above the resistance cluster, which consists of the wedge resistance, the Ichimoku Cloud, and the daily EMA100, the potential upside targets are:
🎯 $0.01092
🎯 $0.01302
🎯 $0.01472
🎯 $0.01642
🎯 $0.01884
⚠️ Always remember to use a tight stop-loss and maintain proper risk management.
XAIUSDT Forming Bullish MomentumXAIUSDT is forming a clear bullish momentum pattern, a classic bullish wave signal that often indicates an upcoming breakout. The price has been consolidating within a narrowing range, suggesting that selling pressure is weakening while buyers are beginning to regain control. With consistent volume confirming accumulation at lower levels, the setup hints at a potential bullish breakout soon. The projected move could lead to an impressive gain of around 60% to 70% once the price breaks above the wedge resistance.
This bullish momentum pattern is typically seen at the end of downtrends or corrective phases, and it represents a potential shift in market sentiment from bearish to bullish. Traders closely watching XAIUSDT are noting the strengthening momentum as it nears a breakout zone. The strong trading volume adds confidence to this pattern, showing that market participants are positioning early in anticipation of a reversal.
Investors’ growing interest in XAIUSDT reflects rising confidence in the project's long-term fundamentals and current technical strength. If the breakout confirms with sustained volume, this could mark the start of a fresh bullish leg. The current market structure suggests that buyers are steadily gaining control while bearish pressure continues to weaken.
Traders might find this a valuable setup for medium-term gains, especially as the bullish momentum pattern completes and buying momentum accelerates. A confirmed breakout could attract additional attention from market participants and potentially push the price toward significantly higher targets over the coming weeks.
✅ Show your support by hitting the like button!
✅ Leaving a comment below! (What is your opinion about this Coin?)
Your feedback and engagement keep me inspired to share more insightful market analysis with you!
#XAIUSDT — Descending Triangle: Ready for Takeoff or Breakdow#XAI
The price is moving within a descending channel on the 1-hour timeframe and has reached the lower boundary. It is now poised for a bounce and is expected to retest this boundary.
The Relative Strength Index (RSI) indicates a downward trend, which is likely to continue given the overbought conditions.
A key support zone has been identified in green at 0.00712. The price has bounced off this zone several times, making it a strong support level.
The price is trending towards the 100-period moving average, which we are approaching. This trend supports an upward move.
Entry Price: 0.00786
Target 1: 0.00805
Target 2: 0.00821
Target 3: 0.00851
You can close at the second target or wait for the third target. The choice is yours.
Stop Loss: At the resistance zone in green.
Remember this simple rule: Money Management.
Any questions? Please leave a comment.
Thank you.
#XAIUSDT — Descending Triangle: Ready for Takeoff or Breakdow#XAI
The price is moving within a descending channel on the 1-hour timeframe and has reached the lower boundary. It is now poised for a bounce and is expected to retest this boundary.
The Relative Strength Index (RSI) indicates a downward trend, which is likely to continue given the overbought conditions.
There is a key support zone (in green) at 0.00705. The price has bounced off this zone several times, making it a strong support level.
The price is trending towards the 100-period moving average, which we are approaching. This trend supports an upward move.
Entry Price: 0.00760
Target 1: 0.00797
Target 2: 0.00820
Target 3: 0.00850
Stop Loss: At the resistance zone (in green)
Remember this simple rule: Money management.
Any questions? Please leave a comment.
Thank you.
#XAIUSDT — Descending Triangle: Ready for Takeoff or Breakdow#XAI
The price is moving within a descending channel on the 1-hour timeframe and has reached the lower boundary. It is now poised for a bounce and is expected to retest this boundary.
The Relative Strength Index (RSI) indicates a downward trend, which is likely to continue given the overbought conditions.
There is a key support zone (in green) at 0.00923. The price has bounced off this zone several times, making it a strong support level.
The price is trending towards the 100-period moving average, which we are approaching. This trend supports an upward move.
Entry Price: 0.01020
First Target: 0.01056
Second Target: 0.01096
Third Target: 0.01140
You can stop at the first and second targets and close the price, or continue towards the third target.
Stop Loss: At the resistance zone (in green).
Remember this simple rule: Money Management.
Any questions? Please leave a comment.
Thank you.
#XAIUSDT — Descending Triangle: Ready for Takeoff or Breakdow#XAI
The price is moving within a descending channel on the 1-hour timeframe and has reached the lower boundary. It is now poised for a bounce and is expected to retest this boundary.
The Relative Strength Index (RSI) indicates a downward trend, which is likely to continue given the overbought conditions.
There is a key support zone (in green) at 0.00882. The price has bounced off this zone several times, making it a strong support level.
The price is trending towards the 100-period moving average, which we are approaching. This trend supports an upward move.
Entry Price: 0.01048
First Target: 0.01096
Second Target: 0.01127
Third Target: 0.01173
You can stop at the first and second targets and close below them, or continue towards the third target. Stop Loss: At the resistance zone (in green).
Remember this simple rule: Money Management.
Any questions? Please leave a comment.
Thank you.
#XAIUSDT — Descending Triangle: Ready for Takeoff or Breakdow#XAI
The price is moving within a descending channel on the 1-hour timeframe and has reached the lower boundary. It is now poised for a bounce and is expected to retest this boundary.
The Relative Strength Index (RSI) indicates a downward trend, which is likely to continue given the overbought conditions.
There is a key support zone in green at 0.00875. The price has bounced off this zone several times, making it a strong support level.
The price is trending towards the 100-period moving average, which we are approaching. This trend supports an upward move.
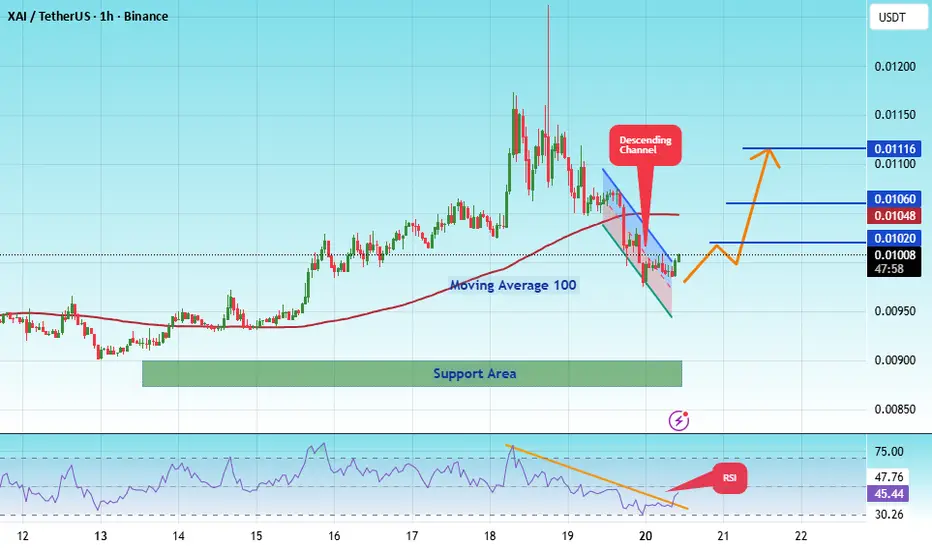
Entry Price: 0.00986
Target 1: 0.01020
Target 2: 0.01060
Target 3: 0.01116
You can stop at the first and second targets and close the price, or continue to the third target. Stop Loss: At the resistance zone in green.
Remember this simple rule: Money Management.
Any questions? Please leave a comment.
Thank you.
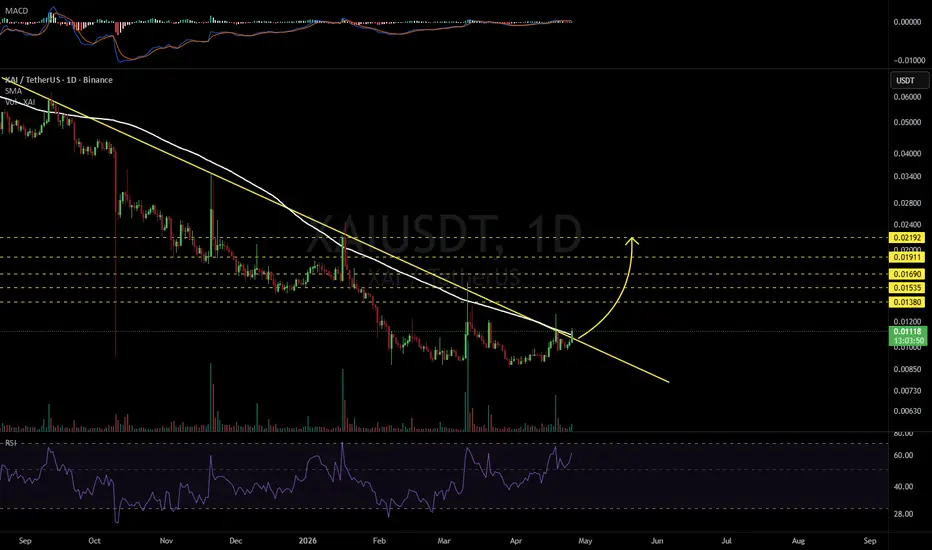
XAIUSDT 1DKeep an eye on the #XAI daily chart. It is attempting to break out above the descending resistance and the daily SMA100. If that occurs, the upside targets are:
🎯 $0.01380
🎯 $0.01535
🎯 $0.01690
🎯 $0.01911
🎯 $0.02192
⚠️ Always remember to use tight stop-losses and maintain proper risk management.
#XAI/USDT — Descending Triangle: Ready for Takeoff or Breakdow#XAI
The price is moving within a descending channel on the hourly timeframe. It has reached the lower boundary and is trending towards a bounce. A retest of this boundary is expected.
The Relative Strength Index (RSI) indicates a downward trend, and this trend is likely to continue due to the overbought condition.
A key support zone (in green) was found at 0.0100, and the price has bounced off this zone several times, making it a strong support level.
The price is trending towards the 100-period moving average, which we are approaching. This trend supports an upward move.
Entry Price: 0.01030
First Target: 0.01047
Second Target: 0.01070
Third Target: 0.01100
Stop Loss: At the resistance zone (in green)
Remember this simple rule: Money management.
Any questions? Please leave a comment.
Thank you.
#XAIUSDT — Descending Triangle: Ready for Takeoff or Breakdow#XAI
The price is moving within a descending channel on the hourly timeframe. It has reached the lower boundary and is trending towards a bounce. A retest of this boundary is expected.
The Relative Strength Index (RSI) indicates a downward trend, and this trend is likely to continue due to the overbought condition.
A key support zone has been identified in green at 0.00880, and the price has bounced off this zone several times, making it a strong support level.
The price is trending towards the 100-period moving average, which we are approaching. This trend supports a potential upward move.
Entry Price: 0.00921
First Target: 0.00932
Second Target: 0.00954
Third Target: 0.00981
Stop Loss: At the resistance zone in green
Remember this simple rule: Money management.
Any questions? Please leave a comment.
Thank you.
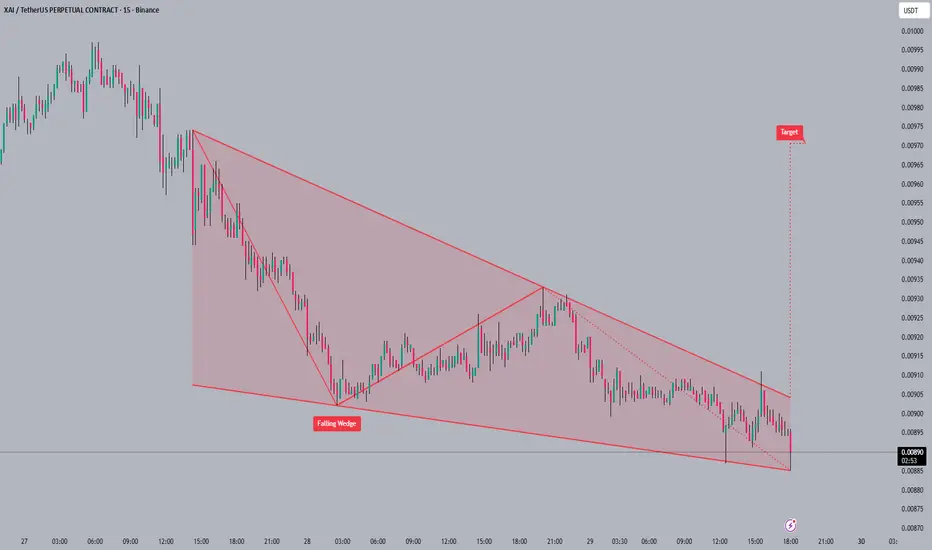
#XAI#XAI is currently testing the lower bounds of a falling wedge 📉 pattern. This pattern is typically bullish, and we can watch for a potential breakout 🚀 to the upside. The next target after a confirmed breakout from this wedge is around 0.0097.
A falling wedge can trap bears 🐻 so wait for confirmation.
#XAI #crypto #trading #altcoin
#XAI/USDT — Descending Triangle: Ready for Takeoff or Breakdow#XAI
The price is moving within a descending channel on the hourly timeframe. It has reached the lower boundary and is trending towards a bounce. A retest of this boundary is expected.
The Relative Strength Index (RSI) indicates a downward trend, and this trend is likely to continue due to the overbought condition.
A key support zone (in green) was found at 01040, and the price has bounced off this zone several times, making it a strong support level.
The price is trending towards the 100-period moving average, which we are approaching. This trend supports an upward move.
Entry Price: 01093
Target 1: 01110
Target 2: 01137
Target 3: 01175
Stop Loss: At the resistance zone (in green)
Remember this simple rule: Money management.
Any questions, please leave a comment.
Thank you.
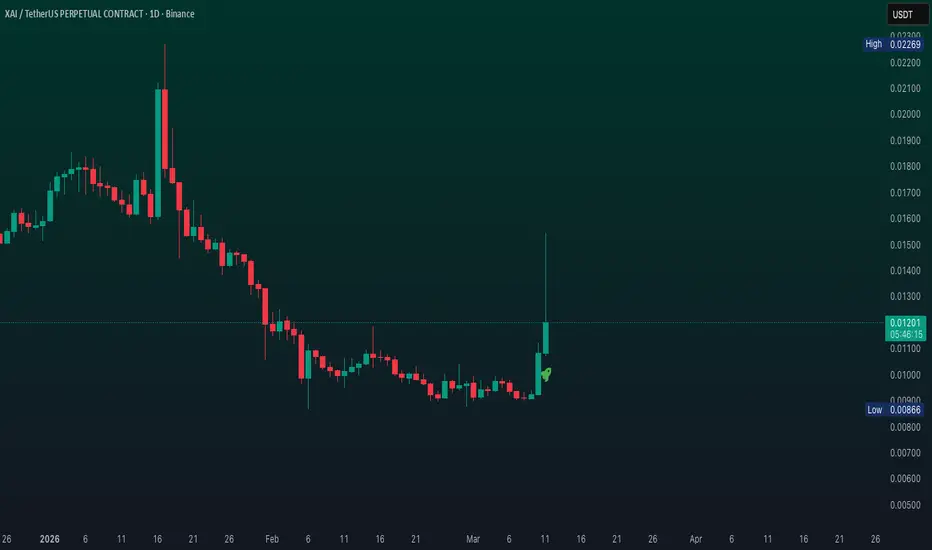
XAI READY FOR MASSIVE COMEBACK🔥 Fortune AI Radar — NASDAQ:XAI
Fresh activity detected on NASDAQ:XAI today.
Data suggests increasing market interest & buyers stepping in.
Technicals currently lean bullish, with momentum trending upward.
Whales showing hints of accumulation and hype rising among trader
XAIUSDT Forming Falling WedgeXAIUSDT is forming a clear falling wedge pattern, a classic bullish reversal signal that often indicates an upcoming breakout. The price has been consolidating within a narrowing range, suggesting that selling pressure is weakening while buyers are beginning to regain control. With consistent volume confirming accumulation at lower levels, the setup hints at a potential bullish breakout soon. The projected move could lead to an impressive gain of around 190% to 200% once the price breaks above the wedge resistance.
This falling wedge pattern is typically seen at the end of downtrends or corrective phases, and it represents a potential shift in market sentiment from bearish to bullish. Traders closely watching XAIUSDT are noting the strengthening momentum as it nears a breakout zone. The good trading volume adds confidence to this pattern, showing that market participants are positioning early in anticipation of a reversal.
Investors’ growing interest in XAIUSDT reflects rising confidence in the project’s long-term fundamentals and current technical strength. If the breakout confirms with sustained volume, this could mark the start of a fresh bullish leg. Traders might find this a valuable setup for medium-term gains, especially as the wedge pattern completes and buying momentum accelerates.
✅ Show your support by hitting the like button and
✅ Leaving a comment below! (What is your opinion about this Coin?)
Your feedback and engagement keep me inspired to share more insightful market analysis with you!