DEXT T3: The trading terminal built for modern tradersYou have three open positions, and BankNifty is having rapid fluctuations. At this time, you need your option chain, live chart, and your order book visible simultaneously, but your trading platform only offers a single window. You are changing tabs, you lose track of strikes, and by the time your order goes through, the move is done.
For most Indian retail traders, this is not an edge case. This happens often during a trade execution when the market experiences rapid fluctuations. The problem
Dhan publications
Adaptive Anchored VWAP: Smarter Pivot-Level ChartsEvery trader wants to know one thing where are the real buyers and sellers stepping in? While support and resistance levels help, they can sometimes feel subjective.
That’s why volume-based tools like Anchored VWAP (Volume Weighted Average Price) have become popular. But markets are dynamic, and so should be our tools.
Enter Adaptive Anchored VWAP (AAVWAP) a smarter way to track pivot levels that truly matter.
What is Adaptive Anchored VWAP?
Anchored VWAP calculates the average price of
Top 5 Essential Indicators for BeginnersBuild a strong foundation with these must-know tools.
Starting out in technical analysis can feel overwhelming. With hundreds of indicators available on platforms like TradingView, where do you begin?
The truth is, you don’t need dozens of tools just a few reliable, beginner-friendly indicators that help you understand market trends, momentum, and entry/exit points.
Here are the top 5 essential indicators every new trader should learn:
1. Moving Average (MA)
Why it matters: Moving Averag
Mastering Volatility: How to Use Average True Range (ATR)Volatility is often seen as a trader’s worst enemy or greatest ally. Knowing how to measure it accurately can give you an edge in both planning entries and managing risk. That’s where the Average True Range (ATR) comes into play. It doesn’t tell you the direction of the market—but it does tell you how much the market is moving. And that makes all the difference in uncertain environments.
Let’s dive into how ATR can become your secret weapon for smarter trading.
What is Average True Range (ATR
Sideways: Identifying Ranges and BreakoutsMaster the quiet before the move.
Not every market moves in strong trends. In fact, many stocks spend a lot of time trading sideways moving within a defined range without making a clear move up or down. While this can frustrate trend-following traders, sideways phases actually offer great setups if you know what to look for.
Understanding how to identify sideways markets, define price ranges, and spot breakouts early can help you enter trades with better timing and stronger conviction.
What
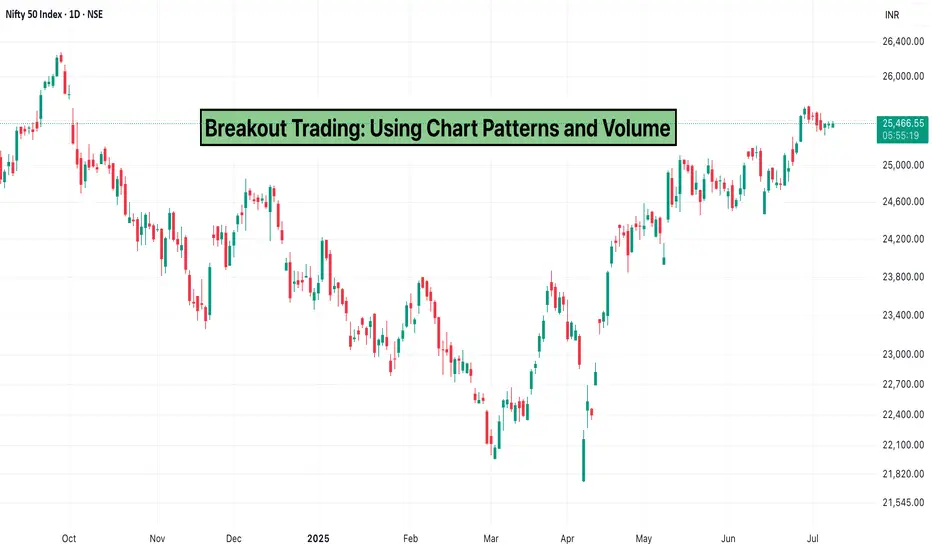
Breakout Trading: Using Chart Patterns and VolumeBreakouts are one of the most exciting moments in a chart—they often signal the beginning of a strong move, whether upward or downward. But not every breakout is real. Some fizzle out. Others turn into fakeouts. So how do you improve your odds?
The key lies in combining chart patterns with volume analysis. When used together, they help you spot breakout opportunities with more clarity and confidence.
What Is Breakout Trading?
Breakout trading is a strategy that focuses on entering a trade wh
How to Use Multi-Timeframe AnalysisTrading stocks successfully isn’t just about spotting a pattern or reading a signal—it’s about understanding the bigger picture. That’s where Multi-Timeframe Analysis (MTFA) becomes one of the most useful tools in your trading toolkit.
Whether you’re an intraday trader or a swing trader, looking at multiple timeframes helps you confirm trends, reduce false entries, and improve the accuracy of your trades. Let’s break down how to use this strategy specifically for stock trading.
Why Use Multip
Choosing the Right Chart for ScalpingIf you're into scalping, you already know how important timing is. One of the most common questions that pops up among scalpers is—should I use a 1-minute chart or a 5-minute chart?
While both charts are designed for short-term trading, the experience of using them is quite different.
The 1-minute chart is all about speed. It shows price action in real-time, updating with every tick. This is great if you’re looking to capitalize on even the smallest moves in the market. But with speed comes n
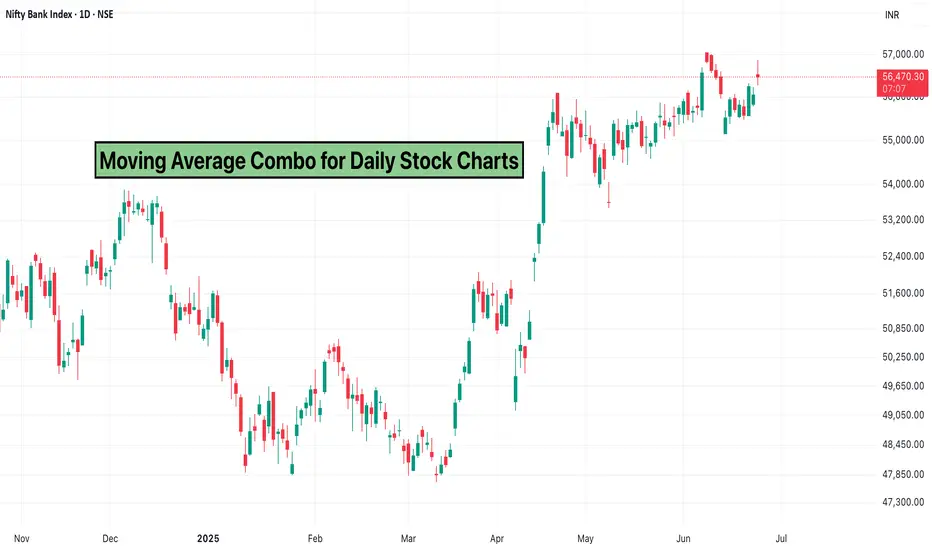
Moving Average Combo for Daily Stock ChartsMoving averages are one of the most fundamental tools in technical analysis, and combining them can give you a clearer picture of trend direction, support/resistance, and momentum.
On daily stock charts, the right moving average combo can help traders identify both short-term and long-term opportunities with more confidence.
Why Use Moving Averages?
Moving averages smooth out price data and help highlight the underlying trend. They can also act as dynamic support or resistance levels and s
Intraday Trading with VWAPThe Volume Weighted Average Price (VWAP) is one of the most trusted tools for intraday traders. Used by institutional and retail traders alike, VWAP helps identify fair value during the trading day and can act as both a dynamic support/resistance and trend guide.
What is VWAP?
VWAP stands for Volume Weighted Average Price. It gives the average price a security has traded at throughout the day, weighted by volume. It resets at the start of each trading session.
Why VWAP Matters in Intraday
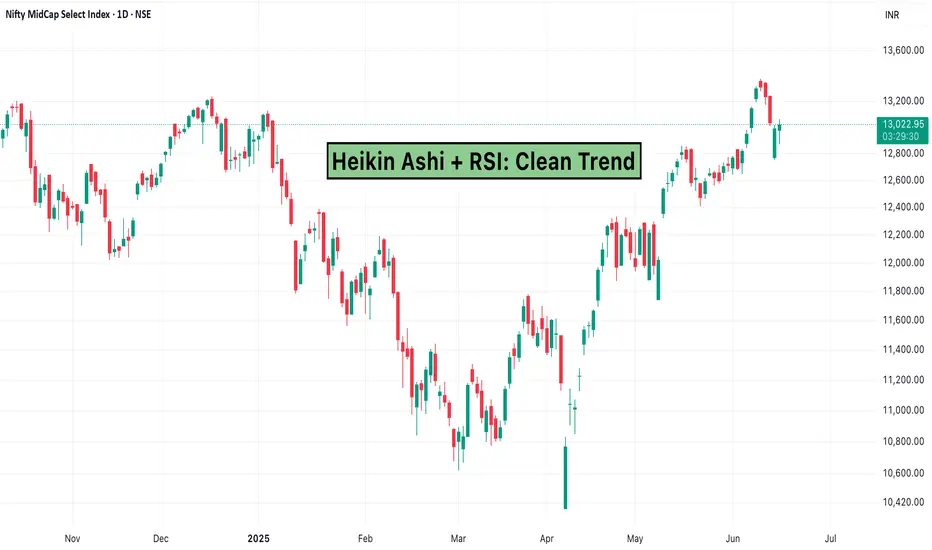
Heikin Ashi + RSI: Clean TrendFor traders who prefer clarity over noise, combining Heikin Ashi candles with the Relative Strength Index (RSI) can help reveal clean trend setups and momentum confirmations.
This duo is especially effective on TradingView for identifying smoother entries and exits.
What is Heikin Ashi?
Heikin Ashi is a chart type that modifies how candles are calculated:
It averages price data to create smoother trends.
Green candles indicate uptrends; red candles suggest downtrends.
Wicks are often
Bollinger Bands + RSI: Spot BreakoutsIf you’re looking for a powerful combo to detect breakout opportunities, pairing Bollinger Bands with the Relative Strength Index (RSI) is a smart move.
This strategy merges volatility tracking with momentum analysis, helping you confirm high-probability entries on TradingView charts.
What Are Bollinger Bands?
Bollinger Bands consist of:
A 20-period Simple Moving Average (middle band)
An upper band (2 standard deviations above the SMA)
A lower band (2 standard deviations below the
Pivot Points Indicator: Daily vs Weekly StrategyPivot Points are a favorite among traders for identifying key support and resistance levels. Used widely in day trading and swing trading, these levels are calculated based on previous price action and are easy to apply on platforms. But should you rely on daily or weekly Pivot Points? Here’s how to decide.
What Are Pivot Points?
Pivot Points are calculated using the high, low, and close of a previous period (day or week). From this, multiple levels are derived:
Pivot Point (P): The cent
Stochastic RSI vs RSIWhen it comes to momentum indicators on TradingView, both RSI and Stochastic RSI offer valuable insights but they operate differently and serve slightly different purposes.
What is RSI?
The Relative Strength Index (RSI) is a momentum oscillator that measures the speed and magnitude of recent price changes. It ranges from 0 to 100:
RSI above 70 suggests overbought conditions.
RSI below 30 indicates oversold conditions.
Often used for spotting reversals, momentum shifts, or trend stre
Utilizing Bollinger Bands for VolatilityBollinger Bands are one of the most popular tools used by traders to assess market volatility and potential price action.
Created by John Bollinger, this indicator consists of a middle band (a simple moving average) and two outer bands that represent standard deviations away from the average. When markets get quiet or volatile, Bollinger Bands visually show the expansion or contraction, helping traders adapt their strategy in real-time.
What Are Bollinger Bands?
Middle Band: Typically a
VWAP: The Intraday Indicator Every Trader Should KnowWhen it comes to intraday trading, precision matters. That’s where VWAP—the Volume Weighted Average Price comes in.
Used by retail traders, institutional players, and algo systems alike, VWAP helps you understand the average price of a security throughout the day, weighted by volume. It's one of the most important indicators for intraday decision-making on platforms like TradingView.
What is VWAP?
VWAP is the average price a security has traded at throughout the day, based not just on pric
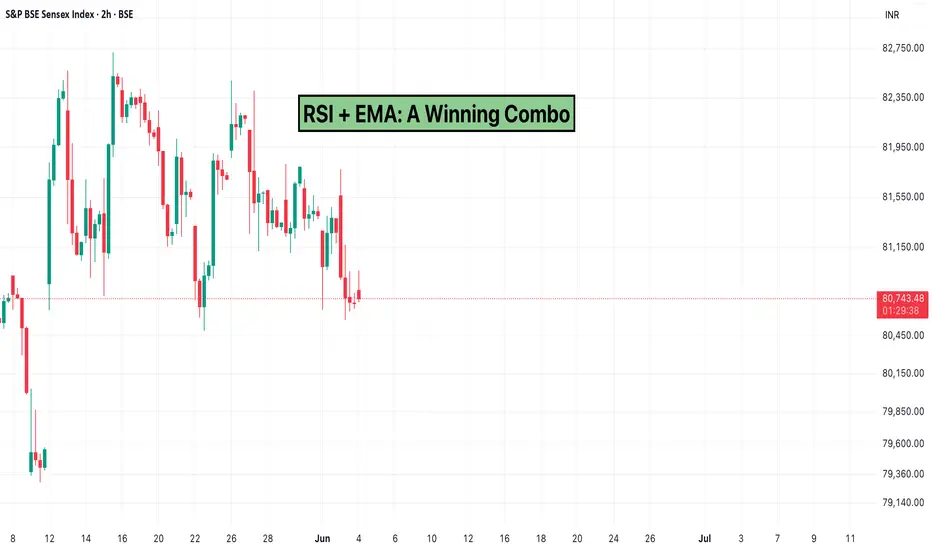
RSI + EMA: A Winning ComboWhen it comes to identifying strong trading setups, combining indicators can offer a more complete picture of market behavior.
One popular and effective combination used by traders on platforms like TradingView is the Relative Strength Index (RSI) and the Exponential Moving Average (EMA).
Together, these tools balance momentum with trend-following signals, helping you make more confident trading decisions.
What is RSI?
The Relative Strength Index (RSI) is a momentum oscillator that measu
Most Common Candlestick Patterns and What They MeanCandlestick patterns are one of the most widely used tools in technical analysis. They visually represent price movements and offer insights into market sentiment, potential reversals, and continuation patterns. Whether you're a beginner or an experienced trader, understanding the most common candlestick patterns can significantly improve your chart-reading skills.
1. Doji
A Doji forms when the opening and closing prices are nearly the same. It signals indecision in the market and can indica
Candlestick Patterns That Work: Myth vs. RealityCandlestick patterns have long been a favorite among technical traders.
From engulfing candles to dojis and hammers, these formations aim to predict market direction based on price action.
But with so many patterns and interpretations floating around, it’s important to ask: which candlestick patterns truly work—and which are overhyped?
The Promise of Candlestick Patterns
Candlestick patterns are used to spot potential reversals, continuations, and indecision in the market. Traders often
Bollinger Bands vs. Moving Averages: Which One Wins?Technical traders rely on indicators to analyze price movements and make informed decisions.
Two of the most popular indicators on TradingView are Bollinger Bands and Moving Averages. While both help traders gauge trends and volatility, they serve different purposes. Let’s break down how they work and which one fits your trading style.
What Are Bollinger Bands?
Bollinger Bands consist of three lines: a simple moving average (SMA) in the middle and two standard deviation bands above and bel
RSI vs. MACD: Which TradingView Indicator Suits Your Strategy?When it comes to technical analysis, TradingView offers a vast array of indicators to help traders make informed decisions. Two of the most widely used indicators are the Relative Strength Index (RSI) and the Moving Average Convergence Divergence (MACD).
While both help identify trends and potential trade opportunities, they serve different purposes and cater to different trading strategies. Let’s dive into the key differences and understand which one suits your trading approach better.
What
TradingView Multi-Chart Layout: Analyze Multiple MarketsEffective market analysis requires tracking multiple assets simultaneously. TradingView’s multi-chart layout allows traders to monitor different markets, time frames, and instruments within a single workspace.
1. Why Use the Multi-Chart Layout?
Compare Different Markets: Analyze stocks, forex pairs, and commodities side by side.
Monitor Multiple Time Frames: Track short-term trends while keeping an eye on the bigger picture.
Improve Efficiency: Avoid switching between tabs and maintain a sea
Choosing the Right Time Frame for Your Trading StyleSelecting the right time frame is crucial for aligning your trading strategy with market movements.
Whether you're a day trader, swing trader, or long-term investor, understanding time frames can help improve your decision-making and trade execution.
In this guide, we’ll explore different time frames and how to choose the one that best fits your trading style.
1. Short-Term Time Frames (1-Min to 15-Min)
Best for: Scalping and Intraday Trading
Commonly Used Time Frames: 1-minute, 5-minute
Customize TradingView Charts for a Personalized TradingTradingView offers powerful charting tools that allow traders to customize their setups for better analysis and decision-making.
Personalizing your TradingView charts can help streamline your workflow, highlight key market trends, and improve overall trading efficiency.
In this guide, we’ll explore how to customize TradingView charts to match your trading style.
1. Choosing the Right Chart Type
TradingView supports various chart types, including:
Candlestick Chart: Ideal for price action