

📘Overview
⸻⸻⸻⸻⸻⸻⸻⸻⸻
📉 Key Price Action
⸻⸻⸻⸻⸻⸻⸻⸻⸻⸻
📊 Chart Explanation
⸻⸻⸻⸻⸻⸻⸻⸻⸻⸻
📌 Summary
Rolling VWAP helps define market structure by identifying different phases of price behavior.
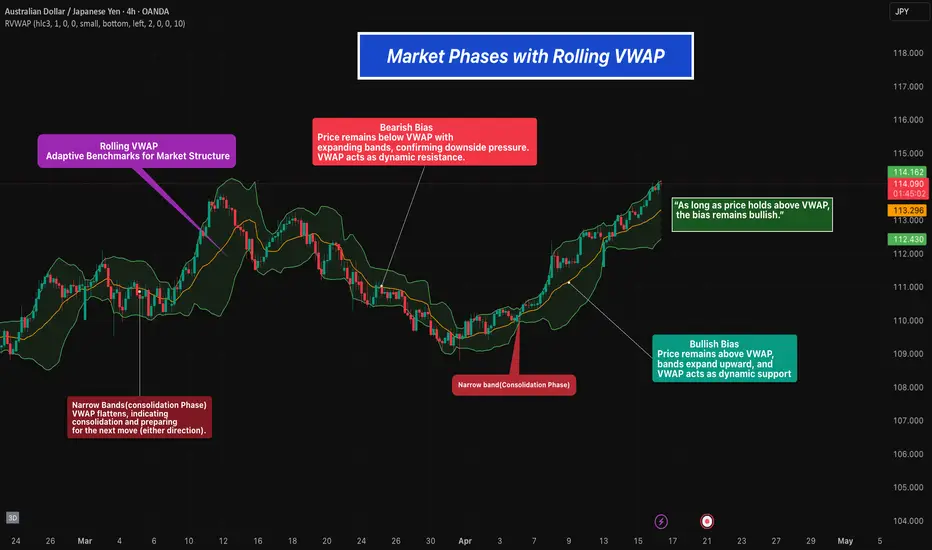
Instead of using VWAP as just a single line, combining it with expanding and contracting bands allows us to understand whether the market is trending or consolidating.
⸻⸻⸻⸻⸻⸻⸻⸻⸻
📉 Key Price Action
• Price below VWAP with expanding bands indicates bearish pressure
• Narrow bands with flat VWAP signal consolidation
• Price above VWAP with expanding bands confirms bullish momentum
• Band contraction followed by expansion often leads to a strong directional move
⸻⸻⸻⸻⸻⸻⸻⸻⸻⸻
📊 Chart Explanation
🔴 Bearish Phase
Price remains below VWAP, and bands expand downward.
VWAP acts as dynamic resistance, showing selling pressure.
🟡 Consolidation Phase
Bands contract and VWAP flattens.
This indicates low volatility and market indecision before the next move.
🟢 Bullish Phase
Price moves above VWAP with expanding bands.
VWAP acts as dynamic support, confirming upward momentum.
⸻⸻⸻⸻⸻⸻⸻⸻⸻⸻
📌 Summary
Rolling VWAP provides a structured way to read market phases.
By observing price position relative to VWAP and the behavior of bands, traders can identify transitions between bearish, neutral, and bullish conditions.
🔮 Future OutlookAs long as price holds above VWAP, the bias remains bullish.
A shift below VWAP may indicate a transition back into consolidation or bearish conditions.
⸻⸻⸻⸻⸻⸻⸻⸻⸻⸻
⚠️ Disclaimer📘 For educational purposes only.
🙅 Not SEBI registered.
❌ Not a buy/sell recommendation.
🧠 Purely a learning resource.
📊 Not Financial Advice.

Pine Script Developer • Market Analysis
Disclaimer
The information and publications are not meant to be, and do not constitute, financial, investment, trading, or other types of advice or recommendations supplied or endorsed by TradingView. Read more in the Terms of Use.
Pine Script Developer • Market Analysis
Disclaimer
The information and publications are not meant to be, and do not constitute, financial, investment, trading, or other types of advice or recommendations supplied or endorsed by TradingView. Read more in the Terms of Use.