
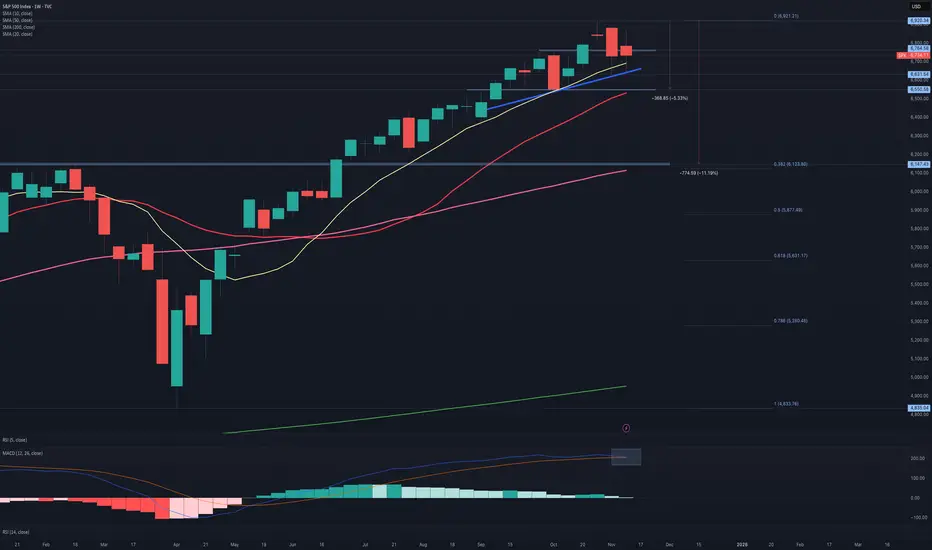
SPX: Analyzing the weekly chart, at first glance, it seems that everything is under control. However, since the formation of the doji three weeks ago, the SPX has lost upward momentum, despite Friday's attempt with a positive opening that failed to consolidate by the close of trading.
It's clear that the 10-week simple moving average is on the market's radar and is currently holding. We can also draw a blue oblique support line; however, last week's doji is signalling uncertainty in the market, in addition to having closed below the horizontal support level at 6754.
Meanwhile, the MACD is about to issue a sell signal. For now, the SPX remains fine, but it needs to hold firm; otherwise, it might need to test the strength of the next support level, located at 6550, where the 20-week simple moving average will also be found next week.
The stakes are high!
It's clear that the 10-week simple moving average is on the market's radar and is currently holding. We can also draw a blue oblique support line; however, last week's doji is signalling uncertainty in the market, in addition to having closed below the horizontal support level at 6754.
Meanwhile, the MACD is about to issue a sell signal. For now, the SPX remains fine, but it needs to hold firm; otherwise, it might need to test the strength of the next support level, located at 6550, where the 20-week simple moving average will also be found next week.
The stakes are high!

Disclaimer
The information and publications are not meant to be, and do not constitute, financial, investment, trading, or other types of advice or recommendations supplied or endorsed by TradingView. Read more in the Terms of Use.
Disclaimer
The information and publications are not meant to be, and do not constitute, financial, investment, trading, or other types of advice or recommendations supplied or endorsed by TradingView. Read more in the Terms of Use.