
The S&P500 (SPX) had yesterday its worst 1D closing (-4.84%) in exactly 5 years since the COVID flash crash started on March 11 2020 (-4.89%). Not even during the 2022 Inflation Crisis did the index post such strong losses in a day.
Obviously amidst the market panic, the question inside everyone's minds is this: 'Are we in a Bear Market?'. The only way to view this is by looking at SPX's historic price action and on this analysis we are doing so by examining the price action on he 1W time-frame since the 2008 Housing Crisis.
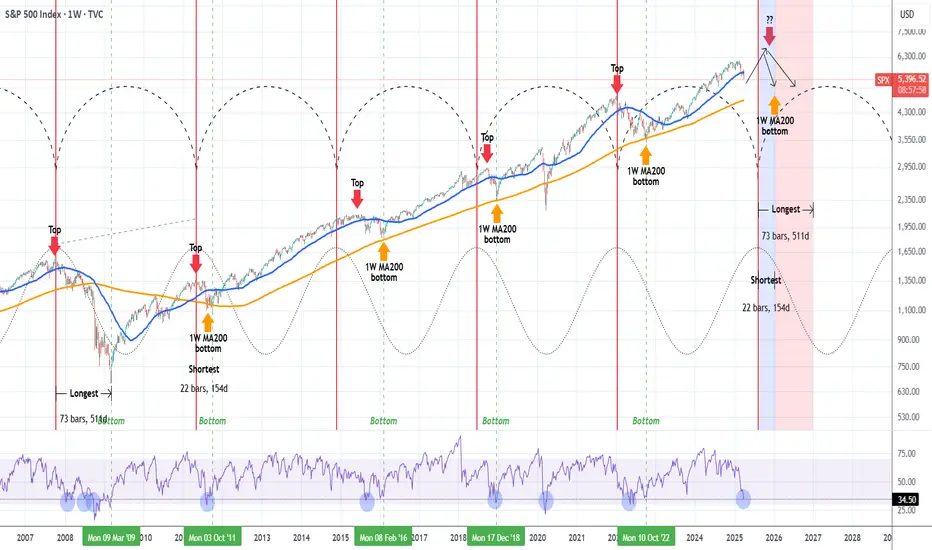
As you can see, starting from the Inflation Crisis bottom in March 2009, we've had 4 major market corrections (excluding the March 2020 COVID flash crash which was a Black Swan event). All of them made contact with the 1W MA200 (orange trend-line) and immediately rebounded to start a new Bull Cycle. Those Bull Cycles typically lasted for around 3 years and peaked at (or a little after) the red vertical lines, which is the distance measured from the October 15 2007 High to the May 07 2011 High, the first two Cycle Highs of the dataset that we use as the basis to time the Cycles on this model.
The Sine Waves (dotted) are used to illustrate the Cycle Tops (not bottoms), so are the Time Cycles (dashed). This helps at giving a sense of the whole Cycle trend and more importantly when the time to sell may be coming ahead of a potential Cycle Top.
This model shows that the earliest that the current Cycle should peak is the week of August 11 2025. If it comes a little later (as with the cases of October 01 2018 and June 01 2015), then it could be within November - December 2025.
The shortest correction to the 1W MA200 has been in 2011, which only lasted 22 weeks (154 days). The longest is the whole 2008 Housing Crisis (73 weeks, 511 days). All other three 1W MA200 corrections have lasted for less than a year.
On another note, the 1W RSI just hit the 34.50 level. Since the 2009 bottom, the market has only hit that level 5 times. All produces immediate sharp rebounds. The December 17 2018, March 16 2020 and August 15 2011 RSI tests have been bottoms while May 09 2022 and August 24 2015 bottomed later but still produced sharp bear market rallies before the eventual bottom.
Uncertainty is obviously high but these are the facts and the hard technical data. Game over for stocks or this is a wonderful long-term buy opportunity? The conclusions are yours.
-------------------------------------------------------------------------------
** Please LIKE 👍, FOLLOW ✅, SHARE 🙌 and COMMENT ✍ if you enjoy this idea! Also share your ideas and charts in the comments section below! This is best way to keep it relevant, support us, keep the content here free and allow the idea to reach as many people as possible. **
-------------------------------------------------------------------------------
💸💸💸💸💸💸
👇 👇 👇 👇 👇 👇
Obviously amidst the market panic, the question inside everyone's minds is this: 'Are we in a Bear Market?'. The only way to view this is by looking at SPX's historic price action and on this analysis we are doing so by examining the price action on he 1W time-frame since the 2008 Housing Crisis.
As you can see, starting from the Inflation Crisis bottom in March 2009, we've had 4 major market corrections (excluding the March 2020 COVID flash crash which was a Black Swan event). All of them made contact with the 1W MA200 (orange trend-line) and immediately rebounded to start a new Bull Cycle. Those Bull Cycles typically lasted for around 3 years and peaked at (or a little after) the red vertical lines, which is the distance measured from the October 15 2007 High to the May 07 2011 High, the first two Cycle Highs of the dataset that we use as the basis to time the Cycles on this model.
The Sine Waves (dotted) are used to illustrate the Cycle Tops (not bottoms), so are the Time Cycles (dashed). This helps at giving a sense of the whole Cycle trend and more importantly when the time to sell may be coming ahead of a potential Cycle Top.
This model shows that the earliest that the current Cycle should peak is the week of August 11 2025. If it comes a little later (as with the cases of October 01 2018 and June 01 2015), then it could be within November - December 2025.
The shortest correction to the 1W MA200 has been in 2011, which only lasted 22 weeks (154 days). The longest is the whole 2008 Housing Crisis (73 weeks, 511 days). All other three 1W MA200 corrections have lasted for less than a year.
On another note, the 1W RSI just hit the 34.50 level. Since the 2009 bottom, the market has only hit that level 5 times. All produces immediate sharp rebounds. The December 17 2018, March 16 2020 and August 15 2011 RSI tests have been bottoms while May 09 2022 and August 24 2015 bottomed later but still produced sharp bear market rallies before the eventual bottom.
Uncertainty is obviously high but these are the facts and the hard technical data. Game over for stocks or this is a wonderful long-term buy opportunity? The conclusions are yours.
-------------------------------------------------------------------------------
** Please LIKE 👍, FOLLOW ✅, SHARE 🙌 and COMMENT ✍ if you enjoy this idea! Also share your ideas and charts in the comments section below! This is best way to keep it relevant, support us, keep the content here free and allow the idea to reach as many people as possible. **
-------------------------------------------------------------------------------
💸💸💸💸💸💸
👇 👇 👇 👇 👇 👇

I trade Crypto, Forex, Indices & Commodities on PrimeXBT — all from one account with TradingView charts 👉 tradingshot.short.gy/PrimeXBT
I also use TradeNation for fixed spreads & zero commission 👉 tradingshot.short.gy/Tradenation
I also use TradeNation for fixed spreads & zero commission 👉 tradingshot.short.gy/Tradenation
Disclaimer
The information and publications are not meant to be, and do not constitute, financial, investment, trading, or other types of advice or recommendations supplied or endorsed by TradingView. Read more in the Terms of Use.
I trade Crypto, Forex, Indices & Commodities on PrimeXBT — all from one account with TradingView charts 👉 tradingshot.short.gy/PrimeXBT
I also use TradeNation for fixed spreads & zero commission 👉 tradingshot.short.gy/Tradenation
I also use TradeNation for fixed spreads & zero commission 👉 tradingshot.short.gy/Tradenation
Disclaimer
The information and publications are not meant to be, and do not constitute, financial, investment, trading, or other types of advice or recommendations supplied or endorsed by TradingView. Read more in the Terms of Use.