
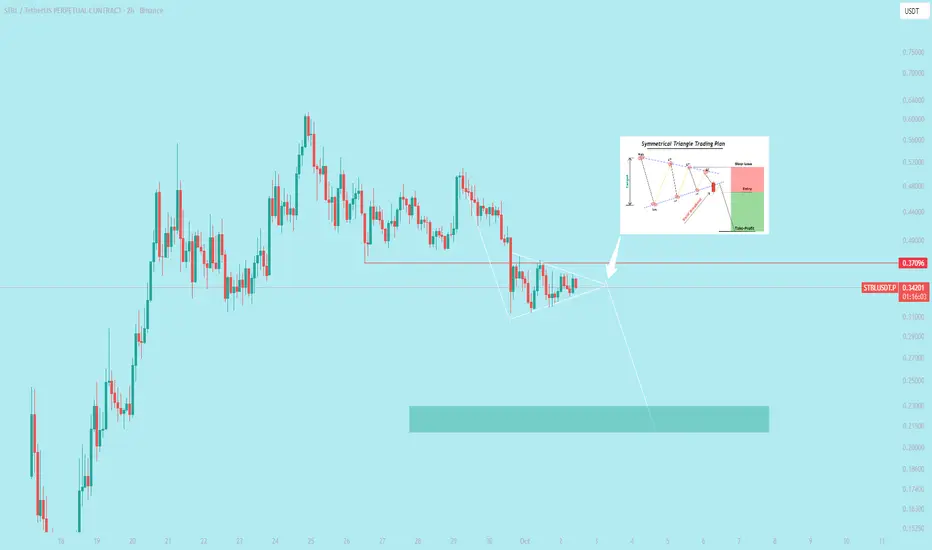
🥴 *A bearish symmetrical triangle is a technical analysis chart pattern that signals a period of consolidation in a downward trend, followed by a continuation of the downtrend. It indicates that after a price decline, sellers and buyers reach a temporary equilibrium before sellers regain control and drive the price lower.*
Trade active
25% down
Disclaimer
The information and publications are not meant to be, and do not constitute, financial, investment, trading, or other types of advice or recommendations supplied or endorsed by TradingView. Read more in the Terms of Use.
Disclaimer
The information and publications are not meant to be, and do not constitute, financial, investment, trading, or other types of advice or recommendations supplied or endorsed by TradingView. Read more in the Terms of Use.