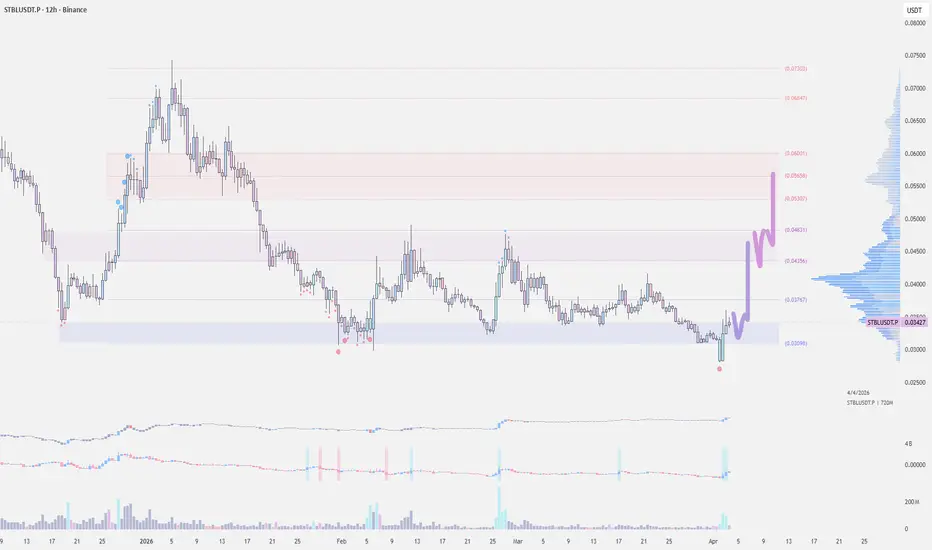
$STBL Positioning for the RWA WaveRecent strength in MEXC:STBLUSDT appears to be driven mainly by rising trading volume and renewed interest in the RWA/stablecoin narrative, rather than a single major announcement. Trading activity has picked up significantly, signaling genuine accumulation and capital inflows instead of a thin li
STBL Compression Under ResistanceSTBL is currently trading inside a broad descending structure, but recent price action shows a shift into tight compression between rising support and descending resistance.
Price is forming a mini ascending triangle within a larger downtrend, with higher lows building against the 0.038–0.040 resis
(STBL) Structure Says Reversal | Watching the Green Zone (12H)From a structural perspective, it appears that Wave C is approaching completion. This Wave C is not an isolated move, but part of a larger corrective formation within the higher-timeframe structure.
Looking deeper into the internal subdivisions, Wave C seems to be unfolding as a double correction.
STBL building a structure. Can price make a reversal?STBL is compressing into the apex of a falling wedge while sitting on a high-volume demand zone. Downtrend momentum is clearly fading, and the latest push is attempting to form a higher low.
This is a key decision area. Acceptance back above the range would signal a potential structure shift and op
STB Analysis (4H)It seems that the STB coin is in a corrective diametric pattern, and we are currently in wave F of this diametric.
Wave F itself appears to be an ABC structure, and we are now at the end of wave B.
If a pullback forms, a long buy position can be taken at the green zone for the targets of wave B of
STBLUSDT 12H#STBL is moving inside a falling wedge pattern on the 12H timeframe and is attempting to break above it. The candle hasn’t closed yet, but the setup looks promising. If the breakout confirms, the potential upside targets are:
🎯 $0.08350
🎯 $0.11046
🎯 $0.14659
🎯 $0.17579
🎯 $0.20499
🎯 $0.24656
⚠️ Alw
$STBL (12-HOUR): weak FALLING WEDGE breakout so far, vol SPIKEAQUISUK:STBL broke out from this FALLING WEDGE (target $0.151) last Monday, and I haven't posted an update since for a simple reason - the breakout has been rather weak so far.
The 50 MA (yellow, currently at $0.089) is still directly overhead and remains my main breakout validation tool. And obvi
STBL RR Demon Long - Channel breakoutAnother daily close above the channel can be seen as confirmation
SL is below the previous daily low
First target is at about 0.14$. This would be a good place to either TP1 or move SL to BE.
If you choose to fully close at TP1, RR would be about 4:1
TP2 would be at VAH 0.325$
Reaching this price
$STBL (12-HOUR): FALLING WEDGE breakout, RETEST in-playAnd we are finally getting a bullish chart pattern BREAKOUT in AQUISUK:STBL - a FALLING WEDGE targeting $0.15. Is this merely a FAKE-OUT to short-squeeze the bears? Let's have a look.
I always need to see those VOLUME bars rising before I call a breakout a valid one. There was a volume spike on t
See all ideas
Summarizing what the indicators are suggesting.
Oscillators
Neutral
SellBuy
Strong sellStrong buy
Strong sellSellNeutralBuyStrong buy
Oscillators
Neutral
SellBuy
Strong sellStrong buy
Strong sellSellNeutralBuyStrong buy
Summary
Neutral
SellBuy
Strong sellStrong buy
Strong sellSellNeutralBuyStrong buy
Summary
Neutral
SellBuy
Strong sellStrong buy
Strong sellSellNeutralBuyStrong buy
Summary
Neutral
SellBuy
Strong sellStrong buy
Strong sellSellNeutralBuyStrong buy
Moving Averages
Neutral
SellBuy
Strong sellStrong buy
Strong sellSellNeutralBuyStrong buy
Moving Averages
Neutral
SellBuy
Strong sellStrong buy
Strong sellSellNeutralBuyStrong buy
Displays a symbol's price movements over previous years to identify recurring trends.