
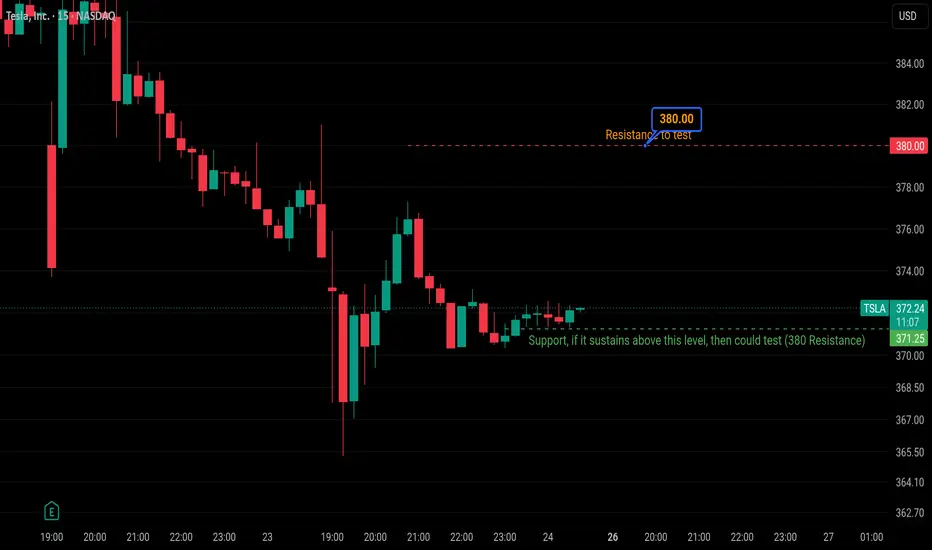
TSLA 15m: Intraday Breakdown and Support Validation Plan
• Ticker: TSLA (Tesla, Inc.) via NASDAQ
• Timeframe: 15-Minute (15m)
• Current Price: 372.08 USD (-0.06 / -0.02%)
Key Technical Levels
• Overhead Resistance Target: 380.00 USD (Major structural ceiling labeled on the chart as: "Resistance to test").
• Defined Support Base: 371.25 USD (The absolute swing-low floor marked by the label: "Support, if it sustains above this level, then could test (380 Resistance)").
Market Analysis & Structural Outlook
• Price Action: Following a prolonged bearish leg down from the 385.00 level, TSLA experienced an aggressive intraday breakdown before flattening. The sharp, vertical sell-off columns wiped out near-term demand pockets over successive trading blocks.
• Current Framework: The asset flushed deeply into a key discount zone, hitting micro intraday demand where modest buying pressure has emerged to check the fall. A notable series of small green stabilization candles printed immediately upon touching the 371.25 USD support baseline, signaling structural defensive interest.
• Execution Projection: If price action can successfully sustain and base positions above this minor 371.25 USD support floor, a short-term tactical recovery leg is projected to develop. This structural shift maps a potential upward expansion to target the overhead supply resting at the 380.00 USD resistance zone.
Legal Compliance & Financial Disclaimer
This analysis is published strictly for educational and informational purposes only. It does not constitute financial, investment, trading, or legal advice. Trading equities such as Tesla carries a high level of risk and may not be suitable for all investors. You should carefully consider your investment objectives, level of experience, and risk appetite. Past performance is not indicative of future market results. You should execute your own independent research and consult a certified financial advisor before placing capital at risk in live financial markets. The author assumes no liability for any financial loss incurred directly or indirectly from the use of this information.
• Ticker: TSLA (Tesla, Inc.) via NASDAQ
• Timeframe: 15-Minute (15m)
• Current Price: 372.08 USD (-0.06 / -0.02%)
Key Technical Levels
• Overhead Resistance Target: 380.00 USD (Major structural ceiling labeled on the chart as: "Resistance to test").
• Defined Support Base: 371.25 USD (The absolute swing-low floor marked by the label: "Support, if it sustains above this level, then could test (380 Resistance)").
Market Analysis & Structural Outlook
• Price Action: Following a prolonged bearish leg down from the 385.00 level, TSLA experienced an aggressive intraday breakdown before flattening. The sharp, vertical sell-off columns wiped out near-term demand pockets over successive trading blocks.
• Current Framework: The asset flushed deeply into a key discount zone, hitting micro intraday demand where modest buying pressure has emerged to check the fall. A notable series of small green stabilization candles printed immediately upon touching the 371.25 USD support baseline, signaling structural defensive interest.
• Execution Projection: If price action can successfully sustain and base positions above this minor 371.25 USD support floor, a short-term tactical recovery leg is projected to develop. This structural shift maps a potential upward expansion to target the overhead supply resting at the 380.00 USD resistance zone.
Legal Compliance & Financial Disclaimer
This analysis is published strictly for educational and informational purposes only. It does not constitute financial, investment, trading, or legal advice. Trading equities such as Tesla carries a high level of risk and may not be suitable for all investors. You should carefully consider your investment objectives, level of experience, and risk appetite. Past performance is not indicative of future market results. You should execute your own independent research and consult a certified financial advisor before placing capital at risk in live financial markets. The author assumes no liability for any financial loss incurred directly or indirectly from the use of this information.
Trade closed: target reached
The technical framework mapped out in the original TSLA range study has completed its structural recovery vector. As observed, the micro intraday demand clusters resting directly above the 371.25 USD support base sustained absolute buyer control.This dynamic structural floor completely halted the descending momentum, initiating an aggressive upward expansion leg. The resulting breakout successfully tore through our defined overhead supply target at 380.00 USD, clearing near-term resistance parameters to complete a total mean-reversion cycle. This concludes this specific technical setup review. This analysis is strictly for educational observation of historical price action mechanics and does not constitute financial or trade advice.

Disclaimer
The information and publications are not meant to be, and do not constitute, financial, investment, trading, or other types of advice or recommendations supplied or endorsed by TradingView. Read more in the Terms of Use.
Disclaimer
The information and publications are not meant to be, and do not constitute, financial, investment, trading, or other types of advice or recommendations supplied or endorsed by TradingView. Read more in the Terms of Use.