
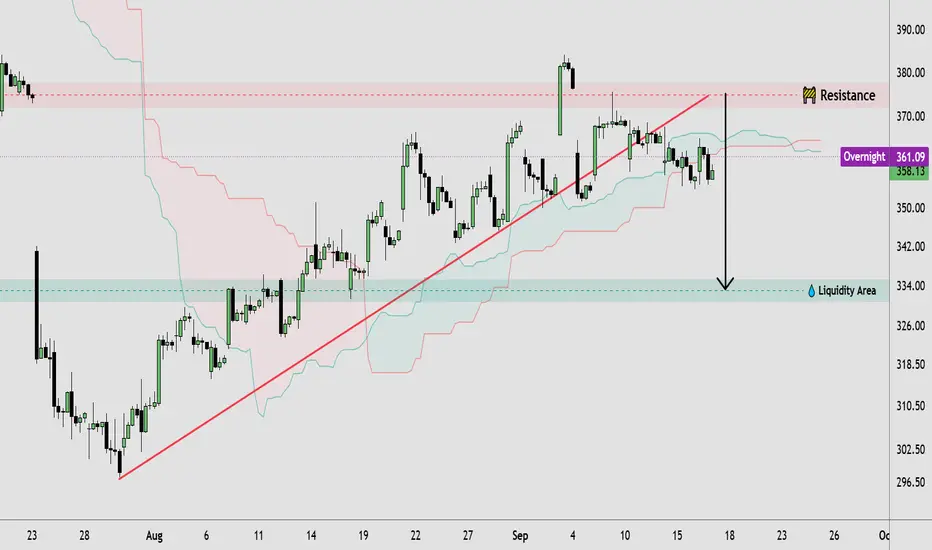
🔹 TSLA price action shows a broader upward market structure, with higher highs and higher lows developing from the August low. Price has recently consolidated beneath the highlighted resistance zone around 373–377, following a rejection from the 380+ area. The rising trendline continues to support the structure, while the current consolidation suggests a period of balance before the next directional move. The nearby liquidity area around 333–335 remains an important downside reference if selling pressure increases.
🔸 If TSLA breaks and holds above the resistance zone, the price structure could support further bullish continuation, particularly if the breakout is confirmed through sustained price action. Alternatively, rejection from resistance could lead to a deeper pullback toward lower support and the highlighted liquidity area. Traders may wait for clear price confirmation before considering any trade, while a decisive failure of the rising structure could shift attention toward the downside liquidity zone. This technical analysis focuses on price action, market structure, resistance, support, breakout, and liquidity.
This analysis is for educational purposes only and does not constitute financial or investment advice. Always conduct your own research before making trading decisions
🔸 If TSLA breaks and holds above the resistance zone, the price structure could support further bullish continuation, particularly if the breakout is confirmed through sustained price action. Alternatively, rejection from resistance could lead to a deeper pullback toward lower support and the highlighted liquidity area. Traders may wait for clear price confirmation before considering any trade, while a decisive failure of the rising structure could shift attention toward the downside liquidity zone. This technical analysis focuses on price action, market structure, resistance, support, breakout, and liquidity.
This analysis is for educational purposes only and does not constitute financial or investment advice. Always conduct your own research before making trading decisions
Trade active

📲 Join Our Telegram Community
t.me/+zoOewsc0ee43ZDc8
t.me/+zoOewsc0ee43ZDc8
Related publications
Disclaimer
The information and publications are not meant to be, and do not constitute, financial, investment, trading, or other types of advice or recommendations supplied or endorsed by TradingView. Read more in the Terms of Use.
📲 Join Our Telegram Community
t.me/+zoOewsc0ee43ZDc8
t.me/+zoOewsc0ee43ZDc8
Related publications
Disclaimer
The information and publications are not meant to be, and do not constitute, financial, investment, trading, or other types of advice or recommendations supplied or endorsed by TradingView. Read more in the Terms of Use.