ANOTHER BUY ATTEMPT IN AUDUSDIn our previous trade, we were failed. The trade was executed but stopped out when the price hovered the Yellow trendline drawn on 4H Timeframe.
Why I am going Bullish again? its just because of:
Bullish Divergence at 4H Timeframe.
Bullish Divergence at Hourly timeframe.
Both of the above are supported by 4H Trendline.
Nice HH and LH on both Daily and 4H Time frames.
Price above 50 EMA and 89 EMA.
the prvious Bearish Divergence is now converted into Bullish Divergence.
Trade setup:
I will put 2 trades with buy stop at 0.71738 . Both SL will be at 0.71366 and aiming 0.72314 as TP1 for my 1st trade and 0.72701 as TP2 for my 2nd trade. will move the SL to Breakeven after TP1 hits.
Risk: 1% on the full setup. i.e 0.50% on each trade.
Buy Stop: 0.71738
SL: 0.71366
TP1: 0.72314
TP2: 0.72701
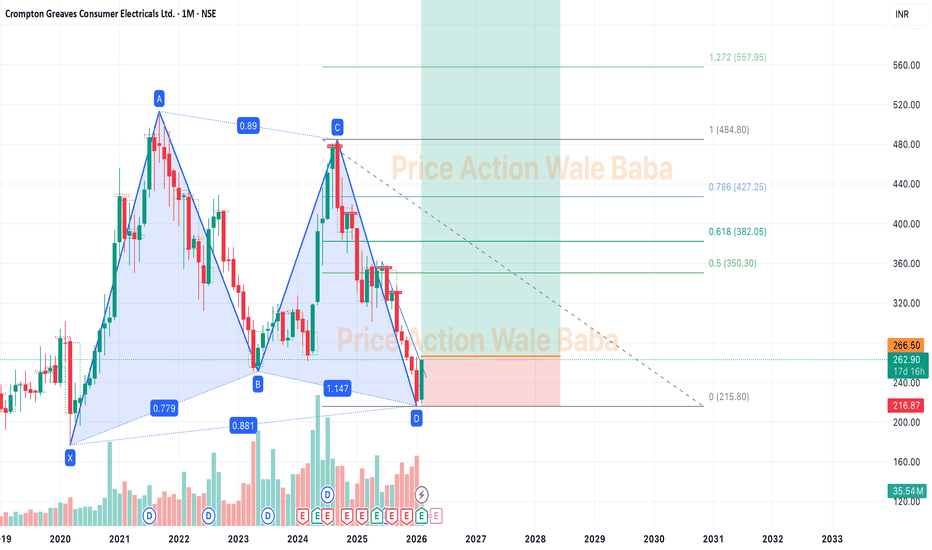
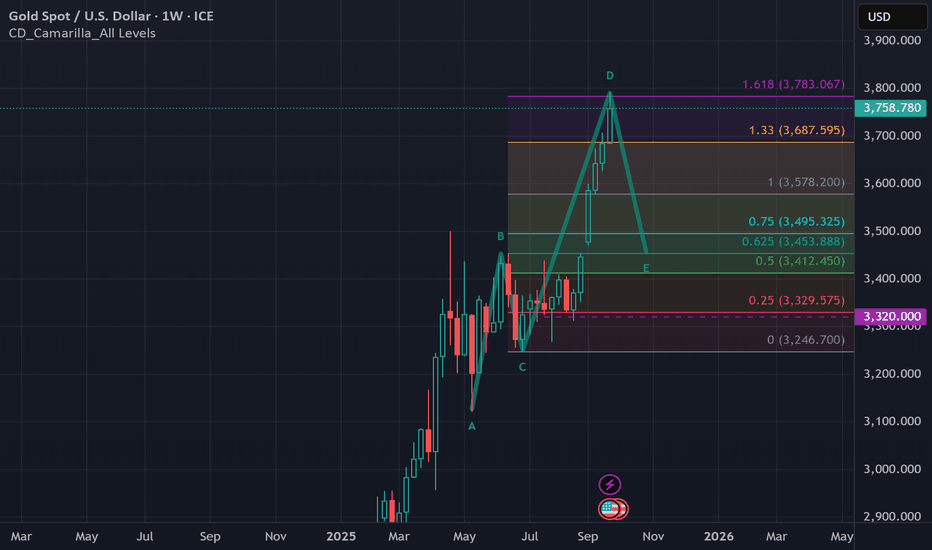
AB=CD
Gold Aiming Bullish setup towards 4639 and 4840
PEPPERSTONE:XAUUSD is currently consolidating beneath a descending trendline resistance, while a strong horizontal resistance is also sitting around 4,443.77 .
The price is approaching a critical decision zone. A confirmed breakout above 4,443.77 , together with a break of the descending trendline, could open the way for a larger bullish move.
I am bullish on Gold because of:
Descending trendline has been acting as dynamic resistance.
4,443.77 is the key horizontal resistance.
Price is compressing between the descending trendline and rising support, creating a potential breakout structure.
A clean breakout can release the accumulated pressure and potentially push Gold toward 4,656.
RSI is around the 50 level, leaving room for momentum to expand if the breakout occurs.
on Top of all the above, an ABCD formation also in process
I would not chase Gold inside the consolidation. Let the market prove the breakout first.
Trade Setup:
Buy Stop: 4,443.77
SL: 4330.80
TP1: 4639.72
TP2: 4840
I will put 2 trades with buy stop at 4,443.77 . Both SL will be at 4330.80 and aiming 4639.72 as TP1 for my 1st trade and 4840 as TP2 for my 2nd trade. will move the SL to Breakeven after TP1 hits.
APL Apollo Tubes — Potential Wave (v) SetupAPL Apollo Tubes has completed a strong impulsive advance, with the current pullback appearing to be a Wave (iv) correction.
Price is now testing the marked support zone around ₹2,150–₹2,170. If this zone holds and the corrective structure completes, the next leg higher could develop as Wave (v).
The larger-degree count also points toward a potential completion of Wave V.
A sustained break below the support zone would weaken the current bullish interpretation.
Charts shared for educational and research purposes only. Not investment advice.
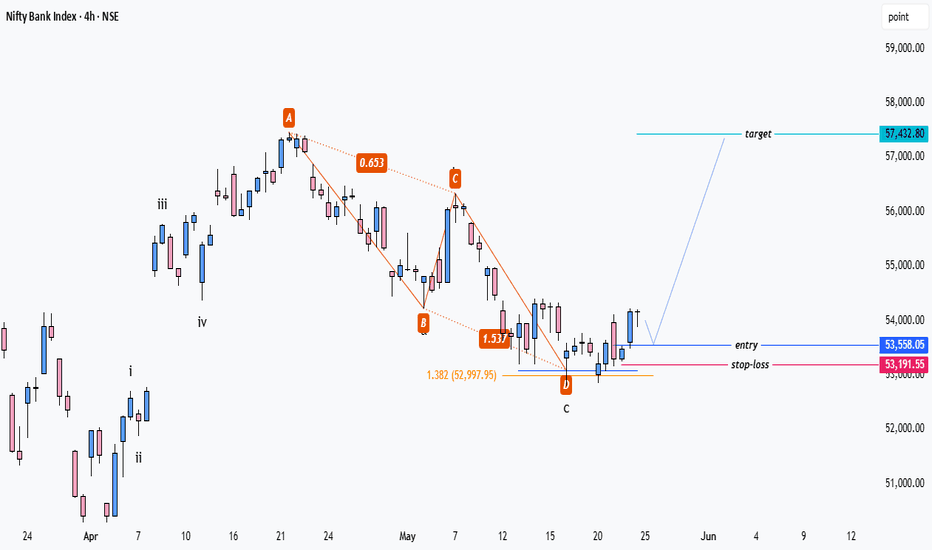
BankNifty Levels for Next weekDisclaimer : This view is only for educational purpose and it's not buying or selling recommendation. Consult your financial advisor for stock market related investment. Stock market gains are subject to market risk's, hence invest with accepting stock market risk's.
I am not responsible for your profits and losses.
1] Bank nifty has completed impulse wave (1-2-3-4-5) followed by Zigzag correction (A-B-C).
2] From here, bank nifty can start short term corrective rise.
3] Wait for Entry and follow stop-loss very strictly.
Bank Nifty NSE:BANKNIFTY
Information provided is for informational purposes only and should not be construed as investment advice or an offer to buy or sell securities. Investors are advised to carefully review all materials and consult with a financial advisor considering their own financial situation and risk tolerance before making investment decisions. The disclaimer also often includes statements about no guarantees or warranties regarding the accuracy, adequacy, or completeness of the information provided and emphasizes that investments can fluctuate in value and there is a risk of loss
Gold Intraday Setup (XAU/USD)Price tapped into the premium zone after a sharp impulsive leg, showing signs of exhaustion near 4139–4140 levels. Expecting a potential short-term correction as liquidity above recent highs has been swept.
Bias: Short
Entry: 4134
Stop Loss: 4140
Target: 4120
R:R: ~2:1
Watching for confirmation on lower timeframes before continuation.
#Gold #XAUUSD #PriceAction #LiquidityGrab #YCGHCapital
EUR/USD | Institutional Demand RejectionPrice action shows a clean liquidity sweep below the prior session’s low, tapping into a well-defined 5-min demand zone aligned with the 1H structural pivot. Orderflow shift confirmed as buy-side momentum emerged with displacement and follow-through above short-term structure.
Position initiated post-confirmation close, with risk anchored below the sweep low. Upside targets set near 1.1510–1.1520, aligning with local liquidity cluster and FVG mitigation zone.
Market Context:
• EUR/USD rebounded after liquidity grab under 1.1480 support.
• Short-term orderflow flipped bullish following imbalance recovery.
• Targeting return to equilibrium near 1.1510 zone before reassessment.
Trade Parameters:
• Entry: 1.1489
• Stop Loss: 1.1477
• Take Profit: 1.1513
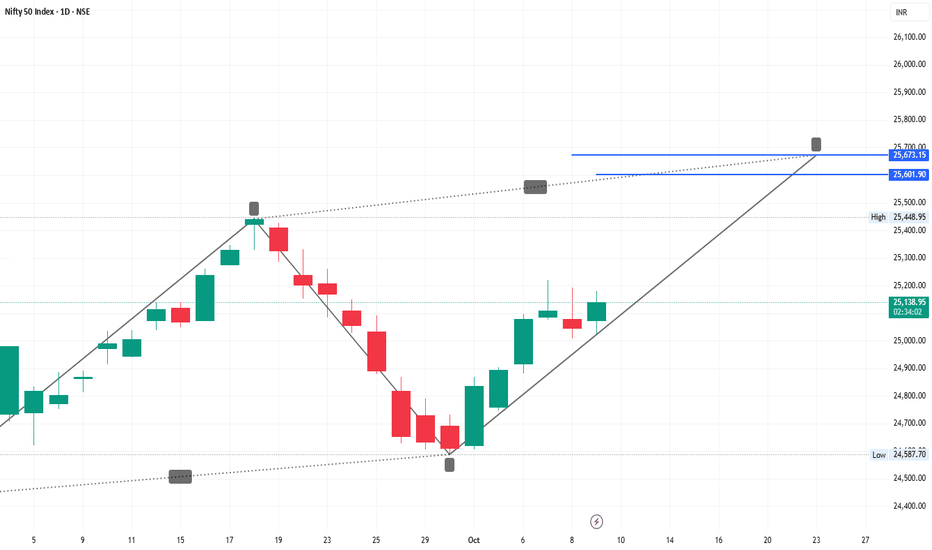
Nifty Nifty just formed as AB=CD pattern as shown
Disclaimer
Information provided is for informational purposes only and should not be construed as investment advice or an offer to buy or sell securities. Investors are advised to carefully review all materials and consult with a financial advisor considering their own financial situation and risk tolerance before making investment decisions. The disclaimer also often includes statements about no guarantees or warranties regarding the accuracy, adequacy, or completeness of the information provided and emphasizes that investments can fluctuate in value and there is a risk of loss.
BNAKNIFTY MATHEMATICAL LEVELSThese Levels are based on purely mathematical calculations.
How to use these levels :-
* Mark these levels on your chart.
* Safe players Can use 15 min Time Frame
* Risky Traders Can use 5 min. Time Frame
* When Candle give Breakout / Breakdown to any level we have to enter with High/Low of that breaking candle.
* Targets will be another level marked on chart
* Stop Loss will be Low/High of that Breaking Candle.
* Trail your SL with every candle.
* Avoid Big Candles as SL will be high then.
* This is one of the Best Risk Reward Setup.
For Educational purpose only
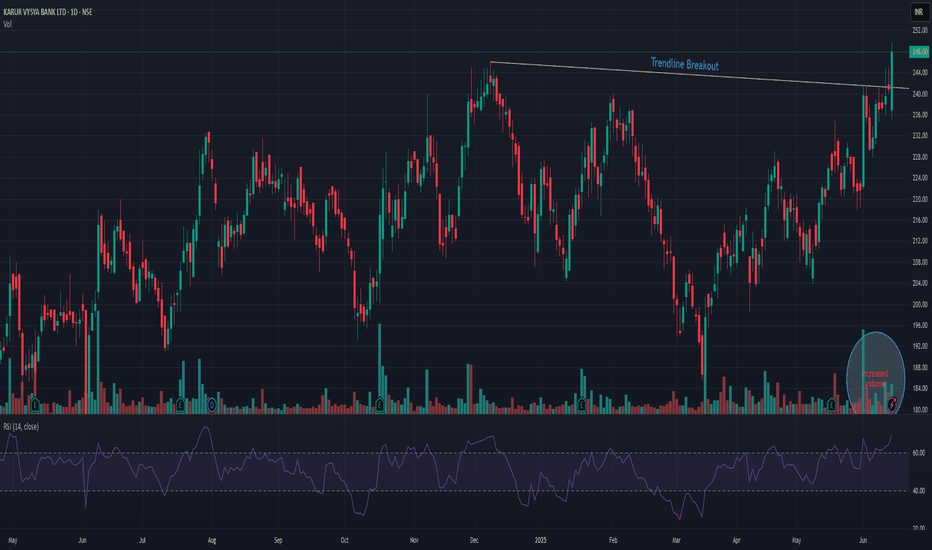
KARURVYASYAKARURVYSYA has given trend-line breakout. The stock is continuously making higher high and higher-low pattern with increased market participation. Also it crossed previous resistance level as well. It seems like it will continue its momentum ride. The stock is trading at ATH. Closing below 220 may change my view. It may face resistance nr 285 levels.
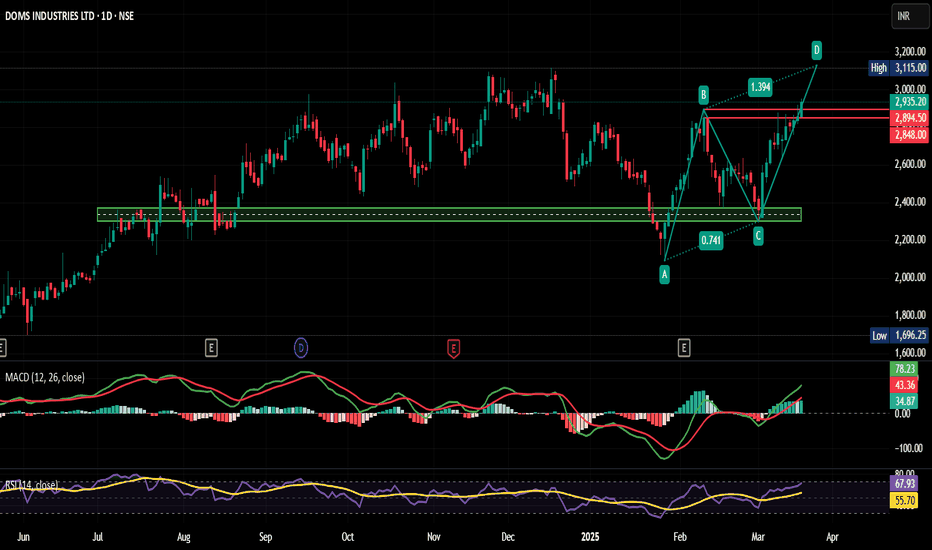
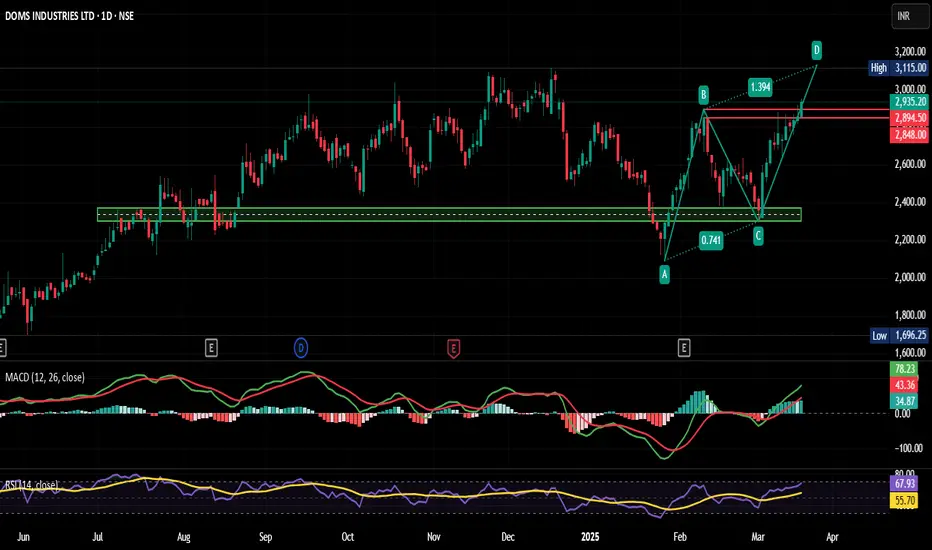
DOMS - ABCD Pattern, Crossing Swing Highs.NSE:DOMS Crossing Swing Highs with Strong Candles With RSI and MACD Trending Upwards and according to ABCD Pattern it's Likely to Cross ATH in Short Term.
About:
Incorporated in 2006, NSE:DOMS is a stationery and art product company primarily engaged in designing, developing, manufacturing, and selling a wide range of these products under the flagship brand, NSE:DOMS is the 2nd largest player in India’s branded 'stationery and art' products market. It held 29% and 30% market share for its core products in FY23 for pencils and mathematical instrument boxes.
Trade Setup:
A Swing Trade Can be Done as per the ABCD Pattern and Bullish Price Action. Keep Position Size as Per Appetite.
Target (Take Profit):
Near ATH Levels of 3115
Stop Loss:
Entry Candle Low for Aggressive Swing Traders and Swing Low in General.
📌Thank you for exploring my idea! I hope you found it valuable.
🙏FLLOW for more
👍BOOST if useful
✍️COMMENT Below your views.
Meanwhile, check out my other stock ideas on the right side until this trade is activated. I would love your feedback.
Disclaimer: "I am not SEBI REGISTERED RESEARCH ANALYST AND INVESTMENT ADVISER."
This analysis is intended solely for informational and educational purposes only and should not be interpreted as financial advice. It is advisable to consult a qualified financial advisor or conduct thorough research before making investment decisions.
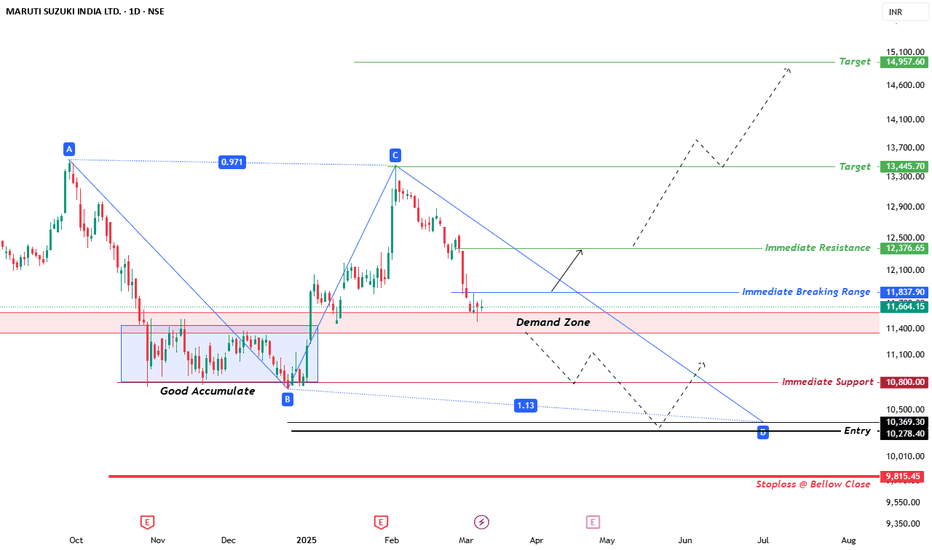
Maruti SuzukiMaruti Suzuki India Ltd - Technical Analysis & Trade Plan
Stock: MARUTI SUZUKI INDIA LTD (NSE)
Timeframe: 1D (Daily)
Key Levels:
Entry Zone: Near 10,369 - 10,278
Stoploss: Below 9,815 (Candle Close Only)
Immediate Support: 10,800
Immediate Breaking Range: 11,837.90
Immediate Resistance: 12,376.65
Target 1: 13,445.70
Target 2: 14,957.60
Trade Plan:
Good Accumulation Zone Identified at lower levels.
Demand Zone around current price, expecting potential reversal.
If price holds the demand zone, a bullish move towards resistance & targets is possible.
If price breaks down below support & demand zone, further downside towards entry range possible.
Risk-Reward Management:
Stoploss candle close only, Target Trigger Price
Risk Ratio 1:1 maintained, modify SL accordingly
Good entry at marked price only with strict SL
📌 This is not a buy/sell recommendation, just an educational trading idea.
📌 Market conditions can change; always conduct your own research.
📌 Understand risks before investing and take full responsibility for decisions.
HDFC BANK LTD (NSE)📢 Smart Trading Opportunity – HDFC BANK LTD (NSE) 📢
🚀 Maximize Profits with a Strategic Approach! 🚀
Unlock potential trading opportunities with well-defined entry, target, and risk management strategies.
🔹 Bullish Pattern & Entry Plan
🔹 Entry Confirmation – Above Trendline Break
🔹 Target – ₹1,913.45 (Projected Upside)
🔹 Breaking Range – ₹1,804.40 (Key Resistance)
🔹 Risk-Reward Management – Optimize with stop-loss adjustments
🔻 Bearish Scenario & Downside Plan
🔻 Immediate Support – ₹1,625.45
🔻 Selling Target – ₹1,514.35 (Bearish Confirmation)
🔻 Entry for Strong Bearish Move – ₹1,482.40
📊 Key Trading Strategy 📊
✅ Swing Trading & Short-Term Holding Opportunities
✅ Price Action & Pattern-Based Entries
✅ Risk-Managed Approach – Protect your capital
✅ High Probability Trade Setup – Clear entry & exit points
⚠ Disclaimer: This is for educational purposes only, not a buy/sell recommendation. Trade responsibly and manage your risk!
Would you like me to include your logo and refine the design further? 🚀📈
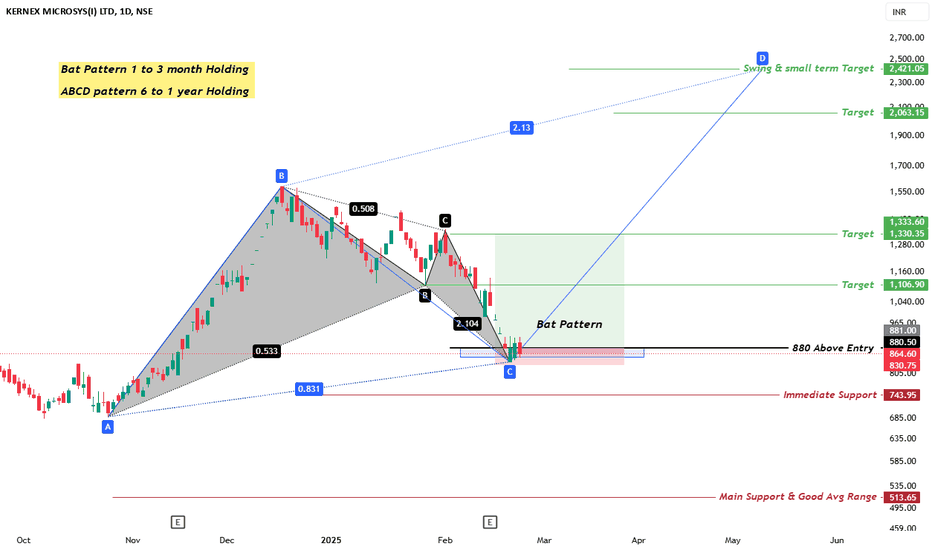
Kernex Microsys (KERNEX) Short term (6 to 12month) HoldingSL Weekly candle close only, Target Trigger Price
All detail for chat. good entry at mark price only. and must stoploss minimum risk and good profit. risk ratio 1:1 to manage modified SL. This is not call, Just my idea. Please understand your risk and take full responsibility of your actions