Bitcoin under Mini #BullTrap#Bitcoin 4hr. Chart Analysis
After CRYPTOCAP:BTC #DeathCross completed in today morning, Whaler's will trying to manipulate the market, and they were successful after today's #BullTrap. But as per 4 hr. chart pattern of Bitcoin's, it properly moving into Ascending Broadening Wedge Pattern with perfect Symmetry again.
Next downtrend cycle starts from 15-17 Sept. towards $22k to break out its strong support of $23.8k soon.
Always #DYOR and Trade with #StopLoss, it's #NFA
and,
Must LIKE, SHARE
Ascending Broadening Wedge
BITCOIN soon moves under Bearish Zone#Bitcoin 4-hr.Chart Analysis
CRYPTOCAP:BTC moving under Ascending Broadening Wedge Pattern, As per 4-hour chart, its cycle started from 18 August, as well same wedge pattern moving under hourly cycles too..
The last cycle of this Bearish Pattern will be finish around 12-15 September, after #DeathCross, and the CRYPTOCAP:BTC market moves into much more deeper in #BearishZone towards $22k and major chances it also break-out towards FWB:21K -$19k too...
Although. Last Lower-Low Cut-off poin
BShort
BITCOIN - Ready to move in Bearish Zone#BITCOIN 4hr. Chart Analysis
At Present from last 20 days, CRYPTOCAP:BTC moving into Ascending Broadening Wedge Pattern.
Ascending broadening wedge is one such formation, where its signal manifestation of the ascending wedge pattern in an uptrend, the asset price trend reverses downtrend. Hence, it is a bearish reversal pattern. An ascending broadening formation forms an inverted triangle shape in the price chart.
So that, remember the CRYPTOCAP:BTC historical chart pattern of September al
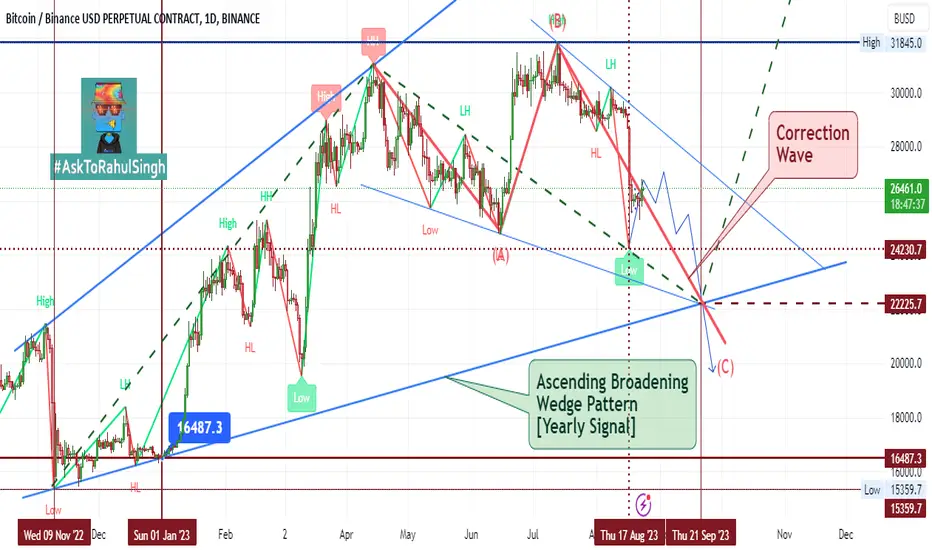
#BITCOIN - Still under #BearishZone#BITCOIN 1-Day Chart Analysis
As per daily signals into yearly chart pattern, CRYPTOCAP:BTC moving under Ascending Broadening Wedge pattern from January 2023 to at present and still to be continue....
As per pattern, BTC moving into final downtrend cycle of #CorrectionWave and as per pattern, its final Lower-Low point will be approx. $22.225 and last lowest cut-off point will be $19.5k, if market goes more Bearish.
As per historic chart of last 11 years in Trading of BTC, September month wa
BShort
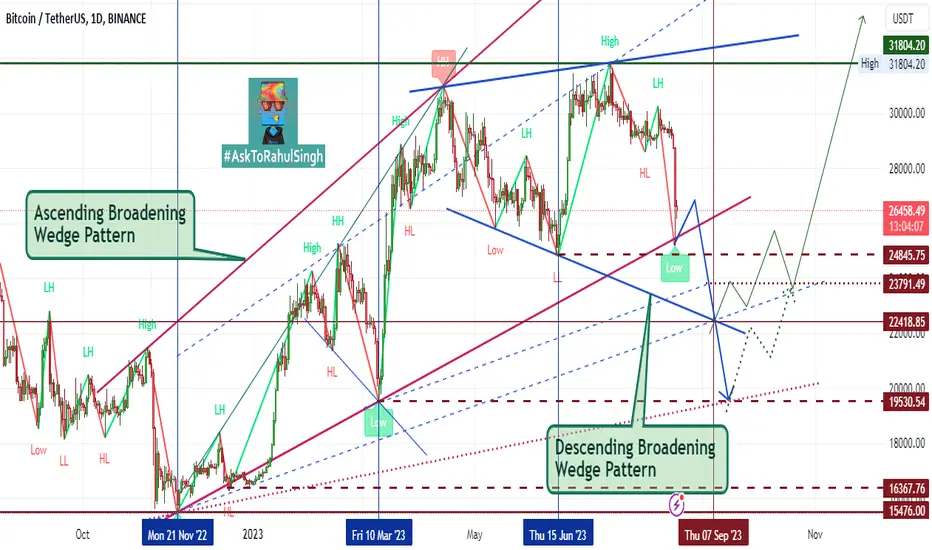
BITCOIN still under #BearishZone#BITCOIN 1-Day Chart Analysis-
As per CRYPTOCAP:BTC daily chart, Yearly Cycles running into Ascending Broadening Wedge pattern, then its final wave is nearby touched their support level and soon break-out up to $22.5k to $19.5k to complete its Bearish Zone cycle up to 5/7 sept., while monthly cycles moving under Descending Broadening Wedge Pattern, and as per that after the current downtrend completing, its upper Bullish divergence starts soon from mid of Nov. 2023.
At present, market is und
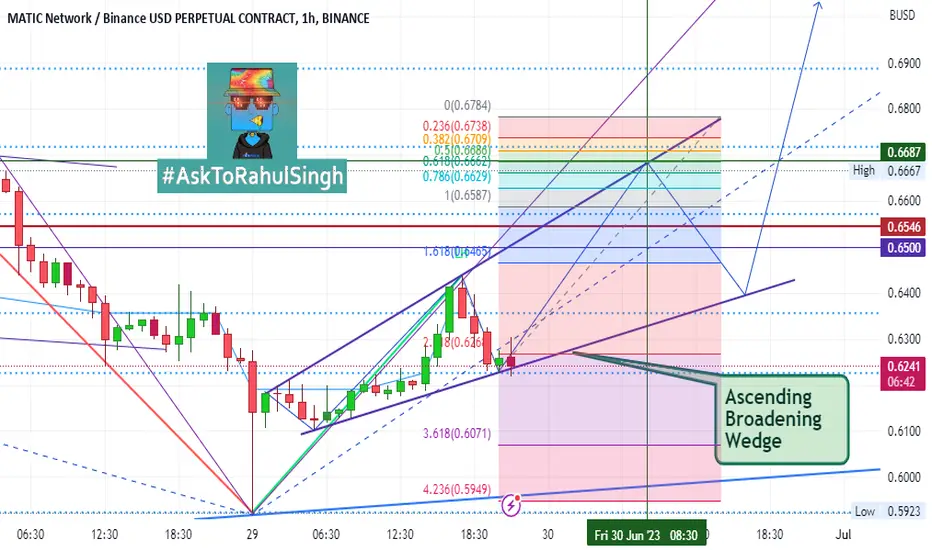
MATIC on BULLISH ModeMATIC 1 hr. Chart Analysis
After Lower-Low retest mark of 59 cent, MATIC starts its Uptrend cycle into Ascending Broadening Wedge Pattern and soon it will break again Lower-High 70-71 cents within 24-48 hrs in June month, and as per FIB Retracement markup points too, its upper point is 71 cent too.
Always #DYOR and Trade Wisely by using #StopLoss
Must LIKE & SHARE....
MLong
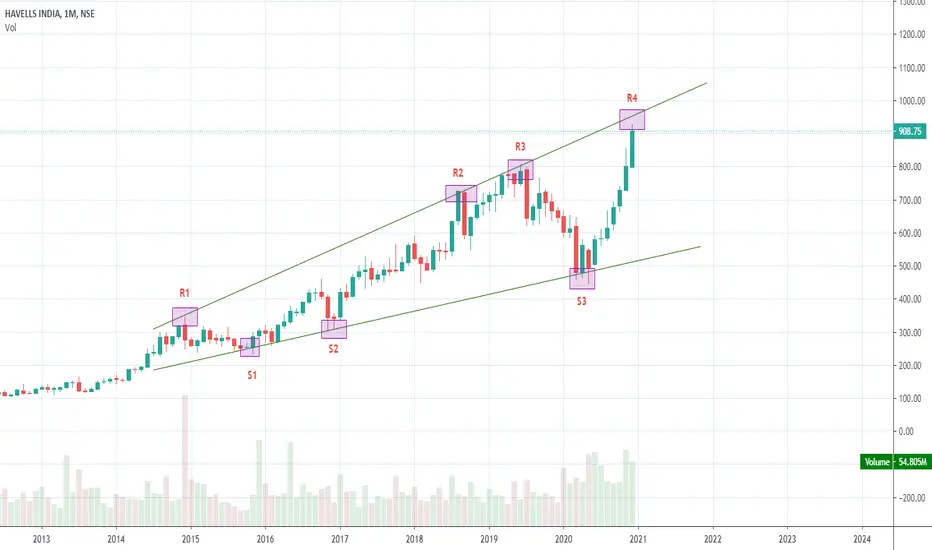
Ascending Broadening Wedge PatternsIt looks like Megaphone, Usually the price is hitting higher highs on the top resistance line and higher lows on the bottom support line.
Easily spot at the top of the trend.
How to trade it?
For downward breakouts, use the lowest valley in the pattern as the target. For upward breakouts, consider the difference between highest and lowest valley as height for the target from the highest valley price.
Since the bottom trendline slopes upward, do not short this pattern at the top trendline. Go
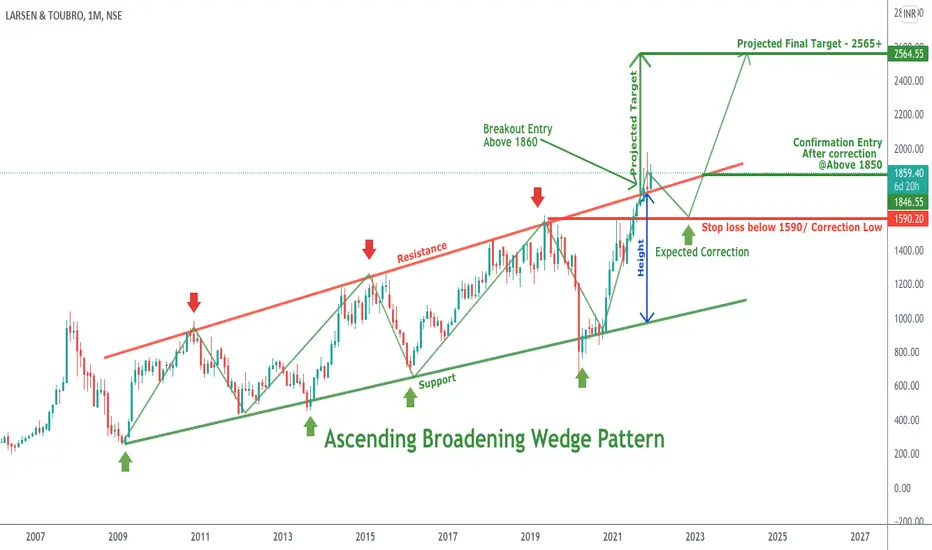
Ascending Broadening Wedge Pattern in LT for 2565+ Target On a Monthly Timeframe, In this stock gives the breakout of ascending broadening wedge pattern near 1850 level. So it is a wise idea to trade in the breakout direction at the current level. According to this pattern most of the time it gives correction movement after the breakout. So for confirmation entry can wait for the corrective movement to entry.
The target is the full height of this wedge pattern and it can be 2565+ in LT. Can take position near 1850 level with stop loss below 1590 level
IOC - Ascending broadening wedge pattern at monthly time frameINDIAN OIL CORP (IOC) - Ascending broadening wedge pattern formation at monthly time frame - Long
Always trade what you see, never trade what you feel. Make this a habit, you won't be requiring any seminar, webinar, or mentor, you will be self-sufficient.
Disclaimer : All charts are purely for educational and information purpose only. Invest or Trade at your own risk.
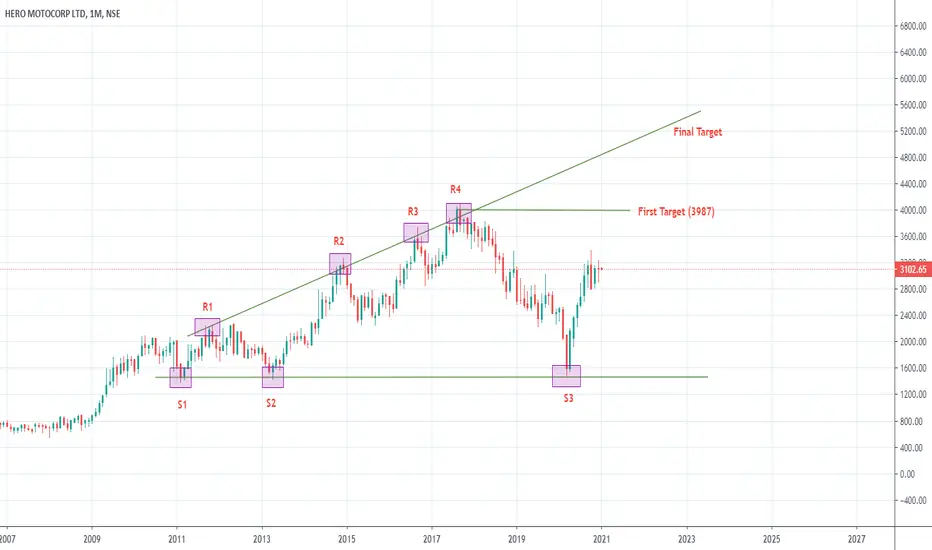
HERO MOTOCORP Ascending broadening wedge pattern at monthly TF HERO MOTOCOPR LIMITED - Ascending broadening wedge pattern formation at monthly TF
Always trade what you see, never trade what you feel. Make this a habit, you won't be requiring any seminar, webinar, or mentor, you will be self-sufficient.
Disclaimer : All charts are purely for educational and information purpose only. Invest or Trade at your own risk.
BHARTI AIRTEL -Ascending broadening wedge pattern at monthly TF BHARTI AIRTEL -Ascending broadening wedge pattern formation at monthly TF
Always trade what you see, never trade what you feel. Make this a habit, you won't be requiring any seminar, webinar, or mentor, you will be self-sufficient.
Disclaimer : All charts are purely for educational and information purpose only. Invest or Trade at your own risk.
Banknifty (Probabilty vs Possibility)After the formation of strong bearish engulfing pattern in daily chart, the market is taking a pause.
Case 1 -
We can see a inverse head and shoulder pattern formation and an ascending channel formation (in 5 min chart) at its right shoulder. If BNF crosses 29800 and sustains, it could retest 30000 level
Case 2 -
If a breakdown of the ascending channel formation (in 5 min chart) happens, we can expect BNF to come down up to 28950 level as that is the immediate support.
P.S. Please see 5
Breakdown from Ascending Broadening WedgeGBPCAD after retracing 38.2% of the 6th May to 12th august trend has now fallen below the ascending broadening wedge pattern, which makes it vulnerable to selling up to 1.60690. The stop loss for the trade will be above the high of the previous session i.e. at 1.63747.
Short GBPUSD to test 1.21151 level of the broadening channelGBPUSD is a good sell right now as there are a number of patterns that point towards the southward trajectory of the pair. The pair initially went above the broadening channel, but later on reverted back with a head and shoulder pattern (blue shaded area) which make bears on the winning side, with the target of testing the lower trend line of the channel at 1.21151. In other words, follow the red arrow. Meanwhile, the pair is taking support from the 1.22859, which might become the neckline for t
Broadening Formations, Right-Angled and Ascending/EngulfingThe stock has formed Broadening Formations, Right-Angled and Ascending pattern and one can buy on the touch at horizontal line. There was Bullish Engulfing on 13.06 and it trades above the next day showing strength. Stop Loss is of one bar is affordable.
Entry 18100
SL 17750
Target 19500
RR Ratio 4
Disclaimer : All ideas and comments are my personnel view. Please take financial consultancy for trading decision.
BankNifty : Another Push to Upside This one is Ascending Broadening Wedge here in Banknifty and time is not ripe for its breakout yet, probably up side trendline needs to redrawn depending on todays close ( if positive ) but this is not yet ready for breakout. So go on 15mins in Banknifty and find trade setups to take trading decisions.
For expiry, will post out range by 2mrw, yet to do that part !
I will post it out or update when its on verge of breakout !
B's shopping theory & Nifty !Let me ask this first, How many of you are frustrated bcos of almost no movement in Nifty ?! Almost we are stagnating within 100 point range from Oct 19th. Intra's will be having chances here n there but positional ones will be irritated to the core bcos of no movement & no trade setup emerging out of Nifty.
B's Shopping Theory :
Am not sure about the exact date, but before Dussehra itself( from Oct 1st week I guess ), I told Nifty will be directionless till Diwali bcos Bull & Bear ( B's) ne