360 One Wam Limited - Daily Chart Price Action Analysis Pattern: Ascending Channel
A clean ascending channel from mid-April to July 2026.
Lower trendline: Connects higher lows from ~₹975 in April → ~₹1030 in May → ~₹1050 in June → ~₹1077 in July
Upper trendline: Connects higher highs from ~₹1125 in April → ~₹1145 in May → ~₹1160 in June
Midline: Dashed center line. Price oscillates between upper/lower lines
Structure: Both lines slope up = bullish consolidation after a sharp fall.
This is a bullish channel after a washout. From April low around ₹960, stock made higher lows and higher highs inside the channel = Dow Theory uptrend on daily chart. It's a "recovery channel" not a breakout yet.
Every time it hits ₹1145-1160 it gets sold. Every time it hits ₹1050-1075 it gets bought. Current move is the bounce off lower line. Volume expansion on the green candle confirms buyers defended.
Ascending Channel
BANKNIFTY 1H | Triangle Breakout → Channel Resistance → PullbackOverview
BANKNIFTY has been trading inside a clean Ascending Channel on the 1-hour timeframe since early June. Within this channel, a textbook Symmetrical Triangle formed, compressed price, and then delivered a sharp breakout — sending price all the way to the Upper Channel Resistance at 58,708.
Price is now pulling back. The key question is: where does the pullback find support?
What the Chart Is Showing
📐 Symmetrical Triangle — A consolidation pattern formed between June 15–24 inside the ascending channel. Price coiled tighter with each swing until a decisive breakout downward on June 24 at ~57,200 launched the next leg up.
🟡 Ascending Channel — The broader structure since June 9. Price has respected both the upper and lower boundaries consistently. The channel defines the playing field.
🔴 Channel Resistance at 58,708 — Price tagged the upper boundary of the channel precisely and reversed. This is not a random high — it is a structural rejection from a well-established level.
🔻 Pullback in Progress — After the resistance rejection, price is now declining. The natural pullback target is the mid-channel support zone at 57,657.
🟢 Breakout Level 54,851 — The origin of the entire move. This remains the key invalidation level for the overall bullish structure.
Key Levels
🔴 Resistance — 58,708 (Channel Upper Band)
🟡 Current Price — 58,187
🟢 Pullback Support — 57,657 (mid-channel)
🟢 Major Support — 54,851 (Breakout Level)
Three Scenarios
🟢 Scenario A — Pullback & Resume
Price pulls back to 57,657 mid-channel support, finds buyers, and bounces. Next attempt at 58,708 resistance. A breakout above 58,708 opens the path toward 59,200–59,600 (channel projection).
🔴 Scenario B — Channel Break
Price fails to hold 57,657 and breaks below the lower channel boundary. This changes the structure from bullish to neutral. Watch 54,851 as major support below.
⚪ Scenario C — Sideways Compression
Price consolidates between 57,657 and 58,708 — another triangle-like compression before the next directional move. Wait for breakout confirmation.
Beginner's Lesson — Why Patterns Inside Channels Matter
When a consolidation pattern like a triangle forms inside a larger trend channel, it acts as a pause — the market is gathering energy before continuing. The breakout from the triangle gives the direction. The channel boundaries give the targets.
This is why reading structure within structure is a powerful skill — the triangle told us direction, the channel told us the target.
Conclusion
BANKNIFTY has completed a clean 3-phase move — Triangle Breakout → Channel Resistance Hit → Pullback. The 57,657 zone is now the most important level to watch on the 1H timeframe.
Watch for a reaction at 57,657. That will tell the next story.
For educational purposes only. Not financial advice. Always manage your risk.
BSE Holding Trendline Support, Bulls Eyeing Higher LevelsPrice is currently trading near the 4000 level and holding above the rising trendline support. The 3930–3950 zone remains the key short-term support area.
As long as buyers defend this level, the bullish structure stays intact with a potential move toward the 4250–4300 resistance zone.
However, a decisive break below 3930 could weaken the trend and open the door for a deeper correction toward 3600.
Key Levels
Support: 3930–3950
Major Support: 3600( downsite after breaking the current support )
Resistance: 4250–4300
Bullish above support, cautious below 3930.
thank you !!
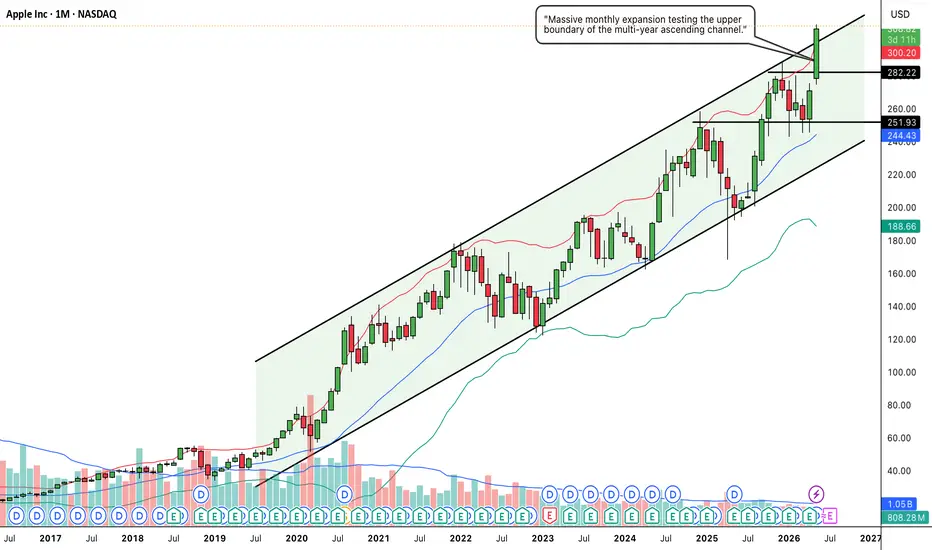
AAPL: Monthly Ascending Channel & Resistance Breakout1. The Macro Perspective: The Secular Ascending Channel
I am taking a LONG bias on Apple Inc. (AAPL) on the monthly (1M) timeframe.
When analyzing pure market structure on a mega-cap tech leader, long-term trend channels dictate the primary narrative. Look at the structural development on this chart. Since the pandemic crash in early 2020, AAPL has been flawlessly respecting a massive ascending parallel channel. This channel acts as a mechanical roadmap: the lower boundary consistently serves as a deep-value accumulation floor, while the upper boundary acts as a profit-taking zone. Following the most recent test of the channel's lower support line in early 2026, institutional buyers aggressively stepped in, launching the stock back toward the top half of the structure. Fundamentally, this fierce momentum aligns perfectly with Apple's recent blockbuster Q2 2026 earnings report, where the company delivered $111.2 billion in revenue and announced a massive new $100 billion share repurchase authorization.
www.investing.com
2. The Educational Setup: Clearing Horizontal Resistance
To understand the technical validity behind this recent thrust, look at how the price interacted with key horizontal levels within the channel:
The 251.93 Support Base: During the mid-channel chop, sellers tried to push the price lower but repeatedly failed at the 251.93 structural support. This established a critical, unbreakable higher low.
The 282.22 Resistance Ceiling: The main obstacle preventing AAPL from reaching the channel top was the solid black horizontal resistance line drawn at 282.22. This marked a major historical pivot where supply previously capped rallies. By chopping tightly beneath this line while the moving averages caught up, the stock built the necessary kinetic energy for a major breakout.
3. Current Price Action: Volatility Expansion and Channel Top
Look at the most recent monthly candle on the far right of the chart. The structural pressure cooker has exploded. Buyers have seized absolute control, printing a massive, full-bodied green expansion candle that has decisively shattered the 282.22 resistance ceiling. The stock has surged to fresh highs near the 311.40 mark, driven by major positive catalysts such as the upcoming CEO transition to John Ternus and Apple's continued dominance in the premium consumption market. Furthermore, this aggressive move has pushed the price directly into the upper boundary of the macro ascending channel.
www.perplexity.ai
4. The Trade Plan: Entries, Targets, and Risk Management
Entry Strategy: Momentum is incredibly strong, but the stock is currently running directly into the upper resistance line of the multi-year channel. Buying blindly at the absolute top of a channel carries a severe risk of a mean-reversion pullback. The highest-probability, lowest-risk entry strategy involves stepping down to the weekly timeframe and waiting for a structural cooling-off period. Look to scale into long positions on a healthy pullback that perfectly retests the broken 275.00 to 285.00 zone. Letting the 282.22 historical resistance prove itself as a concrete new support floor offers a phenomenal risk-to-reward ratio.
Take Profit (Targets): If AAPL can establish the 282.22 level as support, the primary objective is a continued grind along the upper channel boundary, projecting a structural macro target zone of 340.00 to 350.00 over the coming quarters.
Invalidation (Stop Loss): The bullish continuation thesis is severely damaged if the price fails to hold the mid-channel support and collapses back below the breakout zone. A hard stop loss should be placed safely below the 251.93 swing low, around the 240.00 to 245.00 level. A definitive monthly close completely below 240.00 would act as a major warning sign of structural failure and a break of the macro channel.
5. Time Horizon:
Because this technical setup is engineered on a 1-Month chart capturing a secular channel and a major horizontal breakout, this is a longer-term position trade designed to capture sustained macro markup over the coming months and quarters. Let the mega-cap trend run!
SANSERA: The Perfect Ascending Channel and Confluence Bounce1. The Macro Perspective: The Institutional Staircase
I am taking a LONG bias on Sansera Engineering Limited (SANSERA) on the daily (1D) timeframe.
When analyzing pure market structure, the most sustainable and lucrative trends do not go straight up vertically; they move in structured waves. Look at the massive structural development spanning this chart. I have highlighted a textbook "Ascending Channel." This pattern is the ultimate footprint of methodical, long-term institutional accumulation. For months, heavy capital has been systematically walking this stock higher. They aggressively step in to buy every time the price touches the lower trendline (support), and they gracefully take partial profits every time it reaches the upper trendline (resistance), creating a beautiful, rhythmic upward staircase.
2. The Educational Setup: The Power of Confluence
To understand the sheer strength of this current setup, look closely at the mechanics of the recent pullbacks:
The Mid-Line Pivot: Notice how the price frequently interacts with the invisible mid-line of this channel, chopping around the rising 20 SMA (the middle blue line of your Bollinger Bands). This shows a very healthy, balanced trend.
The Concrete Floor: Every major dip that approaches the bottom solid black trendline is met with immediate, aggressive buying pressure. The lower boundary acts as an indestructible structural floor, proving that the underlying macro trend remains entirely intact.
3. Current Price Action: The Golden Bounce
Look at the most recent daily candles on the far right. After reaching the top of the channel near the 2,600 level, the stock suffered a healthy, necessary corrective pullback. But look exactly where the bleeding stopped. The price pulled back to perfectly touch the lower boundary of the ascending channel. Furthermore, notice how the rising 20 SMA perfectly intersected with that trendline. This is a textbook "Confluence Bounce." By printing strong green candles right off this intersection, buyers are loudly confirming that the channel is still dictating the trend.
4. The Trade Plan: Entries, Targets, and Risk Management
Entry Strategy: We are currently sitting right in the "golden entry" zone. The highest-probability, lowest-risk entry involves stepping in right here as the stock launches off this structural confluence in the 2,350.00 to 2,400.00 zone. Buying the confirmed bounce at the bottom of an ascending channel offers a phenomenal risk-to-reward ratio.
Take Profit (Targets): Our targets are dictated entirely by the structure of the channel. The primary structural swing target is a full measured move back up to the upper boundary of the channel, which currently projects comfortably into the 2,800.00 to 2,900.00 zone over the coming weeks. The immediate hurdle will be reclaiming the recent swing high near 2,600.
Invalidation (Stop Loss): A channel-bounce thesis is only valid if the channel holds. A hard stop loss should be placed safely below the lower trendline and the 20 SMA, around the 2,200.00 to 2,250.00 level. A definitive daily close completely breaking down out of the bottom of the channel would act as a massive warning sign of a trend reversal and a severe structural failure.
5. Time Horizon:
Because this technical setup is built on a 1-Day chart capturing a massive structural channel bounce, this is a medium-term swing trade designed to ride the wave back up to the top of the range. Let the channel dictate the trend!
ARMANFIN - Respecting the 7-Year Ascending Channel | WeeklyArman Financial has been trading inside a clean, ascending parallel channel since 2019, now 7 years old and counting. This isn't a drawn channel hunting for a fit. The price has tested the lower boundary three times in seven years and bounced all three times:
→ COVID low (2020)
→ Post-peak correction (2022)
→ MFI sector blowup (2024–25) - the deepest, most brutal test
Each test was accompanied by a different set of macro or sector fears. The structure didn't flinch.
The stock peaked near ₹2,500 in mid-2024 and corrected 57% to the lower band (~₹1,100) over 12 months. The chart is saying the cycle is turning. The technicals are the leading indicator here. When price structure + fundamental cycle inflect at the same point, that is the setup. Notice the compression near lower band for ~6 months before yesterday's breakout candle
Three targets derived purely from channel structure:
T1 : ₹2,447 | Channel midline (first mean-reversion target)
T2 : ₹3,115 | Upper half of channel, channel mid-to-upper zone. Requires sector re-rating + earnings recovery. Not a stretch if MFI cycle turns.
T3 : ₹6,000 | Upper channel boundary (2027–28 projection)
This is what the channel structure implies if the business compounds and the structure holds. Ambitious, but the math of a 7-year channel justifies it.
Invalidation: Weekly close below ₹1,350
If price re-enters below the lower band on a closing basis, the thesis is off.
This is a technical setup note. Not investment advice. Do your own due diligence.
XAUUSD Reaction From Support Zone Possible Bullish Move Toward RXAUUSD Reaction From Support Zone | Possible Bullish Move Toward Resistance
Gold (XAUUSD) on the 45-minute timeframe is currently approaching a strong support zone around 5000 – 5020. This area has previously acted as an important demand level where buyers stepped into the market. 📉➡️📈
After a clear bearish move from the resistance zone near 5220, the price is now testing this support again. When price reaches strong support levels, we often see a potential reaction or temporary reversal because buyers may start entering the market at these discounted prices.
At the moment, the market structure shows that price is slowing down near the support area, which could lead to a short-term bullish retracement if buyers gain momentum. However, confirmation such as bullish candles or rejection wicks would make the setup stronger.
📍 Possible Trade Plan:
Entry Zone: 5000 – 5020 (Support Area)
Target 1: 5120 (Previous resistance / intraday level)
Target 2: 5200 (Major resistance zone)
Stop Loss: Below the support zone
If the support holds, price may move back toward the 5120 level, which is acting as the first resistance target. A strong breakout above that level could push the market toward the 5200 resistance area.
On the other hand, if the price breaks below the support zone, it could signal further bearish continuation. That’s why proper risk management and confirmation are very important before entering any trade.
This setup is based purely on support & resistance and price action analysis.
⚠️ Disclaimer: This is only market analysis, not financial advice. Always manage your risk and trade responsibly.
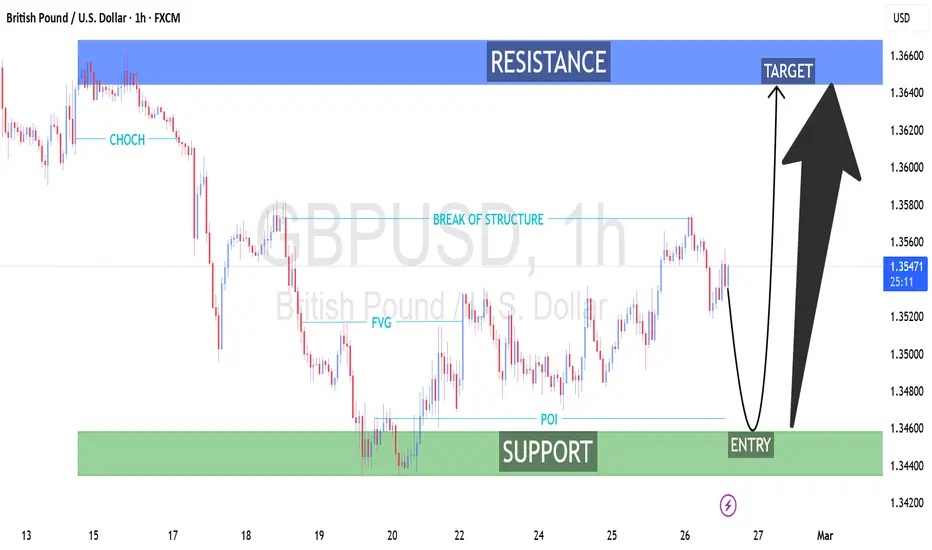
GBP/USD (1H) Technical AnalysisGBP/USD (1H) Technical Analysis
Smart Money Concepts (SMC) Structure-Based Outlook
1. Market Context
On the 1-hour timeframe, GBP/USD is trading within a broader short-term recovery phase after a prior impulsive bearish leg. Price is currently positioned mid-range between a well-defined support zone (demand) and a higher resistance zone (supply).
The chart reflects Smart Money Concepts (SMC) elements including:
CHoCH (Change of Character)
Break of Structure (BOS)
FVG (Fair Value Gap)
POI (Point of Interest)
Clearly defined Support and Resistance zones
2. Structure Analysis
🔹 Early Bearish Phase
A CHoCH signaled the shift from bullish to bearish structure.
This was followed by a strong impulsive sell-off creating a new lower low.
The downside move established a clear bearish order flow.
🔹 Accumulation & Demand Reaction
Price reached a strong support zone (~1.3440–1.3460).
Multiple rejections suggest institutional demand.
This area acts as a higher-timeframe liquidity pool.
🔹 Bullish Break of Structure (BOS)
A subsequent BOS confirmed short-term bullish order flow.
The bullish leg left behind a visible FVG, indicating imbalance.
The POI aligns with discount pricing inside the range.
3. Current Price Position
Price is now:
Retracing from a recent local high (~1.3580 area).
Moving back toward the support zone marked as “ENTRY”.
Potentially completing a corrective pullback before continuation.
This creates a classic pullback-to-demand continuation setup.
4. Trade Scenario Outlook
🟢 Bullish Scenario (Higher Probability Based on Structure)
Pullback into the support/demand zone.
Confirmation via:
Bullish rejection candles
Lower timeframe BOS
Liquidity sweep below support
Target:
Upper resistance zone (~1.3640–1.3660)
Risk-to-reward appears favorable if entry occurs deep in demand.
🔴 Bearish Invalidation
A clean break and sustained close below the support zone.
That would reintroduce bearish continuation toward lower liquidity.
5. Liquidity & Institutional Perspective
Equal highs near resistance suggest buy-side liquidity resting above.
The projected move likely aims to sweep that liquidity.
Market structure currently favors accumulation over distribution.
6. Professional Summary
The 1H structure shows:
Transition from bearish to bullish order flow.
Valid BOS confirming short-term upside bias.
Pullback into demand offering potential continuation entry.
Clear liquidity target at resistance.
Bias: Short-term bullish toward 1.3640–1.3660, provided support holds.
US Dollar Index (DXY) – 2H ChartUS Dollar Index (DXY) – 2H Chart
Distribution at Major Resistance with Pullback Toward Main Support
Executive Summary
The US Dollar Index (DXY) on the 2-hour timeframe is trading into a clearly defined strong resistance zone (~97.55–97.65) after a sustained bullish recovery from the main support area (~96.20–96.40). Price is compressing beneath resistance, showing signs of potential distribution. The structure suggests elevated probability of a corrective move toward lower liquidity, with 96.40 as the primary downside objective.
Market Structure Analysis
1. Higher-Timeframe Context (2H Structure)
Price rebounded sharply from the main support (96.20–96.40).
A Break of Structure (BOS) confirmed bullish intent mid-range.
Subsequent impulsive move created Fair Value Gaps (FVGs), indicating strong institutional participation.
Current price is testing prior supply where multiple rejections previously occurred.
2. Resistance Zone (97.55–97.65)
Clearly defined supply area with prior swing highs.
Multiple recent rejections signal absorption and possible exhaustion.
Liquidity likely rests above recent equal highs — potential for a short-term liquidity sweep before reversal.
3. Support & Downside Targets
Initial pullback level: 97.00 (minor intraday structure)
Intermediate target: 96.70–96.80 (inefficiency fill zone)
Primary target: 96.35–96.40 (Main Support / Point of Interest)
The projected move suggests a rotation back into prior demand, potentially completing a range cycle.
Order Flow & Liquidity Perspective
Market has transitioned from accumulation at lows → markup phase → current distribution near highs.
Compression under resistance often precedes expansion.
Risk-reward favors downside positioning near resistance versus chasing late bullish continuation.
Bias & Scenarios
Primary Bias: Short-term Bearish Rejection
Entry interest near 97.55–97.65
Invalidation: Sustained 2H close above 97.70
Target zone: 96.40
Alternative Scenario (Bullish Continuation)
Clean breakout and hold above 97.70
Would likely trigger stops and fuel expansion toward 98.00+
Requires strong momentum confirmation
Professional Assessment
The structure reflects a classic range-to-range rotation setup:
Buy low (main support)
Sell high (strong resistance)
Unless buyers decisively break and hold above resistance, probabilities currently favor a corrective move lower to rebalance inefficiencies and test demand.
Disclaimer
This analysis is provided for educational purposes only and does not constitute financial, investment, or trading advice. Financial markets involve substantial risk, and past price behavior does not guarantee future results. Always conduct your own research and consult with a licensed financial professional before making trading or investment decisions.
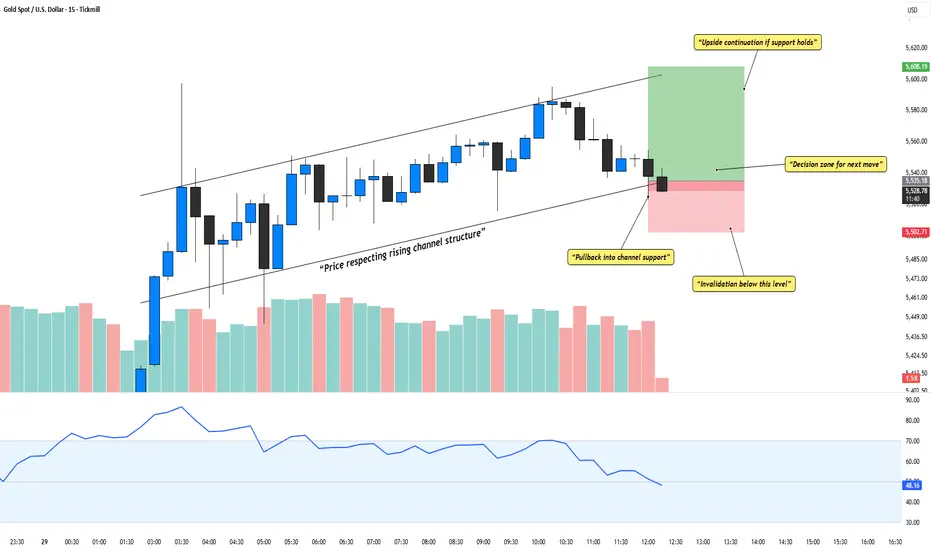
Gold at Make-or-Break Zone | Channel Support Under TestGold is currently trading inside a rising channel and has pulled back toward the lower side of the structure. This move looks more like a healthy correction rather than a breakdown, as long as price continues to hold the marked support area.
If buyers step in near channel support, upside continuation remains possible toward the higher zone. A clear break below support, however, would weaken the structure and shift the bias to the downside. For now, this is a wait-and-react zone, not a chase.
⚠️ Disclaimer
This analysis is for educational purposes only and should not be considered financial advice. Trading involves risk. Please do your own research and use proper risk management.
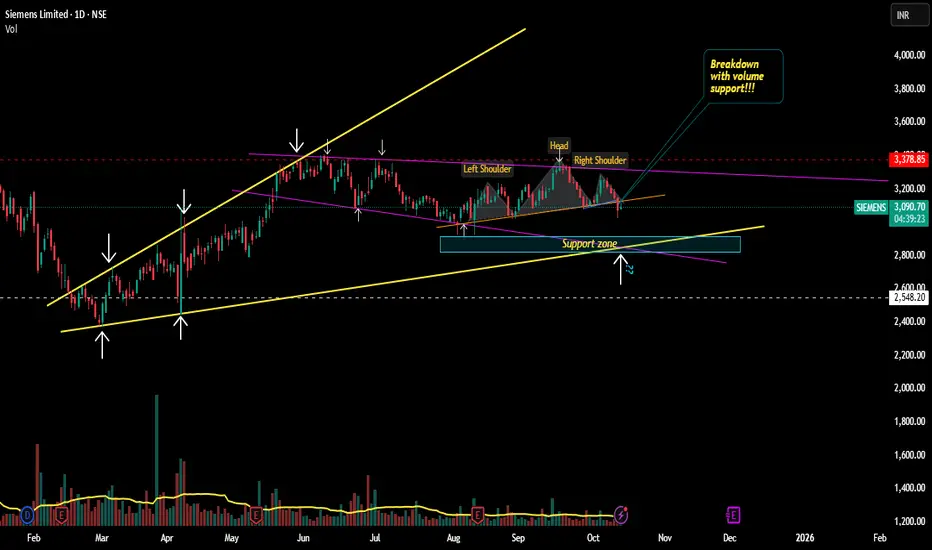
Siemens Down to Support zone??!!Siemens has been travelling inside a Ascending Expanding Channel Pattern(bold yellow line) from March 2025( making higher highs and higher lows )
Now it is in the down move to making a higher low (to support level)
This down move is being done by market in the form of Descending channel pattern making lower highs and lower lows(shown as purple line)
There is also a Head & Shoulders pattern ...which has given BREAKDOWN with Good Volume support (yesterday-13-10-2025)
Siemens is looking to take support at 2900 levels(2920)
SL can be bit choppy (either the high of Breakdown candle/high of right shoulder)
Bearish view can be negated once the red dotted line breaks!!!
Let's wait and watch!!!
Thank you!!!!
Just my view...not a tip nor advice!!!!
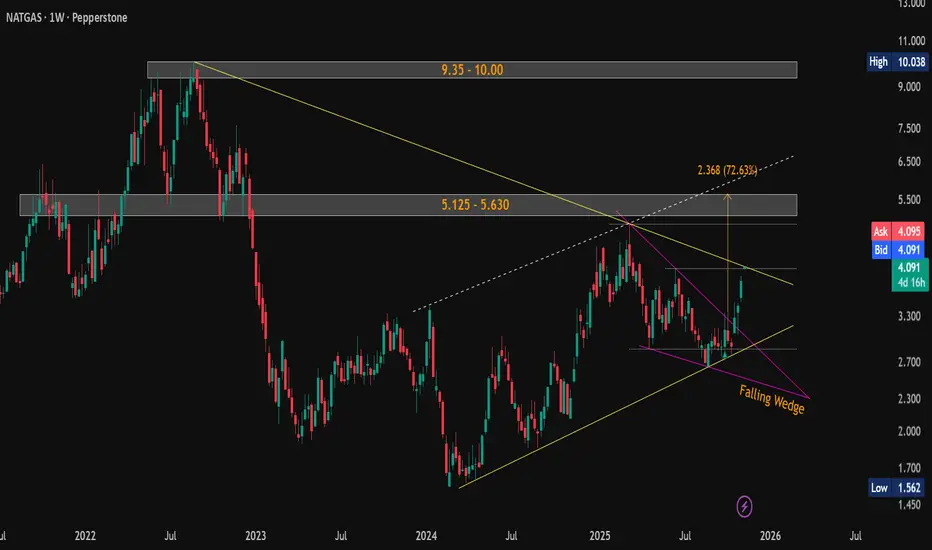
#NaturalGas ($NG) Weekly Update — Testing Critical Resistance!CMP: $4.092
💥 Up +38% from mentioned support ( $3.013–$2.956 ) and +46% from lows in a month . 🚀
The falling wedge breakout played out strongly, and price is now testing the critical resistance of the falling yellow trendline near the previous swing high $4.067 .
A weekly close above this trendline will confirm a major breakout , potentially triggering the next leg higher.
📊 Key Levels:
🛡 Supports: $4.067 / $3.013–$2.956 / $2.692–$2.643
🚧 Resistances / Targets: $5.125–$5.630 / $9.35–$10.00
Structure now forming a larger Symmetrical Triangle between rising and falling yellow trendlines — watch for breakout confirmation .
⚠️ Possible short-term pause/retest before continuation.
#NaturalGas #NG #Commodities #FallingWedge #RisingChannel #SymmetricalTriangle #ChartPattern #PriceAction
📌 #Disclaimer: This analysis is shared for educational purposes only. It is not a buy/sell recommendation. Please do your own research before making any trading decisions.
JSW Steel - Upward Parallel Chanel 📈 JSW Steel is moving in a well-defined Upward Parallel Channel on the weekly timeframe, reflecting a strong and sustained uptrend. The price action has consistently respected the channel boundaries, confirming steady buying interest.
📊 Overbought Condition:
However, the stock is currently trading near the upper band of the channel, with momentum indicators suggesting an overbought zone. This raises the possibility of a cool-off phase or a retracement toward the mean reversion (mid-channel support).
🔎 Momentum Indicators:
RSI readings indicate stretched levels, warranting caution for fresh long entries at current prices.
Volume trends remain supportive of the overall uptrend, but short-term corrections cannot be ruled out.
🎯 Projection & Outlook:
While the medium- to long-term trend stays firmly bullish, traders should watch for a possible retracement toward mid-channel support before fresh accumulation. Sustaining within the channel ensures the continuation of the uptrend, while any breakout above the channel could accelerate momentum further.
⚠️ Disclaimer:
This is a technical projection for educational purposes only and not an investment recommendation. Traders should adopt proper risk management while framing any strategy.
KEC International: Bullish Structure with StrengthSince April 7th, the price structure of KEC International has demonstrated a notable bullish trend reversal, characterized by the formation of higher highs and higher lows along an ascending trendline. This pattern is often interpreted by technical analysts as a sign of strengthening upward momentum.
A recent Fibonacci retracement, drawn from the swing low to the swing high of the current rally, revealed a pullback to the 38.2% level—a zone commonly viewed as a potential support area within a prevailing uptrend. The stock responded positively to this level, rebounding and subsequently closing above the 61.8% retracement level, which is another key technical threshold.
Interestingly, the price has retested the 61.8% level and held firm, suggesting that this area may be acting as a support base. Additionally, the stock has managed to close above its 200-day EMA, a long-term trend indicator that many market participants use to assess broader directional bias. A sustained position above the 200 EMA is generally considered constructive from a trend-following perspective.
From a structural standpoint, based on current chart dynamics, the next potential resistance zone appears to be near ₹948, while the suggested support level is around ₹780 . These levels are derived from historical price action and technical confluence zones, and may serve as reference points for monitoring future price behaviour.
Disclaimer: This analysis is intended solely for educational and informational purposes. It does not constitute investment advice or a recommendation to buy, sell, or hold any financial instrument. Market conditions are subject to change, and trading decisions should be made based on individual research, risk assessment, and consultation with a licensed financial advisor.
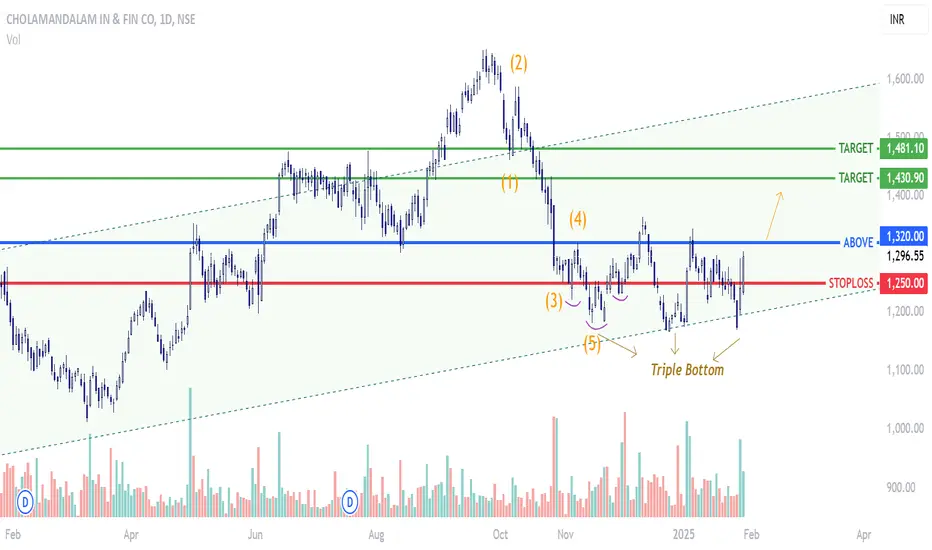
CHOLAFIN - ReassessmentThe last time I posted the chart, the inverted Head and Shoulder pattern was evident and it had signaled that the downward trajectory has been arrested. However, the analysis was premature and with the very close Stoploss we were safely out of the stock. That is the benefit of having a stoploss.
Since then the stock has gone on to form a nice base respecting that bottom zone the Inverted Head and Shoulder had arrested and also now it is making a more evident Triple Bottom on the Support line of the Ascending Channel.
I believe the stock is now ready for an up move.
Flag + W Pattern Combo on Monthly! | #SagCem On Radar🔍 #OnRadar
#SagCem (Sagar Cements Ltd.)
🚩 Flag + W Pattern Combo on Monthly!
📈 Chart Timeframe: Monthly & Quarterly (Educational Observation Only)
📊 Technical Structure Overview:
A rare confluence of bullish patterns spotted:
🚩 #FlagPattern — classic continuation structure
🔻🔻 #WPattern (Double Bottom) — bullish reversal signal
🔼 Both developing inside a long-term #AscendingChannel
🎯 Potential Pattern Projections:
Flag Target: 560+
W Pattern Target: 450+
🛡 Support Zones:
255
234–209 (Demand cluster)
❌ Pattern Invalidation:
Below 155 on Monthly Closing Basis (MCB)
🧠 Educational Note:
When multiple bullish structures align on higher timeframes, they often lead to explosive moves—if validated by breakout and volume.
⚠️ Disclaimer:
This is not a buy/sell recommendation. Shared strictly for educational and technical study purposes. Always consult your financial advisor before acting on any market insights.
#PriceAction | #TechnicalAnalysis | #ChartPatterns | #FlagPattern | #Wpattern | #AscendingChannel | #InsideBar | #LongTerm
PNB Housing Finance – Weekly Positional Setup🏠 PNB Housing Finance – Weekly Positional Setup
🧭 Strategy: Cup & Handle breakout | 🏦 Sector: Housing Finance / NBFC
🔍 Setup Overview
The stock is trading above key DMAs, indicating strong trend alignment 🔼
Sector momentum is clearly picking up — Housing Finance & NBFCs showing traction 📈
After briefly breaking below its ascending channel, price is now attempting a re-entry — often a bullish sign of reclaiming strength 🔁
A Cup & Handle pattern is forming on the weekly chart — a classical continuation setup 🏺
The first breakout zone was ₹1034.05, which had decent Weekly volume — but caution due to weakness seen in Daily TF 📉
📊 Volume Insight (Why It Matters)
✅ Weekly TF shows volume spike during recent bullish move
⚠️ However, on the Daily TF, red candles had higher volume — suggesting distribution or supply at higher levels
⛔ Avoid low-volume breakouts — these tend to fail or trap early entries
🔑 Wait for a clean Weekly close above ₹1086.50 with volume support(Risk Takers can take the leap now)
🧩 Confluence Factors (Multiple Confirmations = Stronger Setup)
Pattern is forming inside a long-term ascending channel
Reclaiming the channel = bullish structural strength
Sector strength + stock above all key moving averages = powerful context
All this happening in a period where broader market (Nifty 500) is still below 200DMA, making relative strength stand out
⚠️ Macro & Technical Risks
Price could stall or reverse at the positional target near ₹1432.70 (ATH zone)
Geopolitical uncertainty and macroeconomic shifts (rate changes, FII flow) could derail the move
If volume does not accompany breakout, avoid or reduce position
🛡️ Risk Management & Strategy
Use ₹934.70 as SL, based on structure, strictly on closing basis
Total risk: 13.36%, potential reward: 31.85%, giving R:R = 1 : 2.36
Only enter after clear breakout confirmation with volume
This is a positional setup, not a short-term one.
Most important: Position sizing is critical — don’t overcommit on early setups
🎯 Educational Note
Cup & Handle setups are most powerful when supported by:
Multi-timeframe confirmation 📈
Sectoral strength 🏦
Channel/structural context 📐
Volume breakout 📊
Patience is your edge. Enter only when all the pieces align.
Disclaimer: This analysis is for educational and informational purposes only. It does not constitute investment advice or a recommendation to buy or sell any securities. Always conduct your own research and consult with a qualified financial advisor before making any trading decisions. Past performance is not indicative of future results. Trade responsibly.
TORNTPHARM Final Bearish move before bulls entry????Yesssss!!!! Chart patterns suggest me the above titled opinion...
TORNTPHARM has been travelling in a Ascending Expanding channel pattern IN A BULLISH MODE MAKING SERIES OF HIGHER HIGHS AND HIGHER LOWS... (shown below)
Inside the bullish pattern , it is now currently in the downward phase that too inside rectangular descending channel pattern making a SERIES OF LOWER HIGHS AND LOWER LOWS....
It's moving like a written script till now....let's wait and watch whether the director(market) has any twist in the script or not!!!
This is just my opinion....not a tip nor advice!!!!
Thank you!!!!!!!
Manappuram Finance - Trade Setup📊 Trade Plan:
Entry: Above ₹215 if broken out with volume.
Stop Loss: ₹192.95 (Closing basis).
Target: Watch price action near ₹231 (ATH); safe traders wait for a daily close above it.
Position Sizing: Buy in small quantities and accumulate gradually.
📈 Why This Stock?
Technical Setup:
Trading above key DMAs (Daily Moving Averages).
Stock was in an uptrend (June-Aug 2022) but fell out of the channel and gapped down significantly (Oct 24, 2022).
Now recovering and trading near ATH (₹231), forming another channel.
Entry possible above ₹215 if broken with volume.
Watch for ₹231 breakout with volume (4-year trading range).
Finance index has broken out of base and is trading above key DMAs.
⚠️ Market Conditions & Risks:
We are trading against the trend (LL-LH structure).
The overall market is below the 50 & 200 DMA, indicating potential further dips.
Trades are more prone to failure unless the market structure changes.
Safe traders should wait for confirmation before entering.
📊 Fundamentals (Key Data)
Market Cap: ₹18,107 Cr
Current Price: ₹214
52-Week High/Low: ₹230 / ₹138
Stock P/E: 9.21
ROCE: 13.8%
ROE: 20.6%
🚨 Disclaimer:
⚠️ This is not financial advice. We are trading against the broader trend, meaning the risk of failure is high. Do your own analysis before taking any trade. Always manage risk and trade cautiously! 🚀
Muthoot Finance | VCP Pattern in Play Muthoot Finance | VCP Pattern in Play 🔍
Technical Overview
📈 Trend: Uptrend, trading within an ascending channel.
🔄 Pattern: Volatility Contraction Pattern (VCP) in progress, signaling potential explosive movement.
📉 Correction: The stock corrected ~15% during the recent market sell-off but rebounded strongly, re-entering the channel. It’s now only ~9% off its recent ATH, showcasing resilience.
Key Levels to Watch
✅ Entry Point: Breakout above ₹2279 with strong volume and a wide-range candle.
🎯 Targets:
T1: ₹2492 (R:R = 1:1)
T2: ₹3200+ (post-market stabilization, aiming for R:R = 1:2)
🛡️ Stop Loss: ₹2067.9 (below the most recent swing low to manage risk).
Strategy
1️⃣ Enter 30% position on a clean breakout above ₹2279. Wait for a retest and continuation to add the rest.
2️⃣ If the breakout is sharp and you miss the entry, wait for a retest and continuation before entering, do not enter in FOMO.
3️⃣ Once T1 is hit, book partial profits to lock in gains, given the weak market conditions.
4️⃣ Hold the remaining position as per your risk appetite and trail your SL to protect profits.
Why This Stock?
⭐ Resilience: Despite the correction, Muthoot Finance re-entered the channel, showing strength against market headwinds.
📊 Strong Indicators: RSI is rising, signaling bullish momentum, and the VCP pattern suggests tightening volatility before a potential breakout.
📉 Controlled Drawdown: From its ATH, the stock fell just ~9%, demonstrating relative strength compared to the broader market.
⭐Trading above Key DMAs
Key Risks to Consider
⚠️ Weak Market Conditions: Broader market trends remain bearish, trading below the 200 DMA, increasing the chance of a failed breakout.
⚠️ Volume Dependency: Strong breakout volume is essential to validate the pattern.
⚠️ Market Correlation: Any further market correction could pressure this trade setup and the probability of hitting the SL increases. So trade light.
Who Should Trade This?
1️⃣Aggressive Traders: Can follow the breakout strategy with proper position sizing.
2️⃣Conservative Traders: Wait for market stabilization and a close of NIFTY 50, Nifty 500 above the 200 DMA before entering any trade.
Actionable Insights
🔒 Lock Partial Profits at T1: Secure gains to mitigate risk in this volatile environment.
📈 Trail Your Stop Loss: Once T1 is achieved, manage the trade dynamically to maximize returns.
Disclaimer
This analysis is for educational purposes only and not financial advice. Please conduct your own research and analysis before making any investment decisions. Trading involves significant risk.
Trade wisely and stay disciplined! 🚀📊
SRM CONTRACTORS - At Channel Support The stock has been travelling in an ascending channel respecting the borders in 4 previous instances. Within the channel, we have seen how the stock price action has been repeating itself. As the saying goes history repeats itself, this time again the stock has shown strength at the channel support which in my opinion seems to be indicating a possible rally towards the upper border of the channel. Only time will tell.
Company has reduced debt.
Company is expected to give good quarter
3 Years ROE 34 %
V2 Retail Ltd: CnH Breakout Setup🛒 V2 Retail Ltd: CnH Breakout Setup
Entry: ₹2,002.85
Stop Loss (SL): ₹1,687 (on closing basis; -15.77%)
Target:
🎯 Positional Target: ₹2,323 (+15.98%)
🚀 Why this trade?
Chart Pattern: Clear Cup and Handle (CnH) breakout with the stock trading in an ascending channel.
Trend Confirmation: The stock is maintaining its position above key Daily Moving Averages (DMAs), confirming strength in the uptrend.
Sectoral Tailwind: Budget 2025 brings a positive outlook for the consumption and FMCG sector, supporting this trade's fundamentals.
Volume: Increasing, but it still needs improvement to strengthen the breakout signal.
⚠️ Key Observations and Risks:
Resistance Ahead: The channel top may act as resistance, so price action near these levels should be watched carefully.
Market Context: Broader market trends are weak, making this a counter-trend trade that adds an element of risk.
Volume Concerns: Volume is yet to fully confirm a breakout; a retest is possible.
📚 Educational Insights:
Channel Tops as Resistance: In ascending channels, the upper boundary often acts as dynamic resistance; breakout strength depends on volume.
Risk Management: With a wide stop loss (closing basis), position sizing becomes critical to limit exposure.
This is a positional trade, so short-term fluctuations shouldn’t influence decisions prematurely.
✅ Suggested Approach:
Take small positions initially to minimize risk while testing the market.
Monitor volume and sector strength for additional confirmation.
Avoid over-leveraging in trades with broad SLs, especially in counter-trend setups.
📈💡 "Adapt to market behavior, but always trade with discipline and patience."
Disclaimer: This analysis is for educational purposes only and should not be considered as financial advice. Trading and investing involve significant risk, and past performance is not indicative of future results. Please consult with your financial advisor before making any trading or investment decisions. Always manage your risk and trade responsibly.