VISHNU: Ascending Triangle Break & Retest1. The Macro Perspective: The Secular Trendline Defense
I am taking a LONG bias on Vishnu Chemicals Limited (VISHNU) on the weekly (1W) timeframe.
When analyzing pure market structure, the most powerful and sustainable breakouts occur in alignment with an established macro trend. Look at the massive structural development on this chart. The defining feature is the steep, unbroken ascending trendline (the lower solid black line) that has acted as an indestructible foundation. Every single time the stock experienced a deep, agonizing pullback, institutional buyers aggressively stepped in exactly at this dynamic support line. They refused to let the secular bull trend break, consistently printing higher lows and indicating massive, systemic accumulation over the long term.
2. The Educational Setup: The Squeeze and The Ceiling
To understand the sheer strength of this setup, look at how the price systematically squeezed historical resistance to form a textbook "Ascending Triangle":
The Concrete Ceiling: The stock's recovery was heavily capped by a formidable horizontal resistance line at 570.50. Sellers repeatedly defended this zone, swatting the price down and creating a clear supply ceiling.
The High-Level Squeeze: Notice how the pullbacks became shallower over time, riding the ascending trendline and chopping around the 20 SMA (the middle blue line of your Bollinger Bands). By pressing up against the flat horizontal ceiling while simultaneously forming higher lows, the stock acted like the ultimate pressure cooker. It gracefully transferred shares from impatient retail traders to strong-handed institutional buyers, storing immense kinetic energy as the structure tightened.
3. Current Price Action: The Breakout and the Ultimate Confirmation
Look at the right side of the chart. That pressure cooker exploded, shattering the 570.50 ceiling with a massive, full-bodied green momentum expansion candle that surged past the dashed 594.85 pivot. But in technical analysis, a breakout is only half the battle. The most lucrative entries occur when a stock proves it can defend its newly claimed territory. Look at the current weekly candles on the far right. After an explosive vertical run, the stock is taking a healthy, necessary breather. To amateur traders, massive red candles look like a failed rally. To structural traders, this is a textbook "Break and Retest." The stock pulled back to digest its gains and successfully bounced off the 570.50 breakout line. By holding its ground here, that old, heavy historical resistance is officially being flipped into a brand-new, indestructible structural launchpad.
4. The Trade Plan: Entries, Targets, and Risk Management
Entry Strategy: We are currently sitting in the "golden entry" zone near 599.60. The highest-probability, lowest-risk entry involves stepping down to a daily timeframe to catch this structural pullback. Look for bullish continuation candles to form as the price works its way off the 570.00 to 590.00 support block. Buying the confirmed retest of a multi-month macro ceiling offers a phenomenal risk-to-reward ratio before the next momentum expansion.
Take Profit (Targets): Because the stock is breaking out of a massive macro structure, we use measured targets based on the depth of the pattern. By taking a conservative depth of the ascending triangle (roughly 210 points from the ~360 floor up to the 570.50 ceiling) and projecting it upward from the breakout line, our primary structural macro target sits comfortably in the 780.00 to 800.00 zone over the coming months.
Invalidation (Stop Loss): A break-and-retest thesis is only valid if the new floor holds. A hard stop loss should be placed safely below the 570.50 breakout line and the ascending trendline, around the 490.00 to 510.00 level. A definitive weekly close completely back inside the triangle and breaking below the 20 SMA would invalidate the immediate continuation thesis and signal a severe macro bull trap.
5. Time Horizon:
Because this technical setup is built on a 1-Week chart capturing a massive structural phase transition and a textbook macro retest, this is a medium-to-longer-term position trade designed to capture the explosive new markup phase. Let the macro trend run!  Long
Long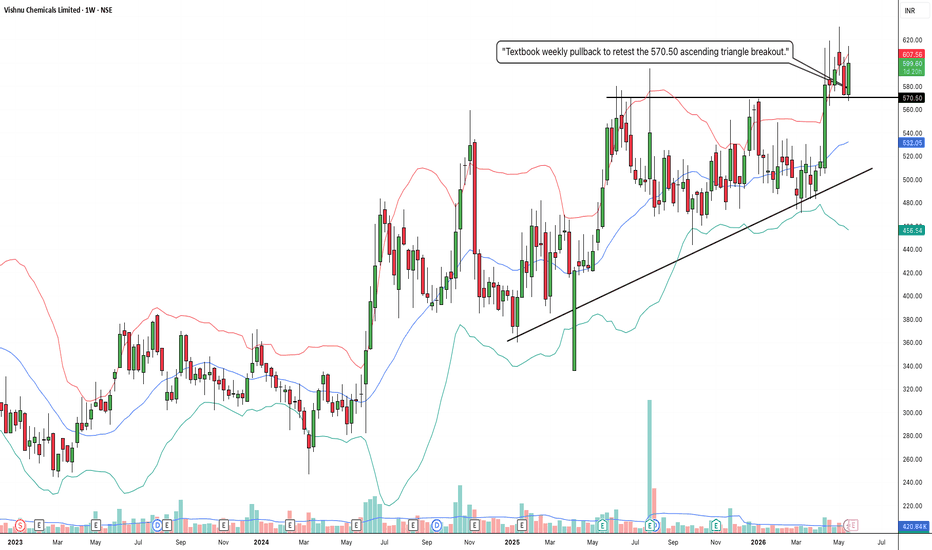
AZAD:MassiveAscending Triangle Breakout andTextbook Macro Retest1. The Macro Perspective: The Secular Trendline Defense
I am taking a LONG bias on Azad Engineering Limited (AZAD) on the weekly (1W) timeframe.
When analyzing pure market structure, the most powerful and sustainable breakouts occur in alignment with an established macro trend. Look at the massive structural development on this chart. The defining feature is the steep, unbroken ascending trendline (the lower solid black line) that has acted as an indestructible foundation since early 2024. Every single time the stock experienced a deep pullback, institutional buyers aggressively stepped in exactly at this dynamic support line. They refused to let the secular bull trend break, consistently printing higher lows and indicating massive, systemic accumulation over the long term.
2. The Educational Setup: The Squeeze and The Ceiling
To understand the sheer strength of this setup, look at how the price systematically squeezed historical resistance to form a textbook "Ascending Triangle":
The Concrete Ceiling: The stock's recovery was heavily capped by a formidable horizontal resistance line at 1,910.25. Sellers repeatedly defended this zone, creating a clear supply ceiling.
The High-Level Squeeze: Notice how the pullbacks became shallower over time, riding the ascending trendline and the 20 SMA (the middle blue line of your Bollinger Bands). By pressing up against the flat horizontal ceiling while simultaneously forming higher lows, the stock acted like the ultimate pressure cooker. It gracefully transferred shares from impatient retail traders to strong-handed institutional buyers, storing immense kinetic energy as the structure tightened.
3. Current Price Action: The Breakout and the Ultimate Confirmation
Look at the right side of the chart. That pressure cooker exploded a few weeks ago, shattering the 1,910.25 ceiling and soaring past the 2,106.50 dashed pivot into pure price discovery. But in technical analysis, a breakout is only half the battle. The most lucrative entries occur when a stock proves it can defend its newly claimed territory. Look at the current red weekly candles. After an explosive vertical run, the stock is taking a healthy, necessary breather. To amateur traders, massive red candles look like a failed rally. To structural traders, this is a textbook "Break and Retest." The stock is pulling back to digest its gains in the golden zone between 1,910 and 2,100. By holding its ground here, that old, heavy historical resistance is officially being flipped into a brand-new, indestructible structural launchpad.
4. The Trade Plan: Entries, Targets, and Risk Management
Entry Strategy: We are currently entering the "golden entry" zone. The highest-probability, lowest-risk entry involves stepping down to a daily timeframe to catch this structural pullback. Look for bullish reversal candles to form as the price works its way into the 1,900.00 to 2,050.00 support block. Buying the retest of a multi-month macro ceiling offers a phenomenal risk-to-reward ratio before the next momentum expansion.
Take Profit (Targets): Because the stock is breaking out of a massive macro structure into pure price discovery, we use measured targets based on the depth of the pattern. By taking a conservative depth of the ascending triangle and projecting it upward from the 1,910.25 breakout line, our primary structural macro target sits comfortably in the 2,800.00 to 3,000.00 zone over the coming months.
Invalidation (Stop Loss): A break-and-retest thesis is only valid if the new floor holds. A hard stop loss should be placed safely below the 1,910.25 breakout line and the rising 20 SMA, around the 1,600.00 to 1,700.00 level. A definitive weekly close completely back inside the triangle and breaking below the ascending trendline would invalidate the immediate continuation thesis and signal a severe macro bull trap.
5. Time Horizon:
Because this technical setup is built on a 1-Week chart capturing a massive structural phase transition and a textbook macro retest, this is a medium-to-longer-term position trade designed to capture the explosive new markup phase. Let the macro trend run!  Long
Long
VIYASH:The Ascending Pressure CookerandExplosive TriangleBrekout1. The Macro Perspective: The Secular Trendline Defense
I am taking a LONG bias on Viyash Scientific Limited (VIYASH) on the weekly (1W) timeframe.
When analyzing pure market structure, the most powerful and sustainable breakouts occur in alignment with an established macro trend. Look at the massive structural development on this chart. The defining feature is the steep, unbroken ascending trendline originating from the washout lows. Every single time the stock experienced a deep, agonizing pullback, institutional buyers aggressively stepped in exactly at this dynamic support line. They refused to let the secular bull trend break, consistently printing higher lows and indicating massive, systemic accumulation over the long term.
2. The Educational Setup: The Squeeze and The Ceiling
To understand the sheer strength of this current breakout, look at how the price systematically squeezed historical resistance to form a textbook "Ascending Triangle":
The Concrete Ceiling: The stock's recovery was heavily capped by a formidable horizontal resistance line at 236.29. Sellers repeatedly swatted the price down from this level over several months.
The High-Level Squeeze: Notice how the pullbacks became shallower over time, riding the ascending trendline and the 20 SMA (the middle blue line of your Bollinger Bands). By pressing up against the flat horizontal ceiling while simultaneously forming higher lows, the stock acted like the ultimate pressure cooker. It gracefully transferred shares from impatient retail traders to strong-handed institutional buyers, storing immense kinetic energy as the structure tightened.
3. Current Price Action: Riding the Upper Band
Look at the most recent weekly candle on the far right. The high-level pressure cooker has absolutely exploded. Buyers have effortlessly shattered the 236.29 macro ceiling with a massive, full-bodied green momentum thrust, pushing the price past 250. Furthermore, notice how the price has violently pierced the upper Bollinger Band, forcing the bands to rapidly expand upward. By decisively clearing this massive resistance zone, VIYASH has initiated a powerful volatility expansion and officially entered a brand-new markup phase.
4. The Trade Plan: Entries, Targets, and Risk Management
Entry Strategy: Momentum is exceptionally strong right now near 251.70. Chasing a massive vertical expansion candle that is riding outside the weekly Bollinger Bands always carries a higher risk of an immediate intraday or daily mean-reversion pullback. The highest-probability, lowest-risk entry involves stepping down to a daily timeframe and waiting for the dust to settle. Look to place limit orders to catch a potential structural pullback to perfectly retest the 230.00 to 238.00 breakout zone. Letting that heavy historical resistance prove itself as a new, indestructible support floor offers a phenomenal risk-to-reward ratio.
Take Profit (Targets): Because the stock is breaking out of a massive macro structure, we use measured targets based on the depth of the pattern. By taking the widest part of the ascending triangle (roughly 90 points from the ~145 floor up to the 236.29 ceiling) and projecting it upward from the breakout line, our primary structural macro target sits comfortably in the 325.00 to 330.00 zone. The immediate psychological milestone will be the massive 300.00 mark.
Invalidation (Stop Loss): A trade thesis is only valid if the new market structure holds. A hard stop loss should be placed safely below the breakout line and the rising trendline, around the 200.00 to 205.00 level (just below the dashed mid-level pivot at 206.31). A definitive weekly close completely back inside the triangle and breaking below the ascending trendline would invalidate the immediate continuation thesis and signal a severe macro bull trap.
5. Time Horizon:
Because this technical setup is built on a 1-Week chart capturing a massive structural phase transition and volatility expansion, this is a medium-to-longer-term position trade designed to capture the explosive new markup phase. Let the new trend run!  Long
Long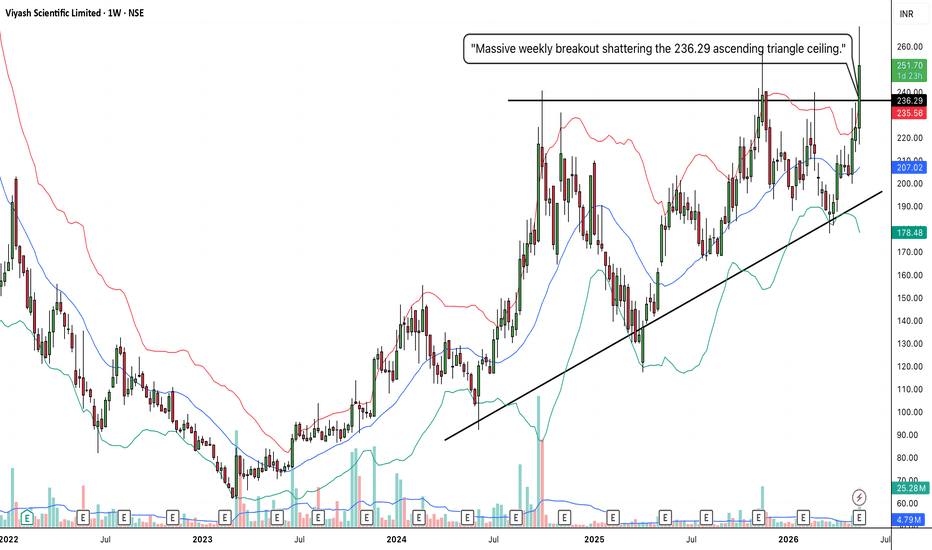
BIOCON: Ascending Triangle Breakout1. The Macro Perspective: The Secular Trendline Defense
I am taking a LONG bias on Biocon Limited (BIOCON) on the weekly (1W) timeframe.
When analyzing pure market structure, the most powerful and sustainable breakouts occur in alignment with an established macro trend. Look at the massive structural development on this chart. The defining feature is the steep, unbroken ascending trendline originating from the bottom left. Every single time the stock experienced a deep, agonizing pullback, institutional buyers aggressively stepped in exactly at this dynamic support line. They refused to let the secular bull trend break, indicating massive, systemic accumulation over the long term.
2. The Educational Setup: The Squeeze and The Ceiling
To understand the sheer strength of this current breakout, look at how the price systematically squeezed historical resistance to form a textbook "Ascending Triangle," confirmed by the Bollinger Bands:
The Concrete Ceiling: The stock's recovery was heavily capped by a formidable horizontal resistance line at 404.75. Sellers repeatedly swatted the price down from this level.
The Volatility Contraction: Notice how the pullbacks became shallower over time, riding the 20 SMA (the middle blue line of your Bollinger Bands). The upper and lower bands began to pinch together right below the 404.75 ceiling. In technical analysis, volatility is cyclical; a massive contraction (a squeeze) is almost always followed by a violent expansion. By pressing up against the horizontal ceiling while forming higher lows, the stock acted like the ultimate pressure cooker.
3. Current Price Action: Riding the Upper Band
Look at the most recent weekly candle on the far right, accompanied by a massive surge in buying volume. The high-level pressure cooker has absolutely exploded. Buyers have effortlessly shattered the 404.75 macro ceiling with a massive, full-bodied green momentum thrust. Furthermore, the price has violently pierced the upper Bollinger Band (currently near 401.69), forcing the bands to rapidly expand. This confirms that a powerful new momentum phase has been initiated, and historical overhead supply has been eliminated.
4. The Trade Plan: Entries, Targets, and Risk Management
Entry Strategy: Momentum is exceptionally strong right now near 426.25. Chasing a massive vertical expansion candle that is riding outside the weekly Bollinger Bands always carries a higher risk of an immediate intraday or daily mean-reversion pullback. The highest-probability, lowest-risk entry involves stepping down to a daily timeframe and waiting for the dust to settle. Look to place limit orders to catch a potential structural pullback to perfectly retest the 400.00 to 405.00 breakout zone. Letting that heavy historical resistance prove itself as a new, indestructible support floor offers a phenomenal risk-to-reward ratio.
Take Profit (Targets): Because the stock is breaking out of a massive macro structure, we use measured targets based on the depth of the pattern. By taking the widest part of the ascending triangle and projecting it upward from the 404.75 breakout line, our primary structural macro target sits comfortably in the 520.00 to 530.00 zone. The immediate psychological milestones are 450.00 and 480.00.
Invalidation (Stop Loss): A trade thesis is only valid if the new market structure holds. A hard stop loss should be placed safely below the breakout line and the most recent structural pivot, around the 370.00 to 375.00 level (just below the 20 SMA). A definitive weekly close completely back inside the triangle and breaking below the ascending trendline would invalidate the immediate continuation thesis and signal a severe macro bull trap.
5. Time Horizon:
Because this technical setup is built on a 1-Week chart capturing a massive structural phase transition and volatility expansion, this is a medium-to-longer-term position trade designed to capture the explosive new markup phase. Let the new trend run!  Long
Long
 Long
Long
WELINV: The Ascending Pressure Cooker and Explosive Vertical Bre1. The Macro Perspective: The Aggressive Accumulation Trend
I am taking a LONG bias on Welspun Investments & Commercials Ltd. (WELINV) on the weekly (1W) timeframe.
When analyzing pure market structure, the steepness of a trendline tells you everything you need to know about institutional urgency. Look at the massive structural development on this chart. After recovering from its macro lows, the stock established a steep, unbroken ascending trendline. Every single time the price pulled back, heavy institutional capital aggressively stepped in at higher and higher prices. They refused to let the stock suffer a deep correction, indicating a massive, underlying accumulation phase.
2. The Educational Setup: The High-Level Squeeze
To understand the sheer strength of this current breakout, look at how the price systematically squeezed historical resistance to form a textbook "Ascending Triangle":
The Structural Floors: Notice how the stock used the dashed 1,316.50 line as a mid-level stepping stone. Once it broke above it, buyers defended it, establishing a higher high-level floor.
The Pressure Cooker Ceiling: The stock's markup phase was temporarily capped by a formidable horizontal resistance line at 1,509.05.
The Squeeze: By aggressively pressing up against the 1,509.05 horizontal ceiling while riding the ascending trendline, the stock acted like the ultimate pressure cooker. It systematically squeezed out early sellers and transferred shares to strong-handed buyers, storing immense kinetic energy for the final launch.
3. Current Price Action: Entering the Price Vacuum
Look at the most recent weekly candles on the far right. The high-level pressure cooker has absolutely exploded. Buyers have effortlessly shattered the 1,509.05 macro ceiling with a massive, near-vertical momentum thrust, pushing the price well into the 1,650 zone. By decisively clearing this massive high-level accumulation step, WELINV has officially entered "Blue Sky Territory" (pure price discovery). Historical overhead supply has been completely eliminated.
4. The Trade Plan: Entries, Targets, and Risk Management
Entry Strategy: Momentum is exceptionally strong right now near 1,652.40. Chasing a massive, vertical expansion candle on the weekly timeframe always carries a high risk of agonizing intraday drawdowns as the stock naturally breathes. The highest-probability, lowest-risk entry involves stepping down to a daily timeframe and waiting for the dust to settle. Look to place limit orders to catch a potential structural pullback to retest the 1,500.00 to 1,520.00 breakout zone. Letting that heavy historical resistance prove itself as a new, indestructible support floor offers a phenomenal risk-to-reward ratio.
Take Profit (Targets): Because the stock is in pure price discovery, we use measured structural targets based on the depth of the pattern. By taking the depth of the recent massive swing (roughly 600 points from the ~900 trendline origin to the 1,509.05 ceiling) and projecting it upward, our primary structural macro target sits comfortably in the 2,100.00 to 2,150.00 zone. Immediate psychological milestones are 1,800.00 and 2,000.00.
Invalidation (Stop Loss): A trade thesis is only valid if the new market structure holds. A hard stop loss should be placed safely below the breakout line and the dashed mid-level pivot, around the 1,280.00 to 1,300.00 level. A definitive weekly close completely back inside the triangle and breaking below the ascending trendline would invalidate the immediate continuation thesis and signal a severe macro bull trap.
5. Time Horizon:
Because this technical setup is built on a 1-Week chart capturing a massive structural phase transition and ascending triangle breakout, this is a medium-to-longer-term position trade designed to capture the explosive new markup phase. Let the new trend run!  Long
Long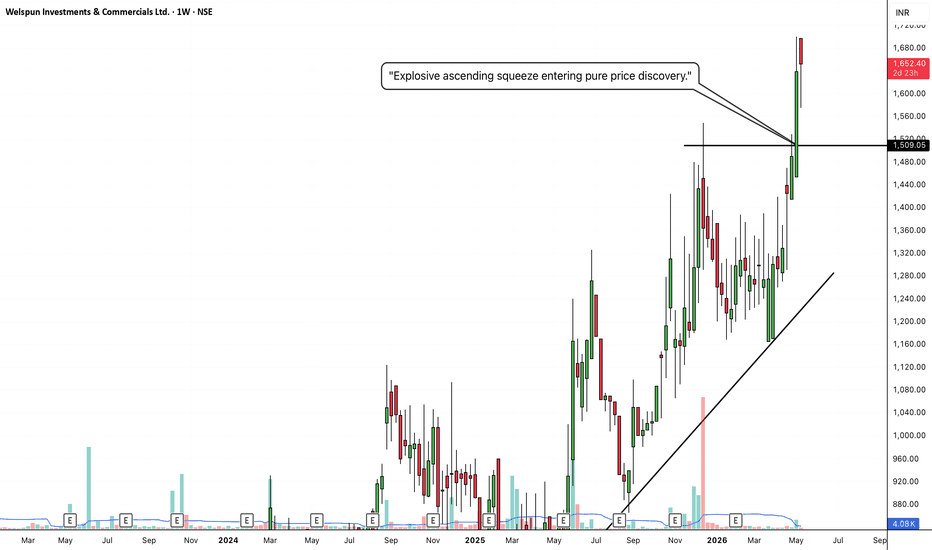
GRAPHITE: Multi-Year Ascending Triangle Breakout to Fill the Mac1. The Macro Perspective: The Boom, The Bust, and The Base
I am taking a LONG bias on Graphite India Limited (GRAPHITE) on the absolute macro monthly (1M) timeframe.
When analyzing pure market structure on a monthly chart, we are looking at the true footprints of heavy institutional capital playing out over years. Look at the massive structural development on this chart. In 2018, the stock established its ultimate historical ceiling at the solid red 883.50 line. What followed was a brutal, multi-year markdown phase that completely decimated weak hands. However, instead of bleeding into a permanent bear market, the stock found an absolute floor in 2020. For the last four years, the stock has been quietly carving out a massive accumulation phase, systematically grinding its way back up the chart.
2. The Educational Setup: The Ascending Pressure Cooker
To understand the sheer strength of this current breakout, look at how the price systematically squeezed historical resistance to form a textbook macro "Ascending Triangle":
The Dual Ceilings: The stock's recovery was heavily capped by a formidable dual-resistance zone consisting of the solid black lines at 662.90 and 698.50.
The Aggressive Trendline: Notice the defining feature of this right-side recovery: the steep, unbroken ascending trendline originating from the 2020 lows. Every time the stock pulled back from the black resistance lines, institutional buyers stepped in earlier and earlier, forming a beautiful sequence of higher lows.
The Squeeze: By aggressively pressing up against the horizontal ceilings while forming higher lows, the stock acted like the ultimate pressure cooker. It squeezed short-sellers and transferred millions of shares to strong-handed buyers, storing immense kinetic energy for the final launch.
3. Current Price Action: Entering the Price Vacuum
Look at the most recent monthly candle on the far right. The multi-year pressure cooker has absolutely exploded. Buyers have effortlessly shattered both the 662.90 and 698.50 macro ceilings with a massive, full-bodied green momentum thrust. By decisively clearing this multi-year accumulation zone, GRAPHITE has officially confirmed a secular trend shift. More importantly, it has entered a "Price Vacuum." Looking to the left, there is very little structural resistance between the current price and the ultimate red 883.50 level.
4. The Trade Plan: Entries, Targets, and Risk Management
Entry Strategy: Momentum is exceptionally strong right now near 731.30. Because this is a monthly breakout, chasing a massive vertical expansion candle on smaller timeframes carries a higher risk of agonizing drawdowns. The highest-probability, lowest-risk entry involves stepping down to a weekly or daily timeframe and waiting for the dust to settle. Look to place limit orders to catch a potential structural pullback to retest the 680.00 to 700.00 breakout zone. Letting those years of heavy resistance prove themselves as a new, indestructible support floor offers a phenomenal risk-to-reward ratio.
Take Profit (Targets): The primary macro target is undeniable: the massive red historical resistance line sitting at 883.50. The stock is attempting to complete a massive, multi-year round trip to fill that void.
Invalidation (Stop Loss): A macro trade thesis is only valid if the new market structure holds. A hard stop loss should be placed safely below the recent monthly accumulation and the ascending trendline, ideally near the dashed 550.85 mid-level pivot. A definitive monthly close completely back inside the old base and below 600.00 would invalidate the immediate continuation thesis and signal a severe macro bull trap.
5. Time Horizon:
Because this technical setup is built on a 1-Month chart capturing a massive, multi-year structural phase transition, this is a long-term position trade/investment designed to capture a secular markup phase that could play out over several quarters. Let the macro trend run!  Long
Long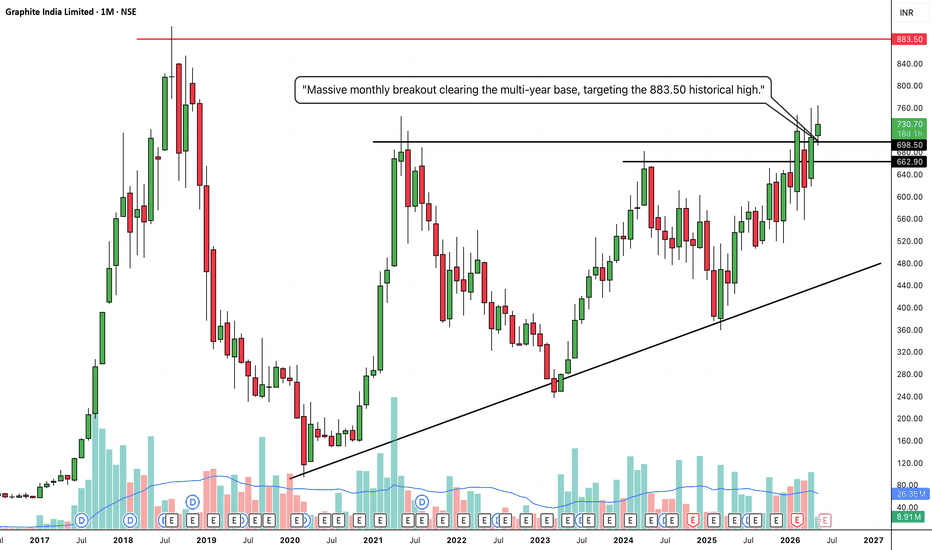
 Long
Long
UNP: Massive Macro Breakout From Multi-Year Ascending TriangleThe Setup (Bias): I am taking a LONG bias on Union Pacific Corporation (UNP) on the macro monthly (1M) timeframe.
The "Why" (Technical Reasons): 1. Ascending Triangle Breakout: The price has powerfully broken out of a massive, multi-year ascending triangle pattern. After years of buyers continually stepping in at higher prices (indicated by the rising lower trendline), they have finally overwhelmed the sellers and cleared the flat-top historical resistance at $252.27.
2. Macro Bullish Momentum: The breakout is confirmed by a strong, full-bodied monthly green candle. Breaking out of a structural pattern of this size on a monthly chart indicates a high probability of a sustained, long-term trend continuation.
Trade Plan (Entry & Exits): * Entry: Momentum and position traders can look for entries near the current market price of $268.70. A more conservative, lower-risk approach would be scaling in on a potential monthly pullback to retest the $252.27 breakout line, letting that old historic ceiling prove itself as a new floor.
Take Profit (Target): Based on the measured move of a triangle this large, the momentum can carry it significantly higher. The next major psychological target is the $300.00 milestone, followed by $320.00.
Stop Loss: Placed safely below the breakout line and the rising trendline support, around $230.00. A monthly close below this level would invalidate the ascending triangle structure.
Duration: Because this analysis is built on a massive 1-Month chart, this is a long-term position trade designed to play out over the coming months to years.  Long
Long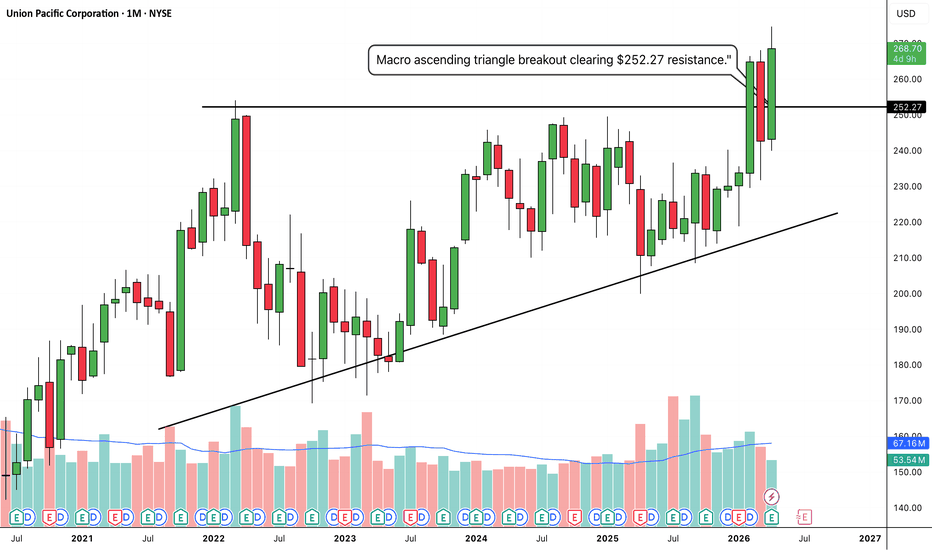
 Long
Long
Aditya Birla Sun Life AMC Ltd (D): Strong Bullish(Timeframe: Daily | Scale: Linear)
Overall View: 🐂 Strong Bullish (Ascending Triangle Breakout)
The stock has confirmed a major structural breakout from an Ascending Triangle. Despite intraday profit-booking today (forming a bearish-looking candle), the broader trend remains powerfully intact as it sustains above previous resistance levels.
🚀 1. The Fundamental Catalysts (The "Why")
The technical breakout is heavily supported by sector and company-specific tailwinds:
> Q3 Earnings Momentum: The company delivered strong quarterly results, showing solid growth in operating revenue and net profit, confirming that valuations are backed by real growth.
> Sector Tailwinds: The Indian mutual fund industry continues to see record-breaking monthly SIP inflows, providing a steady stream of AUM (Assets Under Management) growth for top-tier AMCs.
📈 2. The Chart Structure (The Breakout & Re-test)
> The Pattern: An Ascending Triangle , characterized by a flat upper resistance (₹894–₹900) and higher lows pushing up against it.
> Today's Action (The Gap-Up): Opening gap-up at ₹926 shows aggressive pre-market demand.
- The intraday fall to close at ₹918 indicates standard profit-booking at new All-Time Highs (creating the red candle).
- Significance: This is perfectly healthy. As long as the stock doesn't fall back into the triangle, today's bearish candle is just a temporary pause, not a reversal.
📊 3. Volume & Indicators
> EMAs: The Positive Cross-Over (PCO) across Monthly, Weekly, and Daily timeframes confirms absolute trend harmony. The stock is in a confirmed "Markup Phase."
> RSI: The RSI is rising into the "Overbought" zone (>70). In a Blue Sky breakout (New ATH), RSI can remain overbought for extended periods. It is a sign of strong momentum, not an immediate sell signal.
> Volume: The volume is above average, confirming institutional participation in the breakout.
🎯 4. Future Scenarios & Key Levels
The stock is in unchartered territory, making Fibonacci extensions the best targeting tool.
🐂 Bullish Targets (The Extension):
- Target 1: ₹980.
- Target 2: ₹1,015.
🛡️ Support (The "Must Hold"):
- Immediate Support: ₹894 – ₹900. The Polarity Principle dictates that this former ceiling must now act as a rigid floor. Today's close safely above it is a major positive.
- Structural Support / Stop Loss: ₹850. If the stock slices through ₹894, the immediate safety net is the upward-sloping trendline of the triangle near ₹850. A daily close below this invalidates the bullish setup.
Conclusion
This is a High-Quality Breakout Setup.
> Refinement: Don't let today's red candle shake you out. It is a natural "cooling off" after a gap-up to a new ATH.  Long
Long
 Long
Long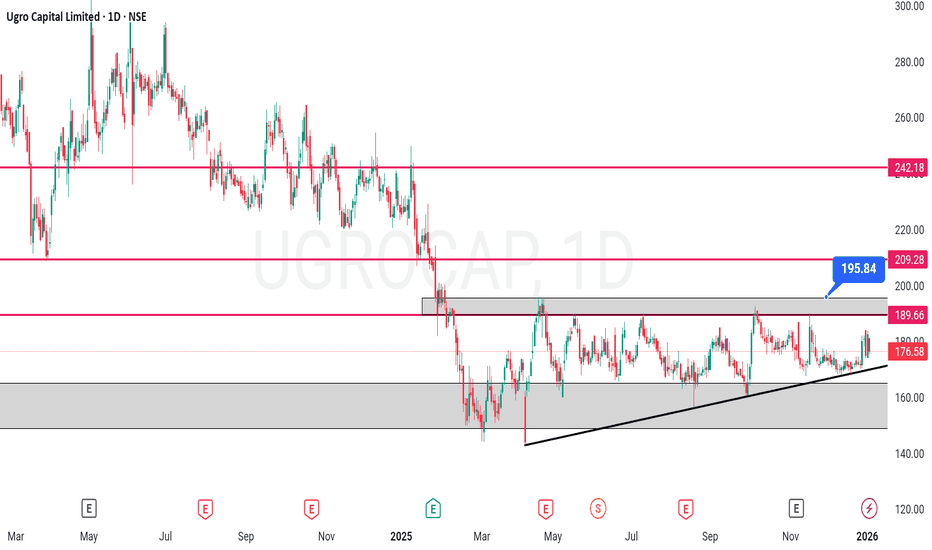
 Short
Short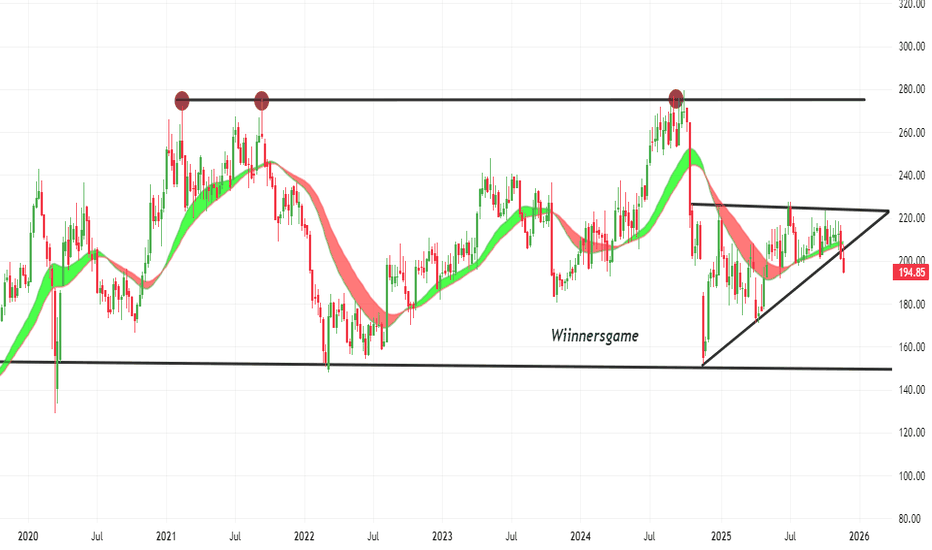
 Short
Short
 Long
Long
 Long
Long
Supriya Lifescience (W): Bullish, Awaiting Breakout ConfirmationThe stock is in a classic bullish consolidation pattern. After establishing a major bottom in March 2023, the price has been in a clear uptrend. The current "Ascending Triangle" pattern shows that pressure is building for a significant move.
📈 1. The Dominant Pattern: Ascending Triangle
- Formation: Since October 2024, the stock has been forming a clear Ascending Triangle. This is defined by:
1. A flat, horizontal resistance line that has rejected multiple breakout attempts.
2. A rising support trendline , indicating that buyers are stepping in at progressively higher prices.
- Implication: This pattern is bullish because it shows that sellers are holding a fixed line, but buyer aggression is steadily increasing.
🚀 2. The Current Setup (The "Coiling Spring")
- Pressure Building: The stock has made several attempts to break the resistance and failed. This is normal and builds energy for the eventual move.
- Imminent Test: The stock is once again testing this critical resistance this week . The price is being compressed between the rising support and the flat resistance, which usually precedes a volatile move.
📊 3. Key Technical Indicators
- RSI: The Relative Strength Index is rising on both the Monthly and Weekly timeframes. This shows that long-term and medium-term momentum is building in favor of the buyers.
- EMAs: The short-term Exponential Moving Averages are in a "PCO" (Price Crossover) state, confirming the immediate trend is bullish.
🎯 4. Future Scenarios & Key Levels to Watch
This setup provides two very clear outcomes:
🐂 The Bullish Case (Breakout)
- Trigger: A decisive, high-volume close above the horizontal resistance of the triangle.
- Confirmation: This move would confirm the triangle is complete and the next leg of the uptrend has begun.
- Target: The next logical price target would be ₹1,300 .
🐻 The Bearish Case (Breakdown)
- Trigger: The stock fails at resistance again and, more importantly, breaks below the triangle's rising support trendline .
- Confirmation: This would invalidate the bullish pattern.
- Target: The price would likely fall to retest the next major horizontal support level at ₹710 .  Long
Long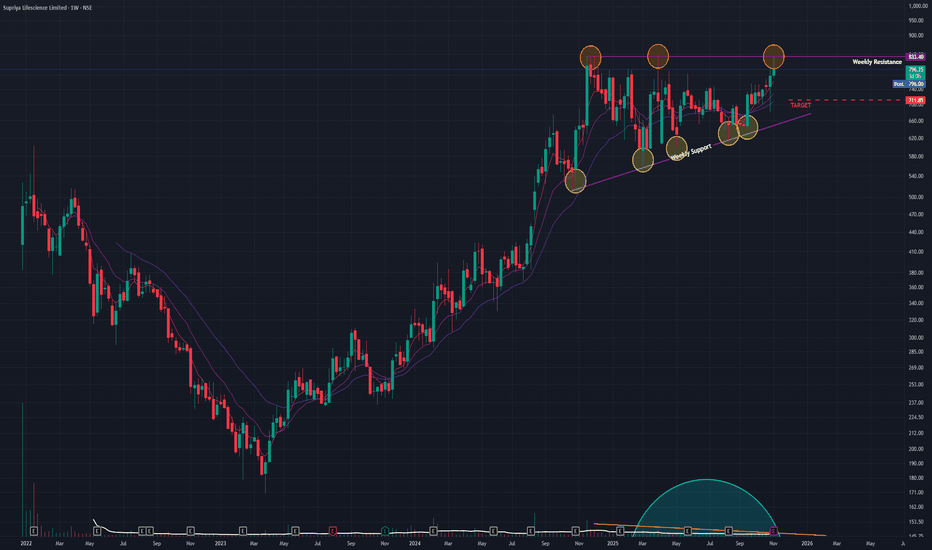
JSW Energy (W) - Coils in Bullish Triangle, Awaiting BreakoutAfter a prolonged downtrend from its September 2024 peak, JSW Energy is showing clear signs of a potential trend reversal, as it meticulously forms a classic bullish pattern. The stock is now approaching a critical decision point.
The Setup: An Ascending Triangle
Since February 2025, the stock has been forming a classic Ascending Triangle . This bullish pattern is characterized by:
- A series of Higher Lows , indicating that buyers are becoming more aggressive on each pullback.
- A flat horizontal resistance of Equal Highs , which has rejected several breakout attempts in recent weeks.
Crucially, as is typical for this type of consolidation pattern, trading volume has been noticeably drying up . This suggests that selling pressure is diminishing and energy is being stored for a potential significant move.
A Nuanced Technical Picture
The technical indicators suggest a trend that is in the process of turning bullish but has not yet received full confirmation across all timeframes:
- EMA: The short-term Exponential Moving Averages (EMAs) show a bullish crossover on the Weekly chart, but the longer-term Monthly chart is still awaiting this signal.
- RSI: The Monthly RSI is already rising (a positive long-term sign), but the Weekly RSI has yet to follow suit with a definitive upward trend.
This mix indicates that while medium-term strength is building, a decisive breakout is needed to align all timeframes and confirm a new, sustained uptrend.
Outlook and Key Triggers to Watch
The resolution of this triangle will likely dictate the stock's next major move.
- Bullish Breakout Scenario: A decisive close above the horizontal resistance on a surge of volume would confirm the breakout. This would signal the start of a new uptrend, with a potential next target of ₹650 .
- Bearish Scenario: If the stock loses momentum and fails to break out, it could fall back to test the rising support trendline of the triangle. The key support level to watch in this case is ₹485 .
The price action in the coming week will be critical. The focus should be on whether the bulls can finally generate the momentum needed to break through the overhead resistance and complete this bullish reversal pattern. Long 
 Long
Long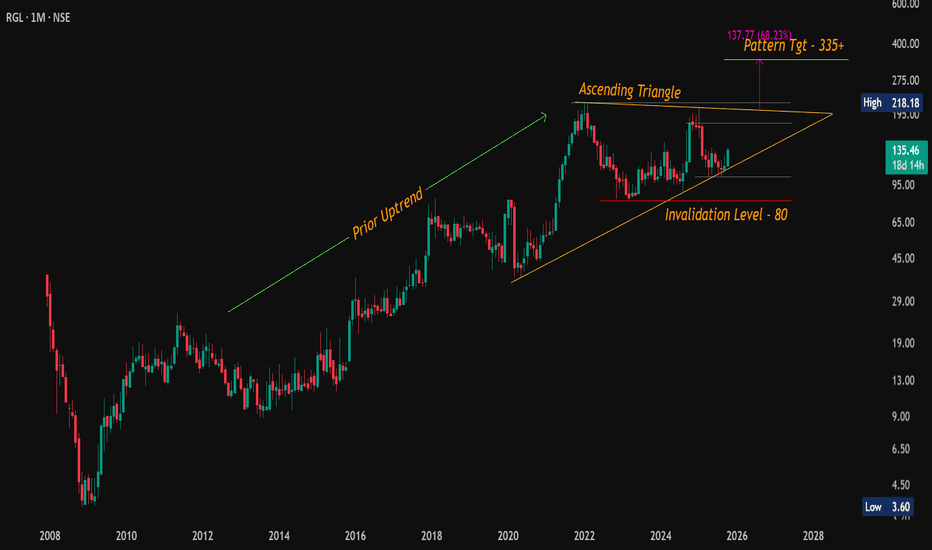
NETWEB: AI Infrastructure Goldmine ? Chart of the MonthNSE:NETWEB MarchingTowards 4,000: Is This the AI Infrastructure Goldmine You've Been Waiting For? Let's analyze in the "Chart of the Month".
As per the Latest SEBI Mandate, this isn't a Trading/Investment RECOMMENDATION nor for Educational Purposes; it is just for Informational purposes only. The chart data used is 3 Months old, as Showing Live Chart Data is not allowed according to the New SEBI Mandate.
Disclaimer: "I am not a SEBI REGISTERED RESEARCH ANALYST AND INVESTMENT ADVISER."
This analysis is intended solely for informational purposes and should not be interpreted as financial advice. It is advisable to consult a qualified financial advisor or conduct thorough research before making investment decisions.
Price Action Analysis:
- Current Price: ₹3,695.40
- 52-Week Range: ₹738.60 - ₹3,745.00
- Recent Performance: +64% gain in a Month with strong momentum
- Price structure shows consistently higher highs and higher lows pattern
- Stock has demonstrated remarkable resilience with a 380% rally from its 52-week low
Volume Spread Analysis:
- Volume surge visible during recent breakout phases
- High volume of 24.25M shares traded, indicating institutional participation
- Volume expansion coinciding with price breakouts confirms genuine buying interest
- Strong volume accumulation during consolidation phases suggests smart money positioning
Chart Patterns Identified:
- Symmetrical Triangle Breakout: Successfully broken above the triangle pattern
- Ascending Triangle: Multiple resistance tests followed by decisive breakout
- Flag and Pennant Patterns: Short-term consolidation after sharp moves
Key Technical Levels:
Support Levels:
- Immediate Support: ₹3,200 (recent consolidation zone)
- Strong Support: ₹2,800 (previous resistance turned support)
- Major Support: ₹2,400 (trendline support and psychological level)
- Critical Support: ₹2,000 (long-term ascending trendline)
Resistance Levels:
- Immediate Resistance: ₹3,745 (52-week high)
- Next Resistance: ₹4,000 (psychological round number)
- Extended Resistance: ₹4,400 (measured move projection)
- Long-term Resistance: ₹5,000
Base Formation:
- Primary Base: ₹1,200-₹1,600 range (established during deep consolidation)
- Secondary Base: ₹2,400-₹2,800 range (recent re-accumulation zone)
- The stock has clearly established a strong foundation above the ₹2,400 levels
Technical Indicators Assessment:
Momentum Indicators:
- RSI is in overbought territory but showing positive divergence
- MACD showing bullish crossover with expanding histogram
- Stochastic indicates strong upward momentum
- ADX suggesting strong trending behaviour
Moving Averages:
- Price trading well above all major moving averages
- 20 EMA, 50 EMA, and 200 EMA in perfect bullish alignment
- Strong uptrend confirmed by ascending moving averages
- No signs of trend reversal in the near term
Sectoral and Fundamental Backdrop:
AI Infrastructure Sector Outlook:
- India's IndiaAI Mission with ₹10,372 crore budget creating massive opportunities
- Government's push for sovereign AI infrastructure benefiting domestic players
- Global demand for AI computing infrastructure is experiencing exponential growth
- Limited domestic competition in the high-end computing solutions space
Company-Specific Fundamentals:
- Netweb's supercomputers have appeared 15 times across three entries in the global Top 500 supercomputers ranking
- The company is almost debt-free with a market cap of ₹20,936 crore
- Recent order wins worth ₹1,734 crore for IndiaAI Mission and ₹450 crore additional order
- Order pipeline of ₹4,142.1 crore as of June 2025, excluding new mandates
Key Growth Catalysts:
- Delivery of servers built on NVIDIA's Blackwell Architecture for India's Sovereign AI System
- Expanding presence in high-performance computing and AI systems
- Strong relationships with global technology partners
- Beneficiary of the government's Digital India and AI initiatives
Financial Performance Metrics:
- Strong revenue visibility from a large order book
- Improving profit margins due to premium product offerings
- Healthy cash flows supporting future expansion
- Zero debt structure providing financial flexibility
Strategic Outlook:
- Expect continued momentum driven by the AI infrastructure theme
- News-driven volatility possible around order execution updates
- Sector rotation into a technology infrastructure play is expected
- Quarterly results will be the key catalyst for sustained momentum
- India's AI infrastructure buildout is a multi-year opportunity
- The company is well-positioned to capture significant market share
Risk Factors to Monitor:
Technical Risks:
- Overbought conditions may lead to profit-taking
- High volatility expected given the stock's momentum
- Any break below ₹3,000 would signal trend weakness
Fundamental Risks:
- Execution risk on large government orders
- Competition from global players in AI infrastructure
- Technology disruption risks in a rapidly evolving sector
- Dependence on government spending cycles
Market Risks:
- Overall market correction could impact high-beta stocks
- Sector rotation away from technology themes
- Global supply chain disruptions affecting component availability
My 2 Cents:
NSE:NETWEB presents a compelling technical setup with strong fundamental support from India's push for AI infrastructure. The stock's breakout from multiple chart patterns, combined with substantial order wins and sector tailwinds, creates an attractive risk-reward proposition. However, position sizing and disciplined risk management remain crucial given the stock's high volatility and premium valuation.
Full Coverage on my Newsletter this Week
Keep in the Watchlist and DOYR.
NO RECO. For Buy/Sell.
📌Thank you for exploring my idea! I hope you found it valuable.
🙏FOLLOW for more
👍BOOST if you found it useful.
✍️COMMENT below with your views.
Meanwhile, check out my other stock ideas on the right side until this trade is activated. I would love your feedback.
As per the Latest SEBI Mandate, this isn't a Trading/Investment RECOMMENDATION nor for Educational Purposes; it is just for Informational purposes only. The chart data used is 3 Months old, as Showing Live Chart Data is not allowed according to the New SEBI Mandate.
Disclaimer: "I am not a SEBI REGISTERED RESEARCH ANALYST AND INVESTMENT ADVISER."
This analysis is intended solely for informational purposes and should not be interpreted as financial advice. It is advisable to consult a qualified financial advisor or conduct thorough research before making investment decisions.  Long
Long
 Long
Long
 Long
Long