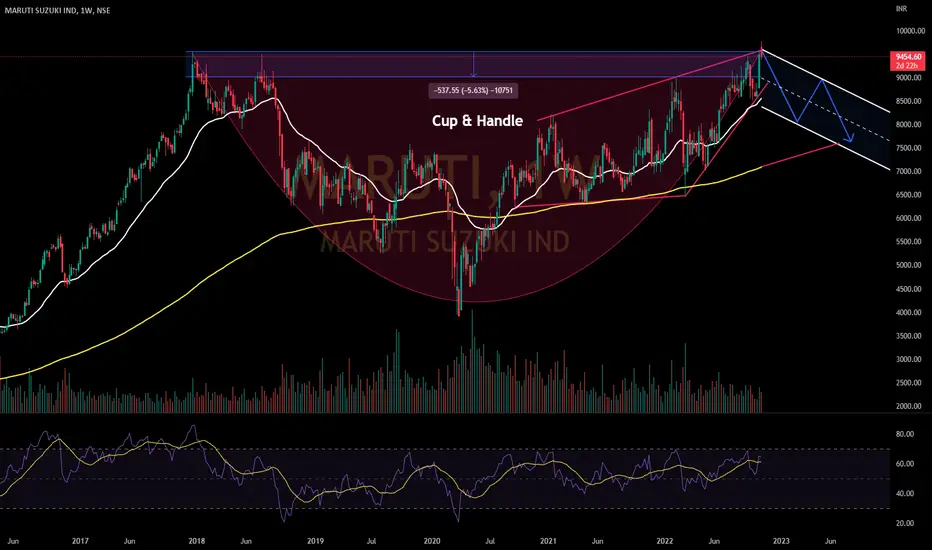
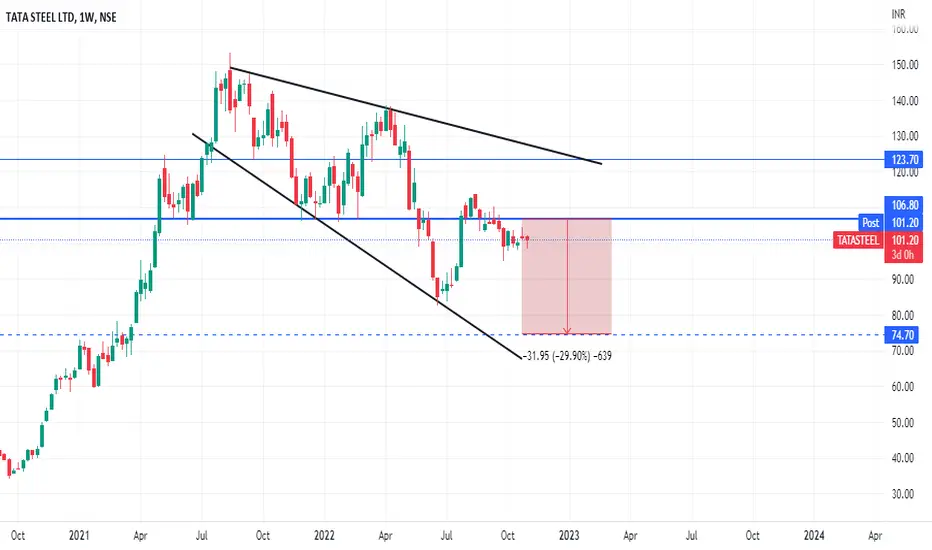
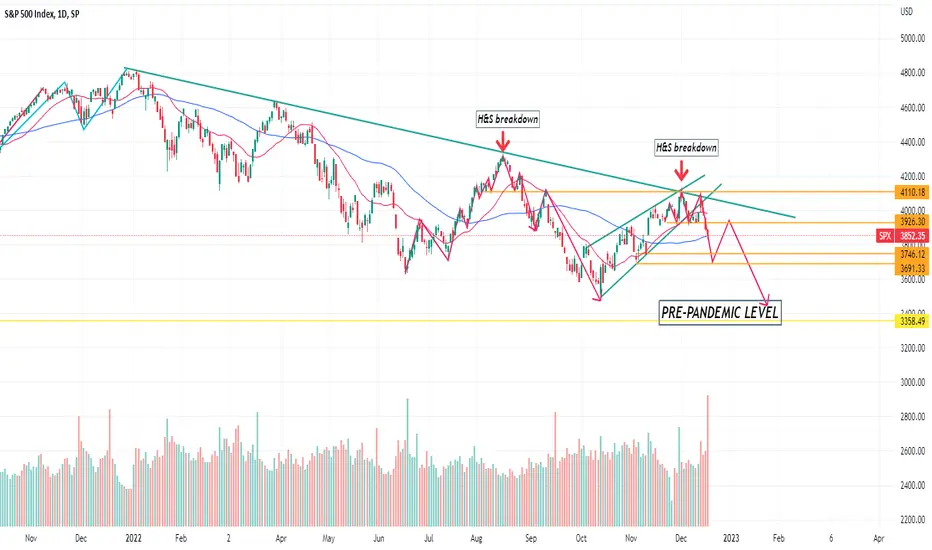
TATA motors - BREAKDOWNThe descending channel pattern is a bearish chart formation. It develops within pronounced downtrends in asset pricing.
traders view descending channels as evidence of weakened strength in the counter currency. Accordingly, it is frequently used to sell a currency pair and join the prevailing market downtrend.
First, let’s study the case of the descending triangle reversal. Typically, the descending triangle is more powerful when traded in the context of a trend. It’s also more powerful when
Bearish Patterns
BITCOIN LEVELS FOR SHORTING AND ACCUMULATING Here is my view on BITCOIN for the upcoming year. I expect a short bearish move towards 12000-14000 range. One could possibly accumulate BITCOIN in the discounted range of 12K-14K and expect a minimum return of 400% when BITCOIN reaches its all time high of 70K.
HEAD AND SHOULDER BREAKOUT (AWL)Head And Shoulder Breakout
CMP: 435
Targets for Downside: 591 and 551
SL: 671 Above Previous Swing High
AWL Broke this years major support retested the support area and now heading to downside.
Disclaimer: This is for educational purposes only, not any recommendations to buy or sell.
WIPRO ShortWipro is continuously in downfall and holding the support of level 385.
Now, it created a pattern of " head and shoulder " we may see a good fall if it closes below the bottom of the previous low of the pattern.
The share faced rejection of 50DMA and closed below it again.
Fib Retracement - Putting the Fib from the Corona time low we came to know the level of 0.618 is at 383 and that's where Wipro had taken supports if that breaks we can shorts position.
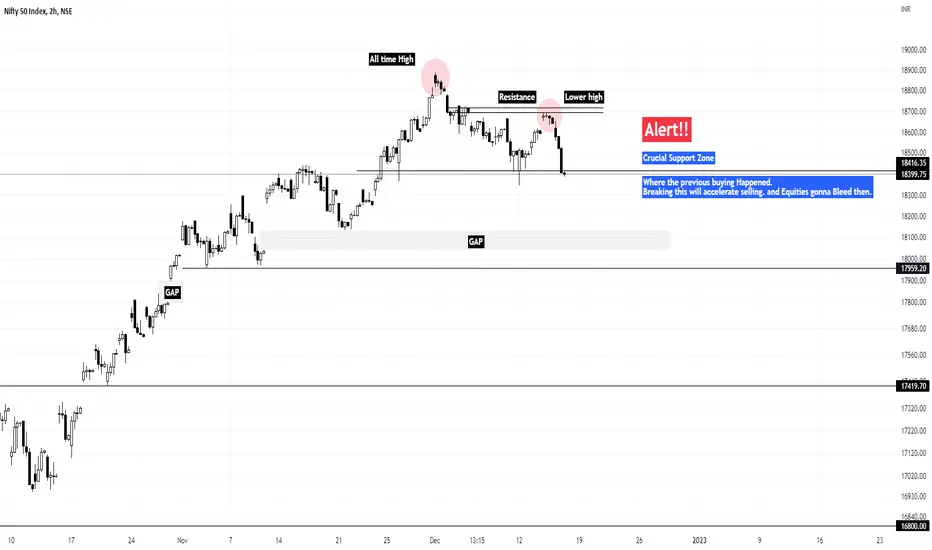
Why you should be careful now!! (Nifty trend Analysis)Hey Everyone this is just to inform you
This is time to be careful. The index is at its Crucial support level. Below this, the bear will hold the command.
The closing for today was extremely, very awful.
Swing trades will not do well.
Even the trades that I've shared too.
So be cautious guys.
You guys can ask questions in the Comments, and I'll keep you guys updated.
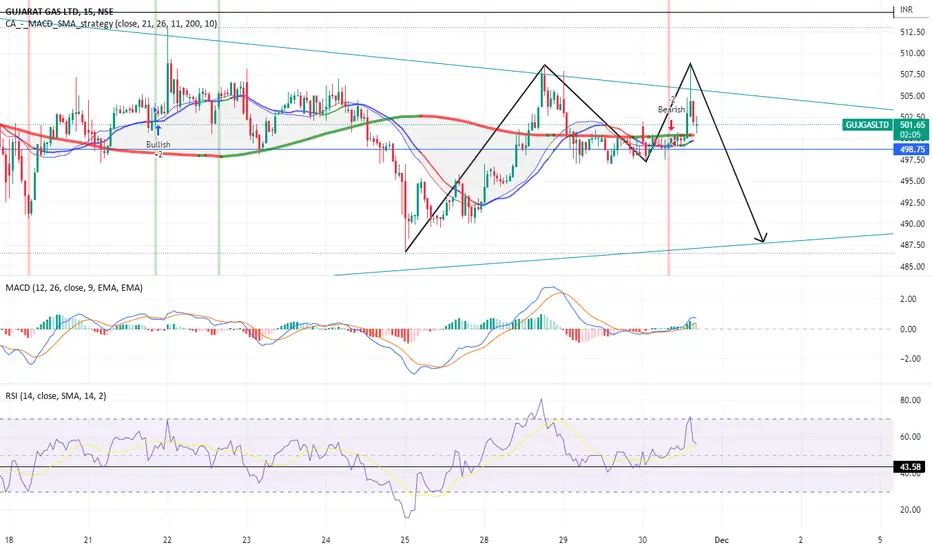
Bearish M pattern for short term / intraday Making bearish M pattern in short term with small bullish pattern.
Entry : 500 - 497
Exit : 490
SL : pre-heigh
GShort
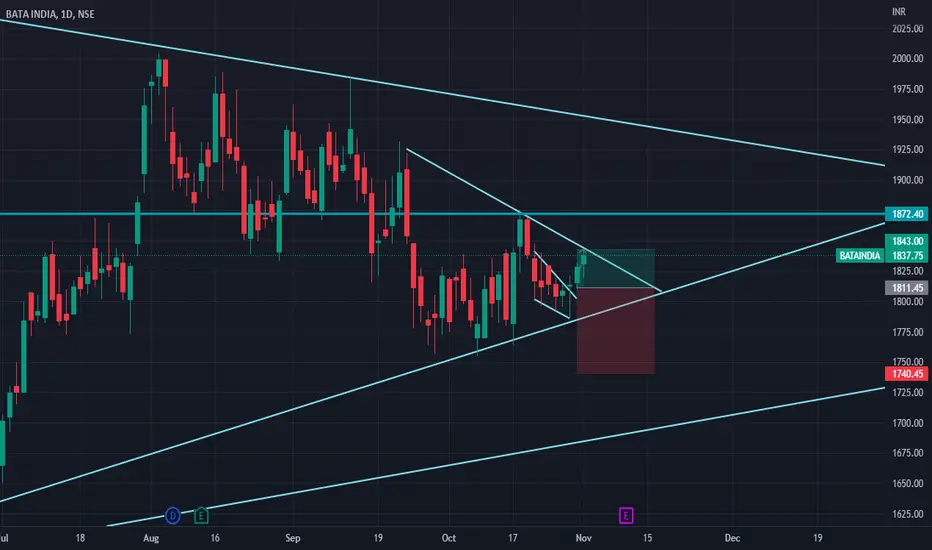
Bitcoin Short-Bearish Pennant BreakoutBitcoin is making a pennant pattern which is about to breakout. It's a bearish pennant ,formed in 4h time frame.A bearish pennant usually breaks out downward but during the mixed emotions of the market and its' volatility can be cause of uptrend too.Also the market is on downtrend for a long time so a up move can be expected too.
But the major signs is in favour of bear market so keep an eye guys.wait for the move.The targets of upward is 18916 and 20997.and the downward target is 15640 and jum
ETH LTF Play for (Shorts)HTF Trend is Bearish . Therefore, I am only looking for shorting options. There is Liquidity just above the Key-Level (Purple Zone) and a possible Order Block on HTF. That will be my POI (Point of Interest).
If the price reacts and rejects from that level, i will open shorts around $1330. Let's see.
Nifty50 - Overall Still Bearish - Sell On Rise CandidateNSE:NIFTY is still a sell on rise candidate on DTF & WTF basis. Overall view still bearish as the index is still trading below 20/50/100 EMA
Any upside will be just a pullback retracement rally,. Potential bearish pole and flag patten in the making and such pattens do attract 38.2%, 50% and 61.8% levels which are depicted using Fibo levels. A 72.8% retracement is a possible stretch and remote possibility
T1 - 15989
T2 - 16180
T3 - 16450
Downside open to 15110 levels again
Interestingly
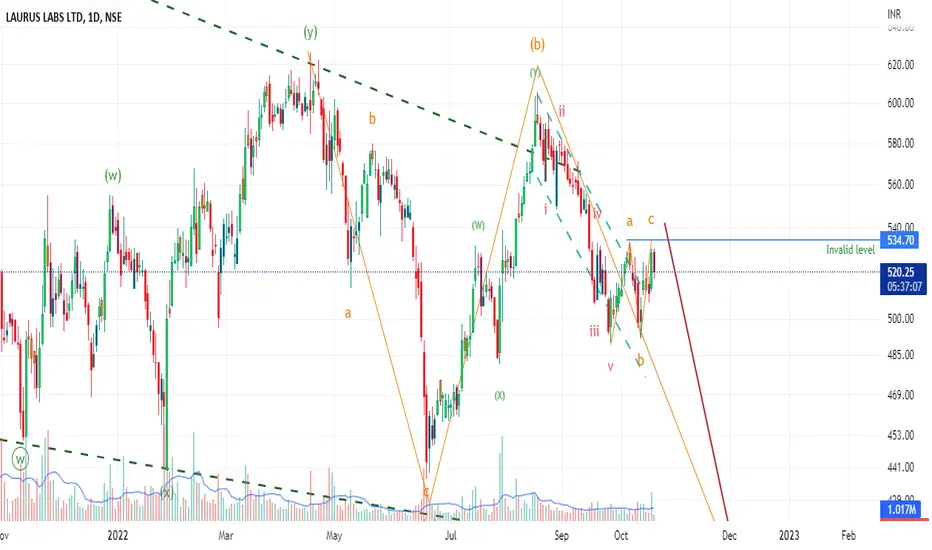
SOLARINDS Inverted Hammer is form near resistance area. Inverted Hammer is form near resistance in SOLARINDS. if on daily timeframe red candle is form in next trading session then this stock will be more bearish in upcoming days. if it will break the resistance zone and sustain above then only thinking for buying this stock for swing trading. as of now looking bearing.
Bitcoin short-Double top breakoutBitcoin is forming a double top pattern in 1h time frame.The pattern is already retested two levels.If the wave breaks the support 1,a short trade can be initiated with the risk to reward ratio of 1:3 as seen on the image.It can take retest the level of support 2 and support 3 as well,so be patient.Also,US fed reports are coming so market can be volatile.