MANKIND PHARMA, Fresh breakdown with a strong momentum.After the break of structure the price has successfully retested the upper levels now we have a fresh breakdown with a strong momentum. The price could test the lower levels of 2,056 and on my probability scale it is more than 55%.
Disclaimer: This is my pre market analysis and my trading journal. Not a suggestion to buy or sell.
Bearish Patterns
ITC Technical Outlook, Support Broken with a strong momentumToday an important support of 423 has been broken with a strong momentum having RSI below 40. The price could test the next support level of 414 and if broken then we go for 400.
Disclaimer: This is my pre market analysis and my trading journal. Not a suggestion to buy or sell.
NOTCOIN Ready for 40% downside moveGETTEX:NOT Market Alert
Price is currently rising while CVD (Cumulative Volume Delta) and open interest are declining—a potential signal for a downside move.
Key Levels:
Primary Downside Target: $0.0165
Secondary Downside Target: $0.0125
Critical Support: $0.015
Invalidation: Sustained price above $0.025 could negate this bearish outlook, indicating higher targets.
Trade cautiously and stay updated!
NIFTY 50 Hits All-Time High - Is It Time to Book Profits?The NIFTY 50 index recently reached a record high of 23,100, marking a significant milestone. However, this peak is accompanied by concerning signals that suggest a potential downturn. Despite the achievement, the index is displaying weak momentum, evidenced by a bearish divergence in the Relative Strength Index (RSI) and the formation of bearish candle patterns over the past two days.
These indicators raise the question: Is it time to book profits and wait for more favorable entry points?
Mor
TITAN - Triple Top Chart PatternTitan has formed a bearish chart pattern called Triple Top.
Triple top is a bearish chart pattern which is formed in an uptrend where three tops are lying on a flat horizontal resistance line and pattern will activate only when closing below the neckline or support. Pattern will activate only below the closing 3475 marks.
Triple top pattern is one the rarest chart pattern with high accuracy.
Thank You
Arvind Share Academy
#Bitcoin Elliott Wave Count Analysis ( Ready for $44000 ?)#Bitcoin Elliott Wave Count Analysis
Intermediate Degree:
▪️We are observing a potential wave (3) down of a descending impulse on the 1-day chart.
▪️Target: $48,000 - $44,000.
Primary Degree:
▪️The 1-day chart suggests wave C down of a zigzag pattern is in progress.
▪️Target: $58,000 - $61,000.
Cycle Degree:
▪️At the cycle degree, wave ((ii)) down of an ascending diagonal appears to be forming.
▪️Target: $52,000 - $58,000.
Disclaimer: This analysis is based on current market conditions and
Alert: AEVO Down -80% from Its All-Time High, What Next ?AEVO Down -80% from Its All-Time High
AEVO, listed on Binance on March 13, 2024, experienced a significant price movement shortly after its listing. Within 15 days, AEVO hit an All-Time High (ATH) of $3.94 from its listing price of approximately $2.80.
Current Status:
Current Price: $0.76
Down -80% from ATH
Technical Analysis Highlights:
- The chart indicated a clear exit point at the breakdown of the $2.93 support level.
- An alert was triggered when a bearish flag formed last month, followe
Bitcoin Urgent Chart UpdateCRYPTOCAP:BTC Urgent Chart Update
- #Bitcoin Rejected from HH/TL.
- We Already Profit in BTC/USDT Short Positions
- $57000 Possible Scenario
Key Levels to Watch:
$64,000: Critical! Above this, a path to $100k opens.
$65,540: Ideal stop loss for short positions.
$57,000: Breaking $57k Mean #BTC could drop to $50k
Stay alert and manage your positions carefully!
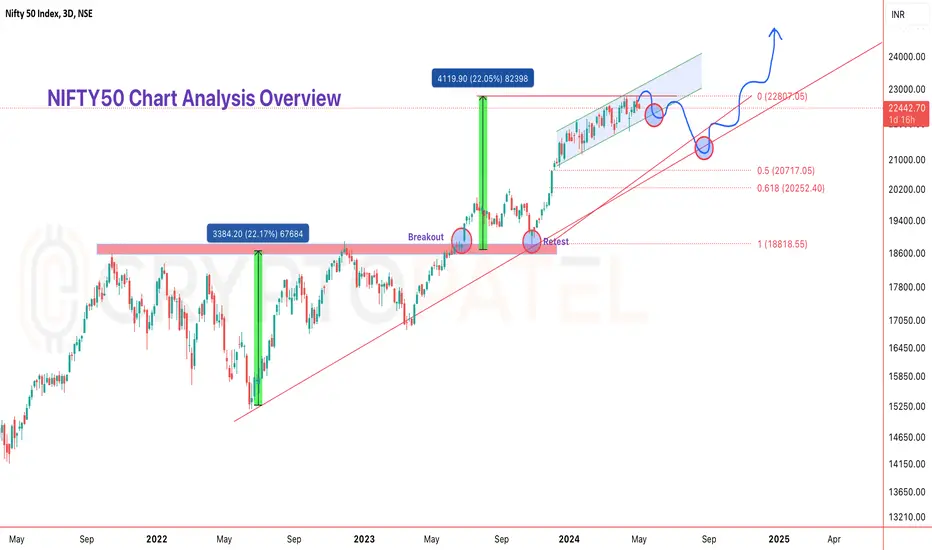
NIFTY50 Ready to Big Dump toward 20250 Levels ?NIFTY50 Technical Chart Analysis
NIFTY50 is currently in a high greed zone, attracting investors eager to join the bull rally. Let’s examine the key scenarios expected to play out over the next few days:
Chart Analysis:
NIFTY50 is forming a bull flag within a rising channel. Historically, this pattern tends to lead to a downside breakout, which makes any upside breakout highly risky.
My outlook is bearish. The last breakout resulted in a 22% gain, but if NIFTY50 breaks down below 22,110, we
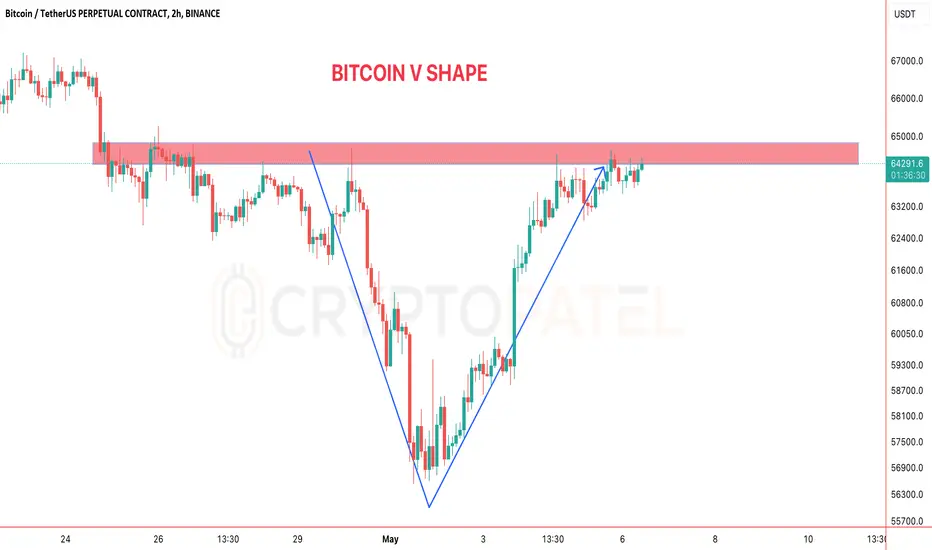
Why "V" Shape Happened Last week in #Bitcoin ?Why "V" Shape Happened Last week in #Bitcoin ?
High Risk-to-Reward Reversal Trades
- Whales in Action: Big traders can manipulate the market to fill long positions. By driving prices down, they trigger stops/liquidations, then enter positions at favorable liquidity levels. Once the liquidity is absorbed, prices reverse upwards.
- Liquidation Levels: Massive pressure on one side of the order book can lead to price reversals after liquidation levels are hit.
- All Liquidation Levels Hit: If all
POPCAT/USDT Forming Bull Flag: Expecting Target $2Popcat ($POPCAT) Soars to New High: $0.576625
Popcat, the first cat-themed coin to hit a billion-dollar market cap, has reached a new all-time high of $0.576625
Thanks to its unique positioning and strong community backing, #POPCAT has seen rapid growth, and many believe it could soon hit $1.
While the market is volatile, the Popcat community is buzzing with excitement and optimism!
Chart Analysis:
According to the chart, POPCAT has formed a bullish flag and completed a breakout, suggest
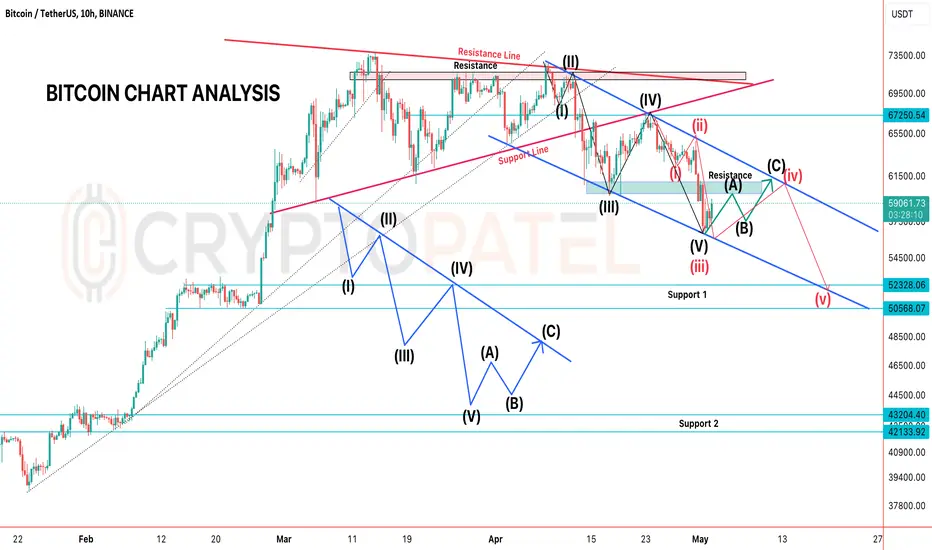
Bitcoin Technical Analysis - Bearish Scenario & Elliott Wave Bitcoin Technical Analysis - Bearish Scenario & Elliott Wave Count
Greetings traders and investors,
Current Analysis:
The current BTC scenario appears bearish. As discussed earlier, I highlighted the likelihood of a significant dump. I hope you adhered to the warning and avoided long trades around $70,000 - $72,000.
Chart Analysis Recap:
The chart shows a clear bullish pennant formation, usually indicating a bullish trend. However, based on my experience, the market often moves contrary to ex
Ready for Altcoins Season? Bitcoin Dominance Analysis Ready for Altcoins Season? Bitcoin Dominance Analysis
Critical Level: #Bitcoin Dominance hovers around the pivotal 55% mark, with potential outcomes hinging on breakout or rejection from 55%-57% resistance.
Altcoin Scenario: Breakout could trigger an altcoin bloodbath, while failure could signal a significant altcoin season, potentially leading to new all-time highs.
Observation: #BTC Dominance exhibits a pattern akin to the Bitcoin 2021 top.
Confirmation Needed: Await an impulse downward t
NIFTY 2 MAY Expiry AnalysisThe market (NIFTY50) is currently trading at 22740. From Friday We have seen a sharp Buying.
Now, I can see 2 images.
Bullish Momentum: Will give you a good amount of return if it breaks 22760 level then target 22850+
Bearish Momentum: Will give you a good amount of return if it breaks 22720 level then target is 22600.
Imp. Note: This analysis is provided for informational purposes only and does not constitute a direct recommendation to buy or sell stocks. Investors should conduct their own
Tata Steel - Correction?Tata Steel :-
- Monthly RSI showing signs of Divergence
- The same could be observed on Weekly RSI as well
- On daily the candle formed on 26.04.24 seems to be bearish in nature with high volumes forming a double top around the levels 165/170.
The Fib retracement could be seen plotted at 154-150, 0.5/0.618 respectively.
A short can be initiated from the levels 165/168 for a target of 6-8%
Buy opportunity can be seen at levels 152/154 post confirmation.
NIFTY MONTHLY BAT PATTERN OR HALF M PATTERN (Condition apply)* The market (NIFTY50) is currently trading at 22436. However, it's important not to blindly follow the buy or call side under the yellow box, as it signifies a sideways zone. For the past two days, I've observed a sideways market with premiums not showing significant increases.
Here are the levels and analysis for the NIFTY Monthly Future Traders:
Once the 22400-440 Level breaks then the Market will go towards the 21900 Level again.
If it sustains 22000 then also no big issue.
Note: Selling s
NIFTY 18TH APRIL Monday AnalysisHello Traders,
The market (NIFTY50) is currently trading at 22519. Friday We have seen a sharp selling (Please check my analysis 18th April Nifty Expiry, I explained about market and got the 200+ points target as well).
Now, I can see 2 images.
Bullish Momentum: Will give you a good amount of return if it break 22570 level then target 22800+
Bearish Momentum: Will give you a good amount of return if it breaks 22450 level then target is 22200.
Also, Don't forget to see my Previous analysis:
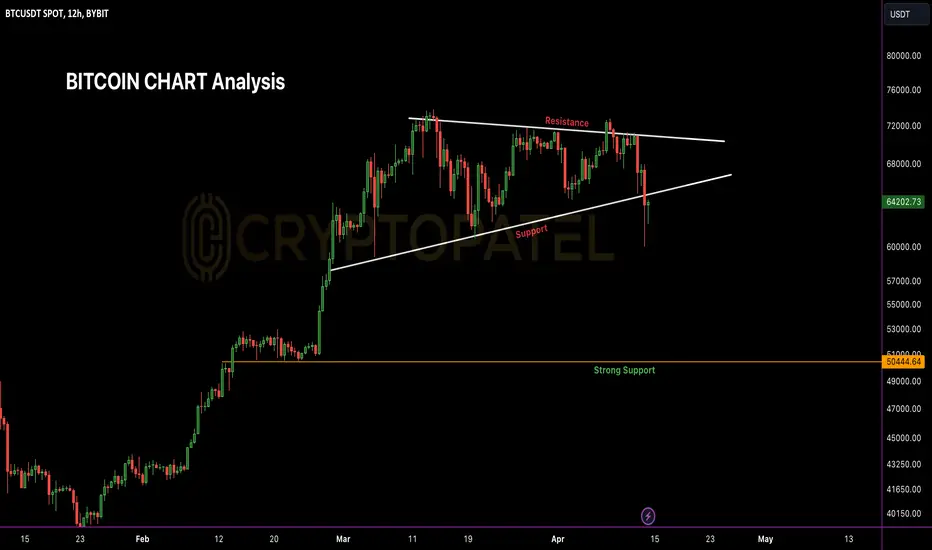
BITCOIN BEARISH MODE SO READY FOR $50,000 ?#BITCOIN BEARISH ALERT
Market Status: Bearish
Key Observations:
Pattern Breakdown: Bullish Pennant formation has been compromised.
Trend Line Status: Currently trading below the key trend line.
Targets: $50,000
Condition:
This target is set under the condition that #BTCUSDT remains below $65,500.
Keep a close eye on the price movement. A sustained position below $65,500 could confirm the bearish momentum towards our target.
Stay tuned for further updates!
CRYPTOCAP:BTC #Cryptocrash