Bearish Bat
Banknifty short entryBanknifty has forming BAT pattern on Daily
Levels to short is 41250-41280
T1 40650 T2 40250
SL 41750 above DCB
BShort
Bollinger and Wilder Charts Suggesting BottomThe Bollinger chart is on the left and the Wilder chart is on the right. The Bollinger chart shows bullish divergence between price and %B which is confirmed by AD%. See the yellow bars. AD% is a normalized accumulation/distribution indicator. Price has also created a double bottom and closed above the 20-day moving average, triggering a long entry.
The Wilder chart shows bullish RSI divergence with a failure swing (higher low and higher high), as indicated by the yellow bars. ADX is threa
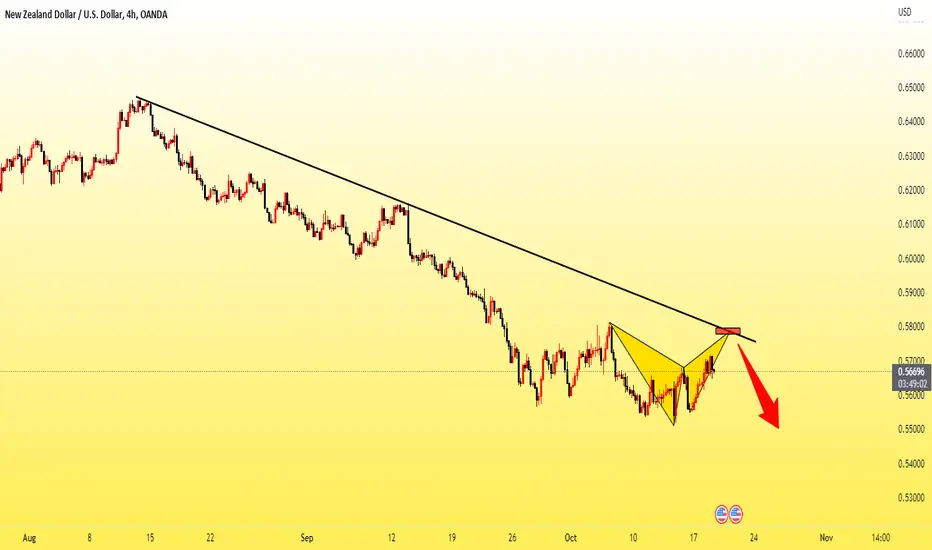
NZDUSD H4 BAT PATTERNHi traders, NZDUSD is setting up for a downside move i am expecting from price to come around our mentioned bat pattern completion and also a third touch of trendline area, watch price action on the top and look for a short position opportunity if price drop from the current area and break 0.55126 level without hiting our mentioned entry level then this setup will be invalidate.
If you are taking this trade so please i request you trade with your acourding strategy do not depend on my analysis,
AUDCHF H1Hi traders, AUDCHF is setting up for a downside move watch price to complete our pattern and look price action on the top for a short position opportunity if price drop from the current area and break 0.62298 level without hiting our mentioned entry level then this setup will be invalidate.
If you are taking this trade so please i request you trade with your acourding strategy do not depend on my analysis, this analysis is just a scenario and i would love to be wrong GOOD LUCK.
NZDJPY - Bearish Bat RetestLast week's video analysis I did talk about this Bearish Bat Pattern. If you have engage this trade, congratulation, you have gain close to 100pips of profits.
Don't worry if you have not engage on this Bat Pattern, you can wait for a retest at 83.50. A retest Bat Pattern is also known as Type2 Pattern. Usually, the movement of such setup is more gentle than the type1 setup. Patience is required.
What I like about this setup, it gives me an opportunity to hop on the Daily Chart's potential bea
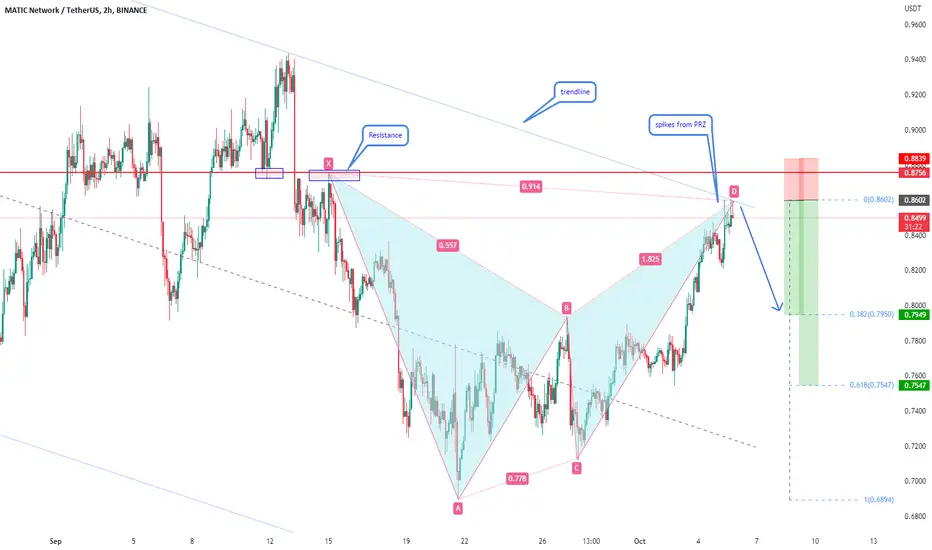
MATICUSDT - 2H - Bearish batPattern is already complete and showing rejection from PRZ.
We have also a trendline and a previous structure as resistance.
If this idea is useful please like and follow.
Best Regards.
MShort
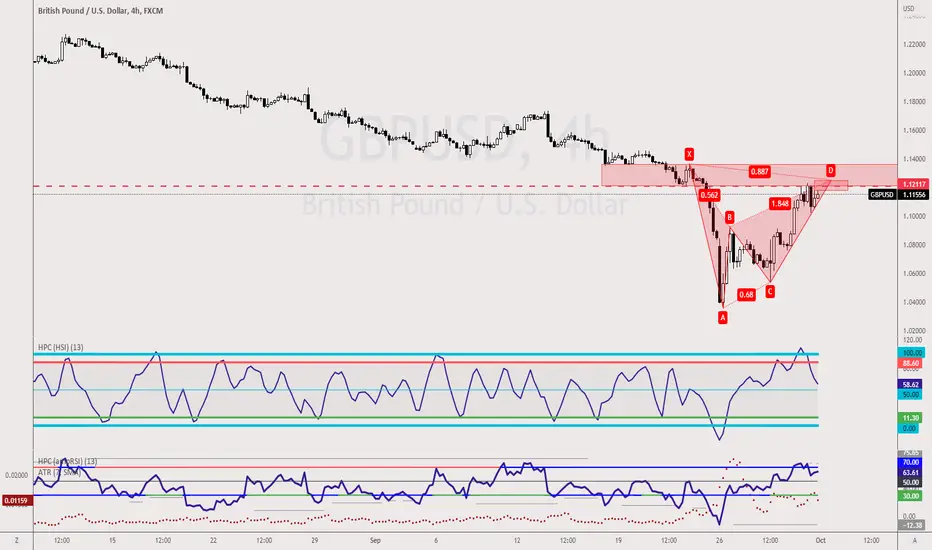
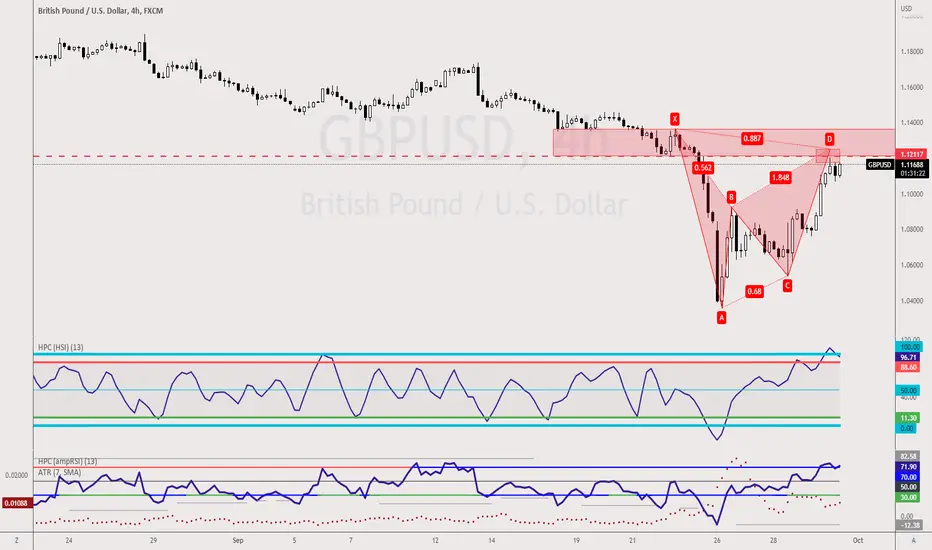
GBPUSD-Weekly Market Analysis-Oct22,Wk1Last Friday, I shared this analysis in Tradingview; the comment I received is lovely yet scary. The reader felt that the Bat Pattern had completed and seemed like he had engaged in the trade. Oh nooo!!
First of all, no matter who the analyst was, never follow their trading ideas blindly. Secondly, for the Bearish Bat Pattern to be valid, the market has to touch the furthest end of the PRZ; in this example, it's at 1.1251 and touches the opposite end of the PRZ for it to be valid.
Engaged in a
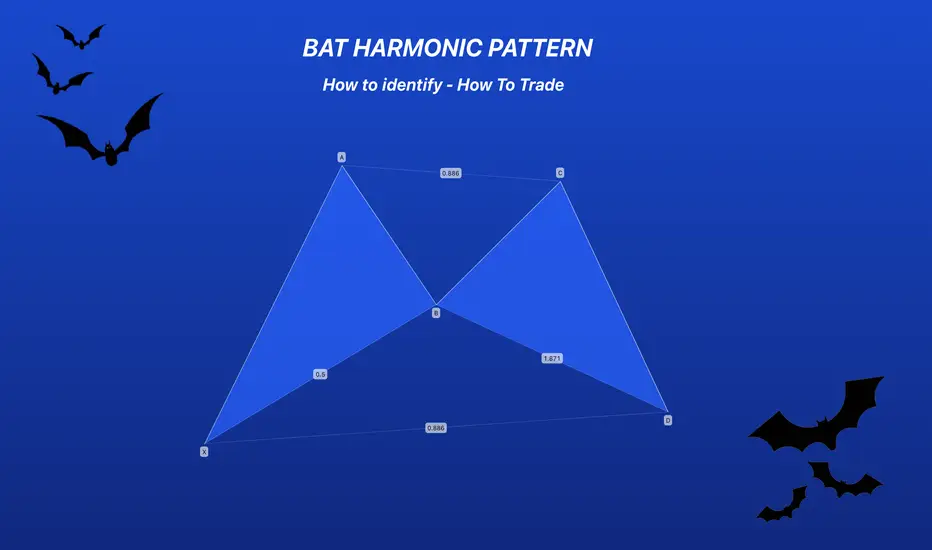
Bat Harmonic Pattern - Made Easy For EveryoneThe BAT pattern gets its name from the bat-shaped end product. Identified by Scott Carney in 2001, the BAT pattern is made up of precise elements that identify PRZs.
The bat harmonic pattern follows different Fibonacci ratios. One of the major ways to differentiate it from a Cypher pattern is the B point which, if it doesn’t go above the 50 percent Fibonacci retracement of the XA leg then it is a bat, otherwise it can turn into a cypher structure.
The market strategy of the pattern is suitable
GBPUSD - Bearish BatA Bearish Bat setup within the sell zone work well for trend traders. Consolidation before completion could be a warning sign for the Bat Pattern trader; hence traders must wait for confirmation in the PRZ zone and not to rush into this Harmonic Pattern without waiting for further confirmation.
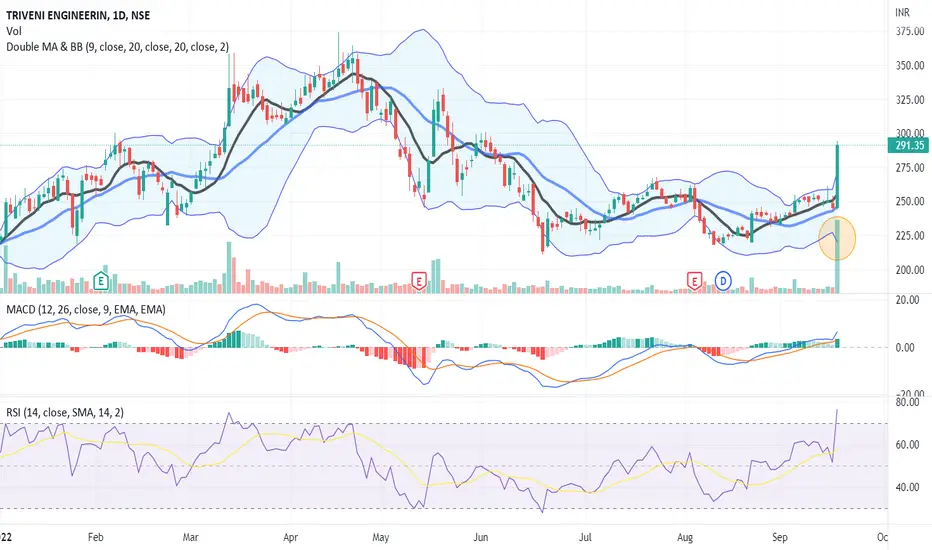
Triveni Engineering & Industries LTD - Multiple Indicators📊 Script: TRIVENI (TRIVENI ENGINEERING & INDUSTRIES LIMITED)
📊 Nifty50 Stock: NO
📊 Sectoral Index: NIFTY500nif
📊 Sector: Fast Moving Consumer Goods
📊 Industry: Sugar / Agricultural Food & other Products
DAILY TIMEFRAME W PATTERN BREAKOUT
WEEKLY TIMEFRAME MACD CROSSOVER AND DOUBLE MOVING AVERAGE CROSSOVER SOON
Key highlights: 💡⚡
This stock pick is according to my study. I have use few indicator that is
BOLLINGER BAND
MACD
RSI
DOUBLE MOVING AVERAGE
VOLUME
📈 Script is trading at
Bearish Divergence on S&P Volatility at PCZ of Bearish BatThis Bearish Bat would have me believe that the VIX Bullish Butterfly Rally will come to an end and go back down to atleast the area of $28.50 but i wouldn't be surprised if it went into the lower $20s if this played out.
For more context this was formerly a Bullish trade Setup but now it's reached the target and we are looking for a retrace downward again.
Check the relatted idea below for further context of the previous trade.
USDCAD - Bearish Bat comboThe Potential Bearish Bat setup on the 1hourly allows the "latecomer" to engage the trade and die-hard traders who got involved on the Bearish Deep Gartley Pattern a chance to increase their position without increasing their risk.
That said, candlestick pattern confirmation is essential before entering the trade, even though the Bat Pattern is formed within the sell zone.
Beat the BATS - Harmonic Bat PatternsHi Traders, Investors and Speculators 📉📈
Ev here. Been trading crypto since 2017 and later got into stocks. I have 3 board exams on financial markets and studied economics from a top tier university for a year. Daytime job - Math Teacher. 👩🏫
In today's analysis, we'll look at a different way to speculate the next immediate price action of an asset : the Harmonic Bat Patterns. There is a really cool tool on the platform that you can use called the Cypher Pattern, you can find this in your d
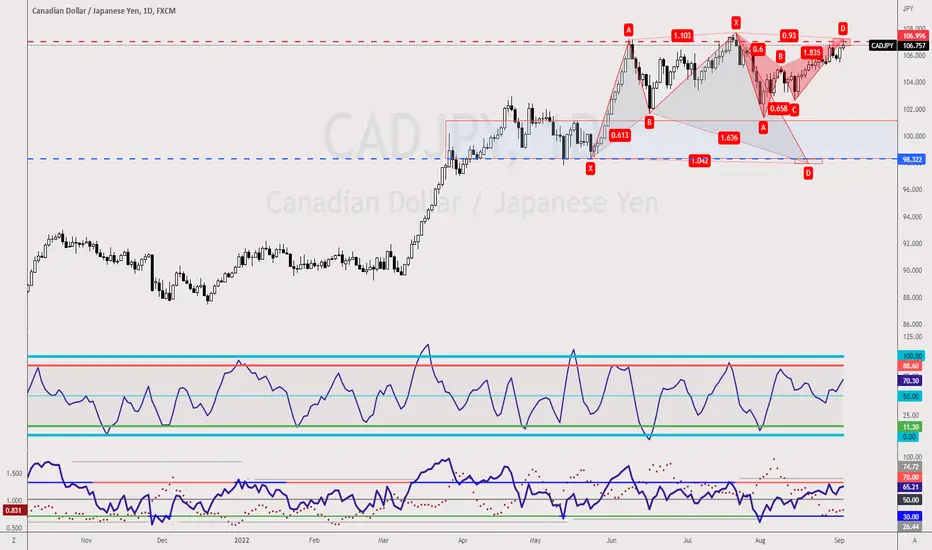
CADJPY - Bearish BatCounter-trend traders, this is another trading opportunity, a Bearish Bat Pattern completes on the daily chart.
It will be a busy Monday for traders. Share this with your friends, so they won't sleep through Monday and missing lots of trading opportunity.
What I love about this setup, there are RSI Divergence on the lower timeframe.
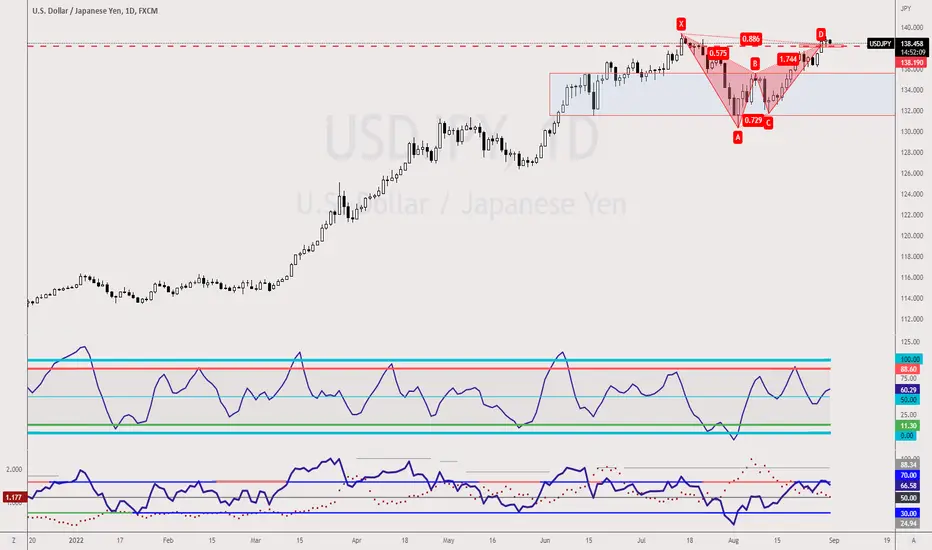
USDJPY - Bearish BatAfter weeks of waiting, the Bearish Bat Pattern on the USDJPY has finally been completed. Counter-trend traders, this could be your chance to engage.
However, there are 2 warning signs I must point out.
The completion of Point D exceeded the little red box known as the PRZ. A more conservative way is to wait for the 3-bar reversal to happen.
Lastly, tonight(depending on which city you are in), there is a US ADP report, and this Friday is Non-Farm Payroll week.
EURJPY - Type2 Bearish BatEURJPY has a Bearish Bat setup. If you are waiting for a buying opportunity, you might just have the opportunity to long at around 136.87. This is possible because it is a legit support level.
If you are waiting for a shorting opportunity, 137.56 is an excellent level to consider to engage the trade based on a Type2 Bearish Bat Pattern setup.
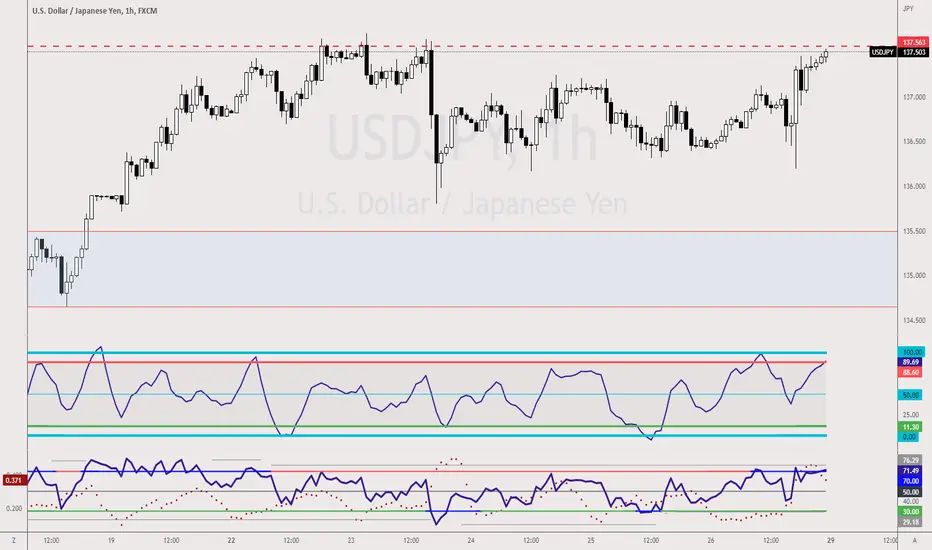
USDJPY - Resistance LevelIf you read my last week's analysis, you should know that there is a potential Bearish Bat Pattern on the daily chart(the link is within the tradingview article).
If you are looking for a counter-trend trading opportunity, the Bat Pattern might not be the best setup, and that's because I don't like what I'm seeing(consolidation before the Point D completion).
I'm more inclined to wait for a shorting opportunity at around 137.56, which happens to be the 1hourly chart resistance level. First of
EURUSD - Bearish BatTrend Traders, there are many opportunities for you to hop into the trade. I will be sharing 2 of the most obvious setup, the Bearish Bat Pattern that completes at 1.0155 and the Channel within the potential Bearish Flag formation.
It is important to wait for candlestick confirmation before engaging in the trade.