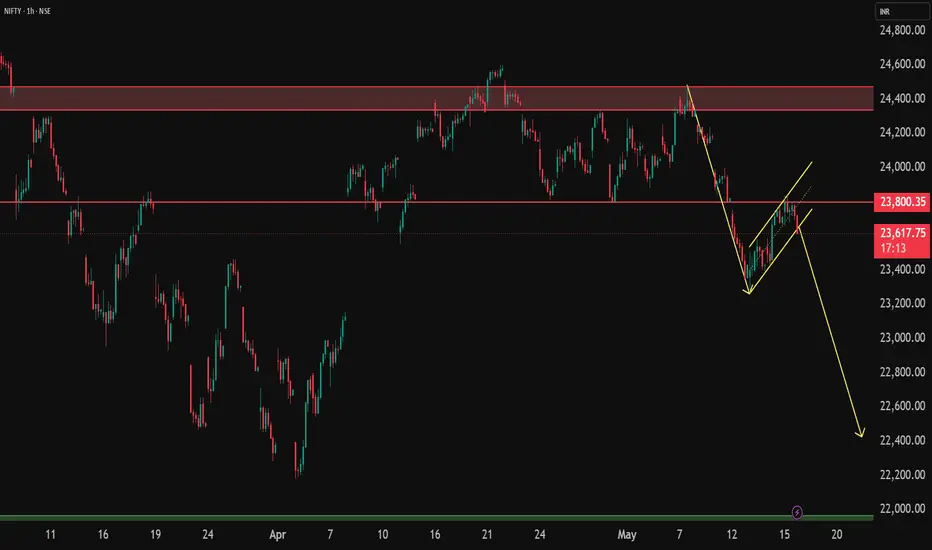
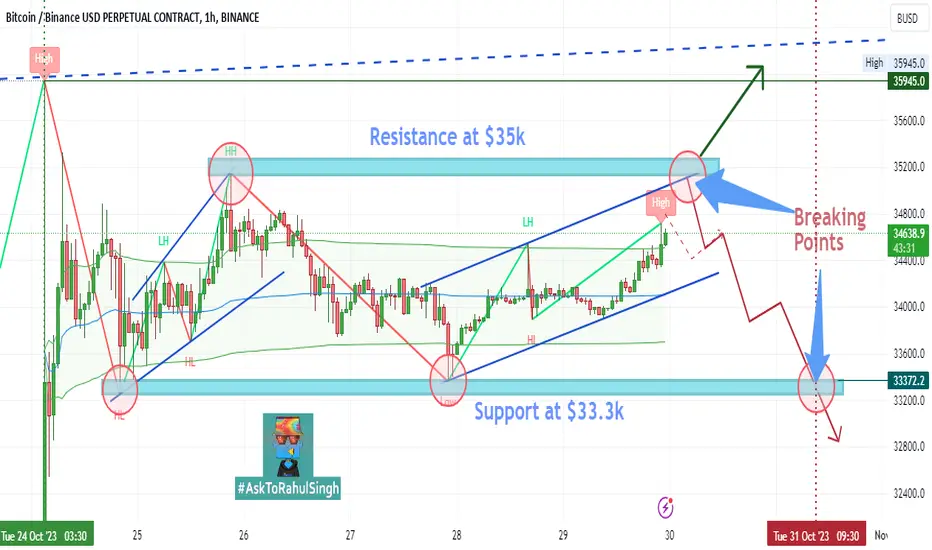
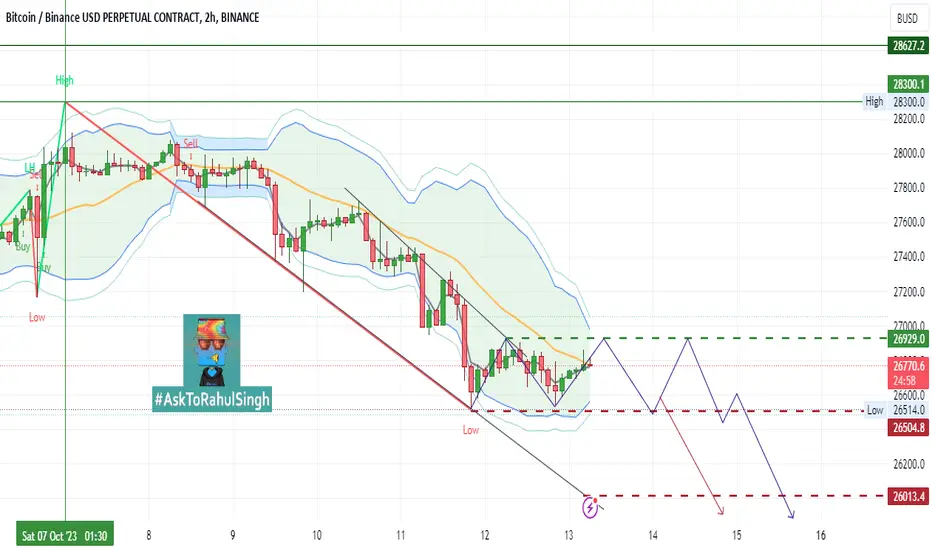
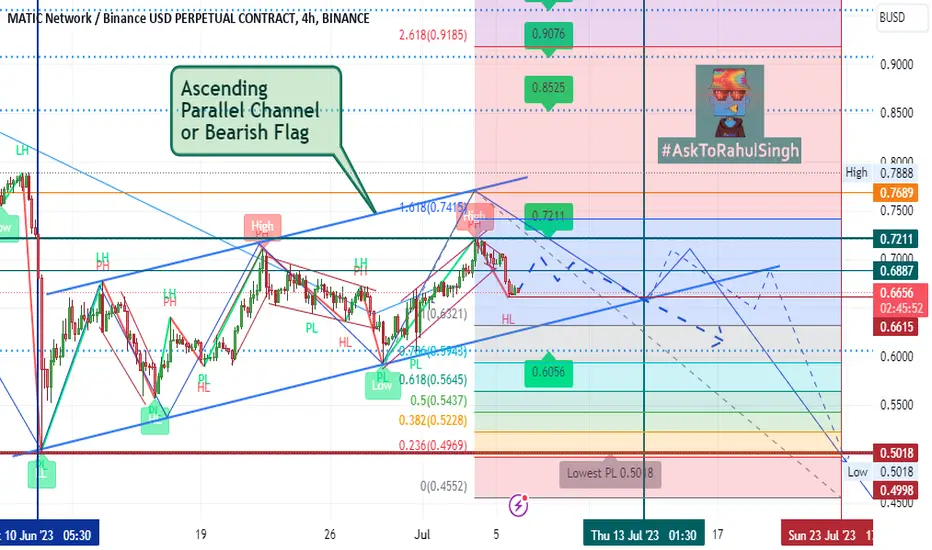
Bitcoin Ready For StromThe flag pattern is confirmed.
concern is flag is little bit longer than normal.
already trap on higher flag trendline.
Now,
Ready with your setup.
possibility:
1. active flag pattern (too much scary but possible)
2. take support from lower flag trendline (also can trap the seller and make up move)
please do your own research before talking any trade.
I am not financial advisor.
please feel free to ask any questions.
Bearish Flag
NIFTY INDEX – Technical Research ReportNifty Index is currently forming a Bearish Flag pattern , which is generally considered a bearish continuation setup after a sharp downside move.
Following a strong decline, the index entered a temporary upward consolidation channel, indicating a pause in momentum rather than a reversal. Price is now approaching the lower boundary of the flag structure.
A strong bearish candle closing below the flag support will act as confirmation of the pattern and may indicate continuation of the previous
Flag Found in NZDUSDI was eyeing on NZDUSD for Bullish entry above its major support @ 0.5613.
Then I caught a flag pattern which indicates continuation towards 0.5515. This is also confirmed by its near major support at 0.5514.
The price retraced two times from 0.5514 on 9th April 2025 and 3rd Februrary 2025. It enables me to have a proactive selling below the current Lower Low @ 0.5588 which is the pole of our flag.
Our Stop losses positioned at 0.5617, right above the flag clothing.
I am taking two trades
Against the Herd: My CAMS Big Short Moment at ₹4,000?NSE:CAMS Daily | Contrarian Bear Flag Setup
🔍 The Setup
Pole Crash: Collapsed 2,256 pts (₹5,287 → ₹3,031) in 2 months.
Flag Trap: Now stuck in ₹4,000–4,500 range (bulls in denial 😴).
Trigger: Daily close < ₹4,000 = breakdown confirmed!
Void If: Price climbs > ₹4,500 (run away 🏃♂️).
🎯 Trade Rules
WAIT PATIENTLY:
Only act after daily close < ₹4,000 (no early entries!).
SELL THE BOUNCES:
Short every pullback to ₹3,900–4,000 (zombie rallies).
PROFIT TARGETS:
Quick exit at ₹3,500 (bank 12%)
Natural Gas Technical Breakdown Ahead? Eyes on the 264.90 Mark#Commodity
#NaturalGas View:
CMP: 271.70
🔹 Resistance Levels:
• 270.70 – 273.40
• 275.00
• 284.00
🔹 Support Level:
• 264.90
Technical View:
Natural Gas seems to be forming a bearish flag pattern on the hourly & 4 hours chart. The price is currently facing resistance at the pink trendline breakdown level. While it's still early for confirmation, a decisive hourly close below 264.90 may validate the pattern and open the door for further downside. If the pattern plays out, a p
Technical Analysis Report: SMS Pharmaceuticals Ltd1. Bullish Flag with Pole (June–July 2024)
Bullish Flag with Pole: A continuation pattern formed after a strong upward price move (the pole), followed by a short-term consolidation (the flag), signaling the potential for another breakout upward.
Price Action: Strong impulsive rally formed the flagpole, followed by a tight consolidation forming the flag 🚩.
Breakout: Confirmed with a high-volume breakout to the upside.
Target: Achieved a massive 40% gain in under a month.
Analysis: A textbook
BEARISH FLAG IN BANK NIFTY - TIME FOR A SHORT TRADE ?Symbol - BANKNIFTY
CMP 51350
BankNifty has turned its trend from bullish to bearish & sideways making lows - lows on daily time frame & It was trading in a bearish channel. We can see a Bearish Flag pattern getting formed in BankNifty. Such patterns on larger time frame don't usually fail. BankNifty is currently trading near break down trendline of this pattern. Breakdown & sustaining below this trendline zone 51150 - 51000 will get this pattern activated & we can see big target towards downsi
Industower - Few things happening hereIndustower is currently exhibiting a bearish trend with several concerning signals: a fake breakout, a bearish flag breakdown, and the formation of lower highs. Traders should be cautious as these indicators suggest a potential continuation of the downtrend. The fake breakout implies that the recent upward move lacked genuine strength, while the bearish flag breakdown reinforces the bearish sentiment. Additionally, the pattern of lower highs signals weakening bullish momentum. However, if the st
Bearish Flag breakdown in ICICIBANKICICI BANK LTD
Key highlights: 💡⚡
✅On 1 HOUR Time Frame Stock Showing Breakdown of Bearish Flag Pattern .
✅Strong bearish Candlestick Form on this timeframe.
✅It can give movement up to the Breakdown target of 1055-.
✅Can Go short in this stock by placing a stop loss above 1134+.
BITCOIN movements upto Halving ZoneAs per Bitcoin 4-hr. chart Pattern,
its moving under Bullish Pattern with inner side bearish & bullish signals of $4k to $5k approx. bumpy rides under $71k to FWB:65K upto time frame of CRYPTOCAP:BTC #HalvingZone around 20-22 April 2024, afterwards Bitcoin goes towards a major correction cycle of 60-90 days as per daily cycle and then it will be make another Bullish Rides of this year upto $220k-$250k at per present scenario of bitcoin movements from mid of june.
Lets see, what's next patt
BITCOIN Last Time Breakout Divergence#BITCOIN 1hr. Chart Analysis
As per present scenario, after reached out $35.9k in last week, CRYPTOCAP:BTC lower support already one of the previous one is $33.3k that was never broke down in previous times to much easily as well not this time too, but its also never break-out $35.2k mark very easy soon and previously many times too.
So, its the exact scenario here again in October month end arrival soon, either it breaks their resistance of $35.2k this time, but if rejects from their then m
B
BITCOIN - After Pumping Still Bearish#BITCOIN Daily Chart Analysis
After Pumping of Weekly startup today's signal, CRYPTOCAP:BTC movement still under #BearishFlag pattern, it means with in next 25-35 days its next and final divergence will be towards $24k and from that point it will break down, there will be chances to breakdown of 18-20% means up-to $5k of value breaks as per my next forecast up-to 20-25th Nov 2023 and this will be our last #BearishZone downtrend cycle, after that Bitcoin starts to move in Uptrends towards #Bul
BShort
Bitcoin moving towards Breakout#BITCOIN 2-hr. Chart Analysis
As per present MIL:BTC movements, it will be stucked between $26.9k to $26.5k , if it will be moving into this scale up to 2-3 up-down cycles, then major chances to break-out $26k mark soon with in next 48 hrs.
MIL:BTC already moving under #Bearish Flag in daily chart analysis, that's i previously posted, so as per that scenario too, its next divergence towards FWB:25K first then it will break-out FWB:23K -22k...
Anyway, #DYOR and Trade wisely by using #St
BShort
BTC/USDT - Bearish Flag Pattern#Bitcooin 4hr. Chart Analysis
CRYPTOCAP:BTC moving into hourly chart under #BearishFlag Pattern, from last one month, since 18 August to 19 September, nearly to completing its final cycle of Uptrend into this Pattern.
Now, its Downtrend cycle will be start soon, towards $24k to $22k into #BearishZone up to in this week around 23 to 27 Sept.
You all must be ready for that, As well Trade wisely by using #StopLoss and #DYOR always before invest wisely into Crypto Currency, Its just #NFA
&
Must
Bearish flag pattern in BNA bearish flag pattern can be seen in BN
~ Seller me take control from here but still buyers are trying uphold the price
~ Buyers at 400 & 300 level are taking support if that breaks with momentum candle that a active sellers
~ Also trenline support can make bounce towards days high.
~ Wait n watch for a good oppourtunity to enter.
Note : Do your own analyisi before making any trading or investment
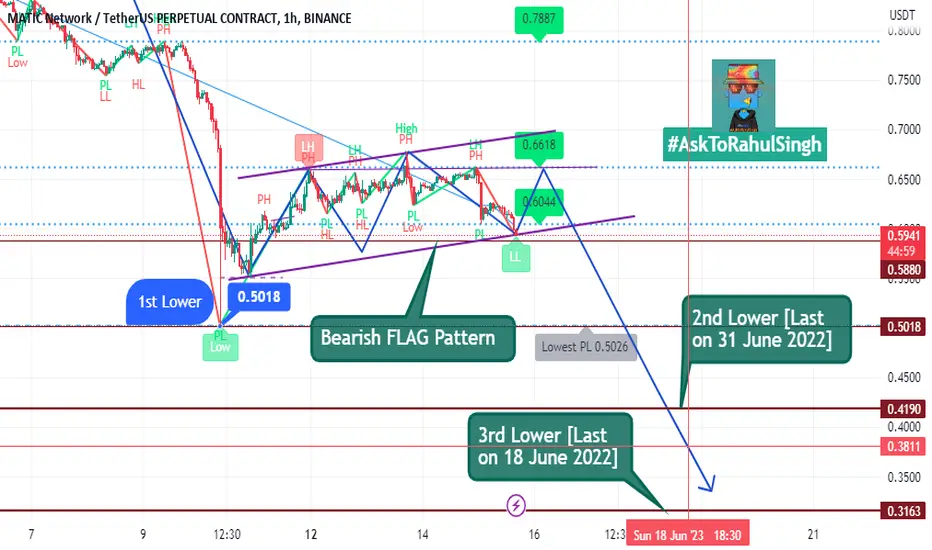
MATIC - Bearish Signals#MATIC 4hr. Chart Analysis
As per CRYPTOCAP:MATIC movements into Ascending Parallel Channel or into Bearish Flag Pattern, it starts from 10th June. after immidaite DUMP from 78 cent to 50 cent last time, it's well moving as per chart patterns and finally cycle close down at 22-25 july with more Bearish mode, may be last time with 45-50 cents again.
Yesterday, its breakout Ascending parallel channel from the target of 70 cent to 65 cents into Bearish Flag again into 1 hr. cycle and now may be
MShort
MATIC into Bullish Target in 24 hrsMATIC 15 min. Chart Analysis
MATIC performing very well at this time for traders, In previous cycle of Pump n Dump, it created best cycle of Bearish Flag pattern in short terms and Descending Broadening Wedge of Bullish cycle in Long term cycle and it will be soon break their 70 cent Uptrend target within 24 hrs. too.
Every thing displays in Chart, just follow it...
Always #DYOR and Trade by using #StopLoss
Must LIKE n SHARE
MLong
MATIC Chart UpdatesMATIC hourly chart running as per Bearish FLAG Pattern and soon it will be goes more Bearish in deep from last year Lower-Low 2nd Cut-off point at 41 cent and after that Lowest-Low 3rd Cutt-off point is 31 cent around, but as per me major chances it will be revert from last 35-38 cents.
always #DYOR
MShort
Bitcoin Towards Bearish Zone Soon#BITCOIN 2 hr. Technical Analysis
As per present trending chart from June starting, BTC previous cycle moved on Bullish Pattern as per Regression trend, while into present cycle it is moving on Bearish Pattern as per Regression Trend and soon will be major chances to break out strong support of $25.2k within 48hrs.
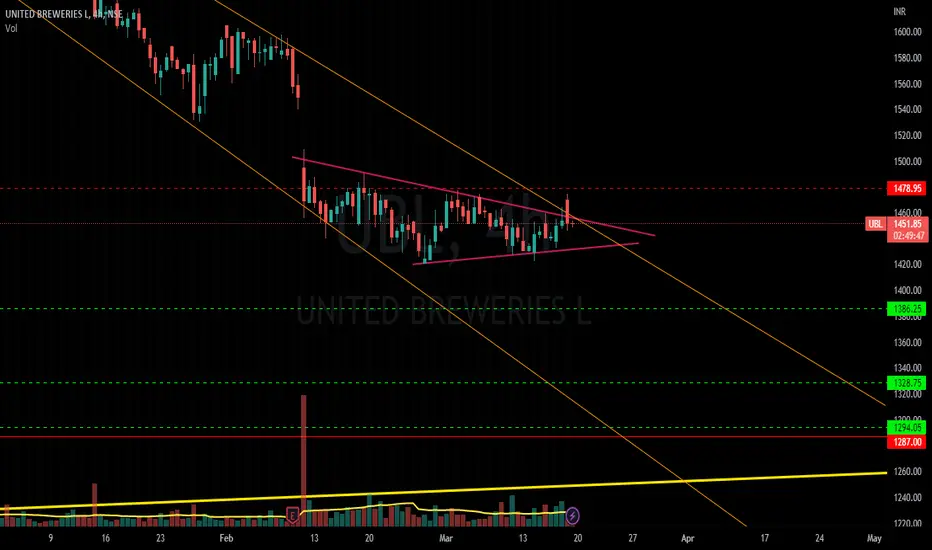
UBL Brewing down to its Major Support ??!!!Chart patterns look apt for a short trade in UBL
REASONS
1. In Monthly time frame, UBL has been trading inside an Ascending channel pattern taking support and resistance at perfect levels till now. (shown below)
2. Right now, it is under its down swing move inside the Ascending channel pattern
3. In Daily timeframe , Bearish Flag pole pattern developing and due for BREAKDOWN!!! (shown below)
4. In 4 hr time frame, it is looking good to enter the trade ( STRUGGLING TO MAKE HIGHE
PIDILITIND SERIES OF BEARISH FLAGS !!!!Chart patterns look apt for a short trade in Pidilite industries
REASONS
1. PIDILITIND from September 2022 has been in Downtrend forming lower highs and lower lows
2. Currently it is ,at its 3rd BEARISH FLAG pattern (gave breakdown with volume spike)
3. Previous 2 Bearish flags achieved their targets(as per pattern-pole length) without any sluggishness
4. There is DEMAND ZONE down near 2100 levels
5. SL as shown @ chart
6. Target - 2140, 2100(trail the SL)
7. Lower low formed on