Bearish Flag
XAUUSDXAUUSD is currently in a bearish trend.
Price is forming a bearish flag pattern, indicating a potential continuation of the uptrend.
The pair is being rejected from resistance at the 38% Fibonacci retracement level, adding confluence to the bearish bias.
what you guys think of this idea ?
X
Bearish Flag Pattern in Combo Coin Crypto"Analysis:
Chart Pattern: Combousdt Coin Crypto is currently displaying a Bearish Flag pattern, indicating potential downward movement.
Breakout Potential: The pattern suggests a likely continuation of the downward trend once the flag breaks.
Target Price: Estimate target prices based on the height of the flagpole.
Stop-Loss: Set a stop-loss slightly above the flag's upper boundary to manage risk.
CShort
MARA Double Top + Bear FlagTwo bearish patterns within a big structure could signal a big move to the downside.
- BTC itself doesn't look too strong as of this post and they are somewhat correlated by algos
- Twitter pumpers out in full force as well
Price Targets: 14.33 and 10.32 if things get really bad
NL25EUR Down - Will others follow?We've seen an extremely bullish year so far and the past few weeks have seen to be the last push of the current leg.
Seeing the amount of bearish RSI divergence taking place among many of the major indices I'm going to take a short position taking us down to the previous resistance, which is also the potential support of the cup & handle pattern visible.
Bullish confliuence on the btc falling wedge & bear flag targetsWe can see here if price action can break above the top trendline of the chartreuse bearflag by next week and then hold that trendline as solidified support, thereby confirming the bullish breakout, that the measured move of the break out would be identical to the measured move of the bullish breakout of the monthly pink falling wedge pattern. This is very encouraging bullish confluence. The wedge being on the monthly time frame is more powerful than the bearflag which is on the weekly timeframe
QQQ Bear Flag (Potential Correct Start)Classic trend reversal retracement
-Bear flag directly into one of the last imbalances (on 30m timeframe)
- Breakdown to 393 area very possible in the next month or two
- ~10% drop from current levels, would put QQQ squarely in correction territory
- Upside is that 393 area looks to be a very strong (and fresh) support
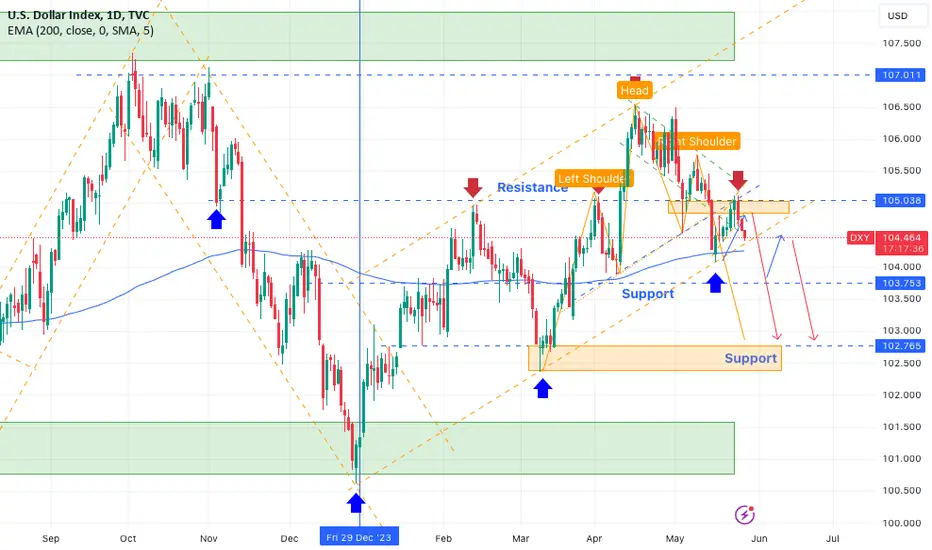
DXY (dollar index)The dollar index creates a bearish flag after the breakout of the 105.00 level. The market is ready to break the bearish flag because tomorrow is the federal interest rate and Powell's speech a big day. There is also a resistance level at 107.00. If the bearish flag breaks then the market moves toward resistance level.
GOLD Bearish Flag! Sell!
Hello,Traders!
GOLD is trading in a local
Downtrend and the price
Has formed a bearish
Flag pattern and we are
Already seeing a bearish
Breakout so we are
Bearish biased and we
Will be expecting
A further move down
Sell!
Like, comment and subscribe to help us grow!
Check out other forecasts below too!
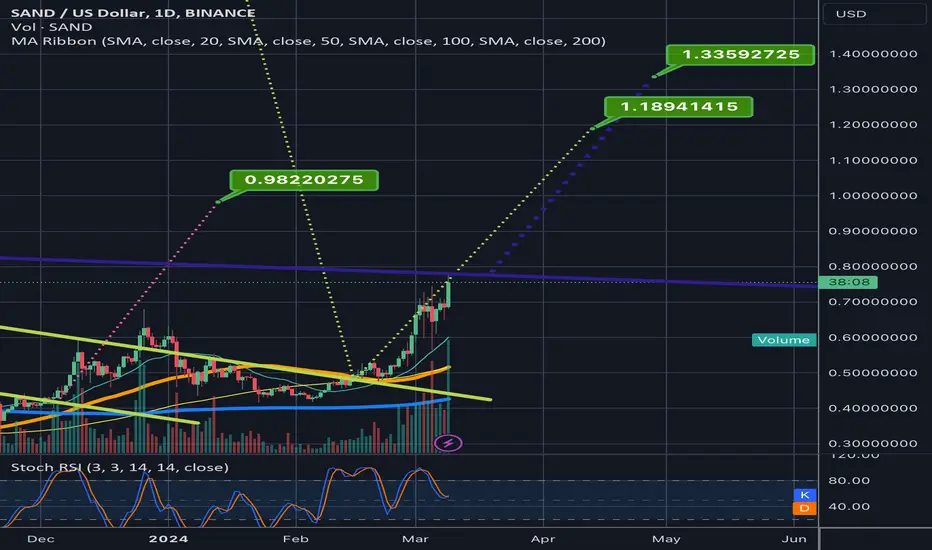
It appears that the metaverse & gaming cryptos are waking up. Just as we are finally seeing mana pump and gala, we are now likewise seeing sand follow suit too as it seems to have finally broken up from the extended descending bear flag it was in for the longest time that I have posted charts about in the past. There are two possible measured move targets for the yellow channel its breaking up from. The dotted pink line represents th target if the slightly lower top trendline is the more valid top trendline of the channel, and the dotted yellow line repres
S
Bitcoin Bears Roar: Flagging Down to $52K? 🐻📉📉 Bitcoin Analysis: Rejection from Bear Flag Pattern on 4-Hour Chart
📊 Analysis: Bitcoin appears to be rejecting from a bear flag pattern on the 4-hour chart, indicating potential further downside.
💲 Current Price: Bitcoin is priced at $64,100, showing signs of downward pressure.
📉 Measured Move: The measured move of the bear flag pattern points to a target of $52,000, coinciding with a .382 Fibonacci retracement level.
🔍 Invalidation: Invalidation of the bearish scenario would occur if Bitc
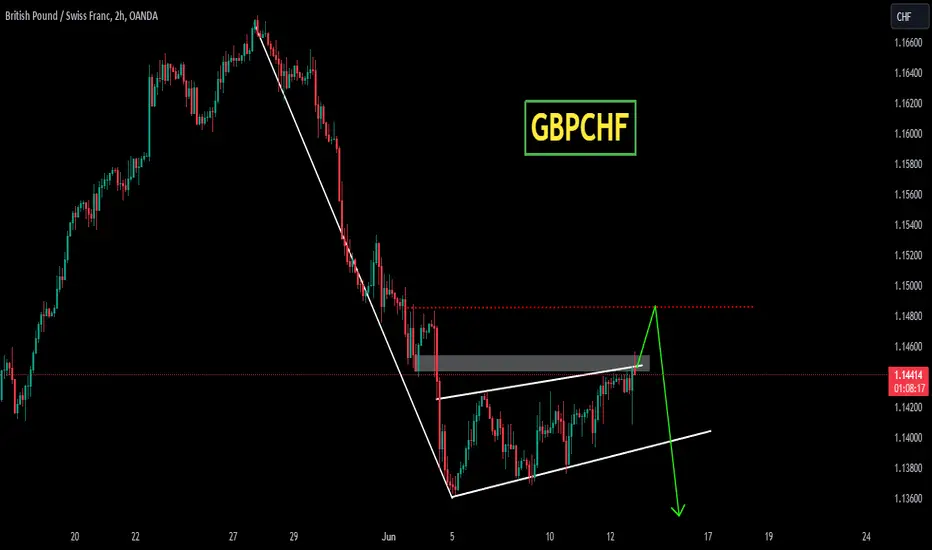
GBPUSD Update: Potential Bearish Flag Trading Setup IdentifiedTrade Setup:
- Entry: Sell at retest of trendline
- Target: Extended towards Bullish Butterfly Pattern completion zone
- Trade Management: Utilizing upsize trade strategy
Analysis:
While many analysts see consolidation, I've identified a potential Bearish Flag trading setup on GBPUSD. The series of lower highs on the 4-hourly chart indicates a possible continuation of the bearish trend. I'm waiting for a retest on the trendline to execute a short position on GBPUSD. Using my trade manageme