#BITCPOIN crash is coming 🚨🪙📊 Bitcoin – Flat Correction Update
🔄 After hitting a low of 63K on 28 Feb, Bitcoin started its corrective rise. The A wave unfolded in 3 sub‑waves, signaling a Flat Correction (B wave retraces > 61.8%).
📉 B wave: Formed on 29 Mar with a low of 65K
📈 C wave: Currently unfolding in 5 sub‑waves:
1️⃣ Wave 1: Completed on 10 Apr 📉💹
2️⃣ Wave 2: Bounce completed on 13 Apr 🔼📊
3️⃣ Wave 3: Sharp rally to 79,482 🚀💰
4️⃣ Wave 4: Flat cooling, completed on 29 Apr 🧊📉
5️⃣ Wave 5: Now continuing — any confirmation in price is a short signal 🐻⚡📉, with potential downside towards 60K 💥💹
Bearish Gartley
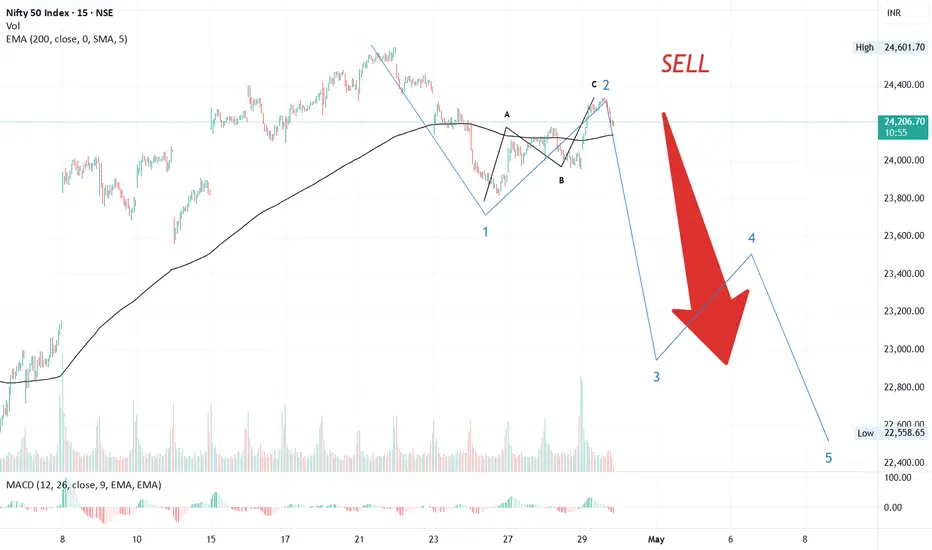
#NIFTY BEAR TREND START⚡️📉🔥 Nifty Elliott Wave Alert 🚨💥
After touching a high of 24,600 (22 Apr), Nifty started its decline:
1️⃣ 📉 Wave 1 (24 Apr): Dropped to 23,800
– Subwave 5 🌀 was the largest, hinting at rebound potential.
2️⃣ 🔄 Wave 2: Zig‑zag correction, retraced back to 24,300 ✅
3️⃣ ⚡️🚨 Wave 3: Now unfolding, with downside targets near 23,000 🎯
---
👉 Structure is clear:
🐻 Bears are gaining control.
📉 Expect continued weakness as Wave 3 progresses.
💡 Trading Insight: Look for confirmation, then go short — risk‑reward favors the downside.
US100 | Retracement Into Supply Before Potential Continuation LoNASDAQ is currently pushing into a key supply zone around 24,700 – 24,760 after a strong recovery from the recent lows. This move appears to be a corrective pullback within the broader bearish structure.
The highlighted supply area previously acted as a distribution region, making it a high-probability reaction zone for sellers.
If price reaches this zone and shows rejection, we could see the formation of a lower high, leading to a continuation toward the downside.
Projected scenario:
• Price taps 24,700 – 24,760 supply
• Sellers step in creating a lower high
• Market rotates lower toward 24,360 liquidity level
This level represents the next draw on liquidity, where price may seek resting sell-side liquidity.
Key Levels
Supply Zone: 24,700 – 24,760
Current Price: ~24,645
Liquidity Target: ~24,360
The idea remains valid as long as price stays below the supply zone. A clean break above it would invalidate the bearish outlook.
NIFTYHello & welcome to this analysis
On the eve of FOMC meet, the index has today covered the gap down made on July 11th and entered the potential reversal zone (PRZ) 25350 - 25425 of two bearish harmonic patterns - Butterfly (15m) & Gartley (daily).
Reversal confirmation as of now is once it starts giving a 60m close below 25225.
Pattern gets negated above 25525.
All the best
Regards
GOLDHello & welcome to this analysis
A bearish Harmonic Deep Crab formation took place in the 60m time frame, after an initial dip which formed bullish hidden RSI divergence in 60m time frame the pullback has now formed a bearish Harmonic Gartley in 15m time frame.
Sustaining below 88000 opens for 87500 and 86500.
Good risk reward set up for a bearish trade.
All the best
Stock Market Analysis Report: Lupin Limited (NSE: LUPIN)
Introduction
Greetings, traders! If you're looking for a pharmaceutical stock that might just cure your portfolio blues, look no further than Lupin Limited. This stock is brewing up an interesting pattern that’s worth a closer look. Let’s dive into the technical details and see what’s in store!
Price Action Overview
Chart Analysis
Current Price: ₹1,759.30
Daily High: ₹1,767.00
Daily Low: ₹1,598.25
Volume: 10.039M
Key Technical Indicators
Bearish Gartley Pattern: The chart reveals a bearish Gartley pattern, suggesting a potential reversal.
Rectangle Pattern with Potential False Breakout: The price is within a rectangle pattern, hinting at a potential false breakout.
Decreasing Volume: The volume is on a decline, which could signal weakening momentum.
Detailed Analysis
Bearish Gartley Pattern
Formation: The Bearish Gartley pattern, marked by points X, A, B, C, and D, indicates a potential reversal from the current uptrend.
Implications: This pattern suggests that the stock might face resistance at the current levels and could potentially see a pullback.
Rectangle Pattern with Potential False Breakout
Rectangle Pattern: The stock price is trading within a rectangle pattern, showing consolidation between support and resistance levels.
False Breakout: The current breakout might be a false one, as indicated by the rectangle pattern and the resistance at point D.
Decreasing Volume
Volume Trend: The decreasing volume trend suggests that the current upward momentum might be losing steam.
Significance: Lower volume during a breakout can indicate a lack of strong buying interest, increasing the chances of a reversal.
Price Targets and Support Levels
Immediate Resistance: ₹1,800.00 - This is the next resistance level to watch closely.
Support Levels:
Primary Support: ₹1,600.00 - A key level to maintain for bullish sentiment.
Secondary Support: ₹1,400.00 - A more conservative support level aligning with previous consolidation areas.
💊📉
Conclusion
Lupin Limited is showing a bearish Gartley pattern with a potential false breakout within a rectangle pattern. The decreasing volume adds caution to the current bullish momentum. Keep an eye on the resistance level at ₹1,800.00 and monitor the volume to gauge the strength of the current trend. Happy trading, and may your portfolio stay healthy and robust! 🌿💰
Disclaimer
This analysis is based on historical data and chart patterns. Always do your own research and consider your risk tolerance before making any investment decisions.
Nifty - Possible Leading Diagonal / Bearish GartleyThe leading diagonal or rising wedge or type-1 diagonal, is a narrowing price move composed of two converging trendlines.
If bottom or lows of 16836 & 16866 holds then Index can push upside tomorrow on account of Budget 2022
-----------------------------------
Trading Strategy
-----------------------------------
-----------------------------------
Part A - Mixed Outlook
-----------------------------------
Buy Above 17325 - Target 17410 / 17500 - Going into the PRZ (Potential Reversal Zone)
Sell Below 17500 Only if Index halts in PRZ (Potential Reversal Zone)- Target 17260
-----------------------------------
Part B- Bullish Outlook
-----------------------------------
Finally, Buy If Index halts & takes support at 17075 or look to buy close to 16865- Keep in mind these supports should not be broken.
-------------------------------------
Last Idea on Nifty
-------------------------------------
UBL - VIEWBUY BASED ON (disclaimer - for study purpose only)
GARTLEY BEARISH PATTERN COMPLETION
BUY FOR TARGET 1245+, 1188 CAN BE IN BTW RESISTANCE
WITH STOP AS COMFORT
SUPPORTING FACTORS FOR BUY :->>>
***CONSISTENT VOLUME SUPPORT
***weekly oscillators neutral but strong buy support in daily frame
***weekly close above 200ma can give support
Bearish movementWe had a long side-away uptrends for past couple of week’s in EURUSD. There is no stopping out of biggest uptrends rally of EURUSD seems to be highest level of value,Since April 2018. According to our prediction and analysis the value of chart will goes downtrends and have a small wave up ⬆️ and starts to falls to the low high.
PEL - Hourly Chart - Bearish GartleyPEL seen forming bearish Gartley around with PRX around 1360 levels. The pattern is still in formation.
Wait for a strong reversal candle in PRZ before entering. I'll prefer a high volume candle for confirmation.
Do not hurry to enter, wait for confirmation.
Views only for educational purposes, and not a trading advise. Assess your risk and enter any financial positions. Always keep stop loss.
PShort