Bearish Shark
NZDJPY Trend Reversal OpportunityOn the 1-hourly chart, it looks like a regular shorting opportunity with Key Resistance Level retested at the almost perfect, but potential BOJ Intervention zone, so for traders of all kind to ''try their luck!!''
However, on the Grand Scale of things, and it is a Type2 Bearish Shark Pattern on the Daily Chart.
After I'd include the buffer, I the market hit Price Action Level at 94.00, hence, I'd to push my SL 10pips away, but making it 94.10.
Let see how the market moves before the New York Session ''opens''
Bitcoin (BTC) Price Analysis: Preparing for the Bearish AbyssIn this technical forecast, we delve into the darker recesses of Bitcoin's potential price journey. We observe a concerning configuration on the BTCUSD chart where the currency is currently grappling with critical support levels.
Current Dynamics:
The price has recently retracted from a peak, teasing the possibility of a significant downtrend.
A descending channel formation can be seen, indicating a tightening bearish grip on the market momentum.
Worst Case Trajectory:
Should the price break below the sturdy support zone, indicated by the green rectangle, we may see an accelerated drop.
The price could tumble toward the lower boundary of the channel, a line that has historically acted as a gravitational pull during bearish trends.
Key Levels to Watch:
Immediate support resides within the green rectangle zone. If this fails, the descent could be sharp and unforgiving.
Further support is hypothesized by the extended yellow trend lines, outlining a worst case range that could spell distress for bulls.
Projected Pathways:
The worst case scenario envisions a stark descent, followed by a period of consolidation below the current support.
A relief rally might attempt to reclaim lost ground, but the overarching trajectory remains bleak in this hypothesis.
Conclusion:
While we must tread with caution, preparing for a bearish eventuality is prudent. Investors and traders should brace for volatility and consider the historical behavior of the market during similar patterns. Vigilance is key as we watch for potential support breaches that could confirm this grim forecast.
Counter-Trend for Greater ProfitsThis week, I'm looking at NZDJPY with a bearish perspective, and here's my trade plan:
1. Bearish Shark Pattern Confirmation at 91.74: I'll be patiently waiting for the Bearish Shark Pattern to confirm at the level of 91.74. This level coincides with the formation of a Head & Shoulders pattern, adding confluence to the bearish setup.
2. Extended Trading Targets: If the Bearish Shark Pattern sets up as anticipated, I'll extend my trading targets beyond the traditional Target1 and Target2. By doing so, I aim to capitalize on the potential bearish momentum and maximize profits from the trade.
3. Stop Loss Management: Once the market reaches the traditional Target1 of the Shark Pattern, I'll shift my stops to the entry level to protect profits and minimize risk.
By patiently waiting for the bearish setup to confirm and managing stops effectively, I aim to capitalize on the shorting opportunity presented by NZDJPY this week.
What are your thoughts on NZDJPY? Feel free to share your trade plans and insights below!
Wishing everyone successful trading ahead!
Short on EURUSDThis week, I'm leaning towards a shorting opportunity on EURUSD for a couple of reasons:
1. **Bearish Shark Pattern on Daily Timeframe:** The presence of a Bearish Shark Pattern on the daily timeframe suggests a potential downward movement in the price.
2. **Breakthrough of Bullish Gartley Pattern:** The Bullish Gartley Pattern on the 4-hourly chart breaking through the Potential Reversal Zone (PRZ) indicates a weakening bullish sentiment.
3. **Waiting for Retest:** I'll be patient and wait for the market to retest the resistance level at 1.09121 before entering a short position.
What are your thoughts on EURUSD? Share your trade plans and perspectives below!
Let's make this week a profitable one!
Happy Trading!
Anticipating a Buying Opportunity on Daily ChartEURUSD is catching my attention, and here's my perspective:
1. Bearish Shark Pattern on Daily Chart:
- For traders seeking shorting opportunities, there's a Bearish Shark Pattern on the Daily chart.
- The completion of this pattern might indicate a potential bearish move.
2. Buying Opportunity at 1.0879:
- Personally, I'm eyeing a buying opportunity on EURUSD.
- Despite a flawed Bullish Shark Pattern, I'm looking to enter long at 1.0879.
Share your thoughts and trade plans for EURUSD in the comments below. Let's keep the discussion going!
RSI Divergence and Bearish Shark Pattern Combo TradeToday, let's delve into an intriguing setup on GBPJPY that combines a Weekly Chart RSI Divergence with a 1-hourly Bearish Shark Pattern:
1. Weekly Chart RSI Divergence:
- Observe the RSI Divergence on the Weekly Chart, signaling a potential weakening of the bullish trend.
- This divergence might serve as a precursor to a reversal or retracement.
2. 1-hourly Bearish Shark Pattern at 190.72:
- Look for a shorting opportunity as the Bearish Shark Pattern completes at 190.72 on the 1-hourly chart.
- Engaging in a short position aligns with the potential bearish sentiment suggested by the RSI Divergence.
This combo trade approach involves using higher timeframes for trend analysis (Weekly RSI Divergence) and pinpointing a precise entry with a harmonic pattern on a lower timeframe (1-hourly Bearish Shark).
Feel free to share your thoughts and trade plans for GBPJPY in the comments below. For a visual representation, refer to the chart link provided.
Science of Trading ApproachToday, I'm excited to share a detailed approach for trading GBPUSD. If you're considering a short position, here's a comprehensive strategy:
1. 1-Hourly Chart: Shark Patterns at 1.2676
- Wait for Shark Patterns to complete at 1.2676 on the 1-hourly chart.
- Look for a trading combo within the chart when the market retests the Trendline Break (red line).
- Ensure the market doesn't violate the trendline during this process.
2. 4-Hourly Chart: Bearish Gartley Pattern at 1.2725
- The ideal scenario is for the Bearish Gartley Pattern to complete at 1.2725 on the 4-hourly chart.
- Aim for completion before Monday, March 4, 2024, by 5 pm. Patterns completing after this time are considered disqualified.
This Science of Trading approach allows for a meticulous analysis and synchronization of different patterns across multiple timeframes. It provides a well-defined strategy for traders looking to short GBPUSD.
Feel free to share your thoughts and insights. Are you considering a similar approach or have different plans for GBPUSD?
For a visual representation, please refer to the chart link in the TradingView post.
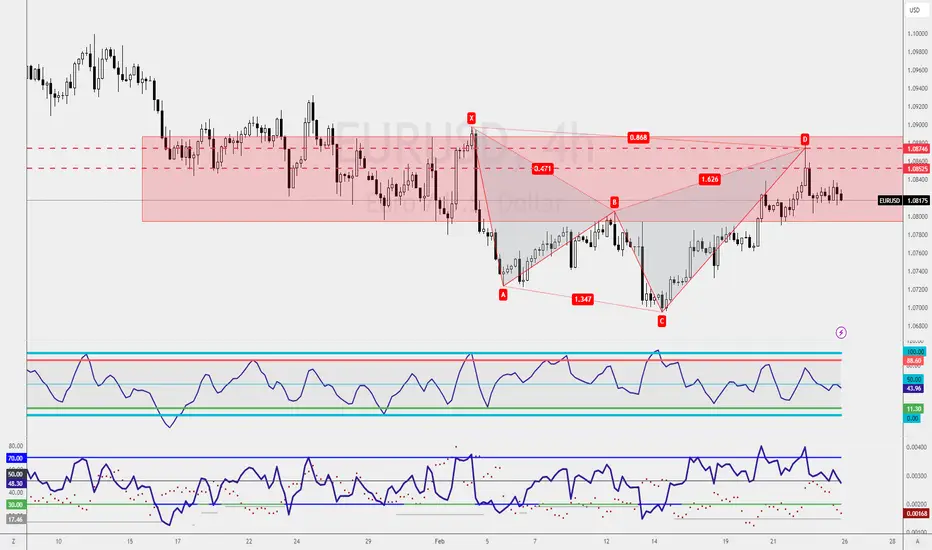
EURUSD Trading Plan: Bearish Shark Pattern RetestIn our EURUSD analysis, we are identifying a potential shorting opportunity for counter-trend traders. Here are the details:
1. Setup: Bearish Shark Pattern Retest
2. Timeframe: 1-Hourly Chart
3. Key Levels:
- Retest Level 1: 1.0852
- Retest Level 2: 1.0874
The Weekly Chart suggests a weaker bull trading setup, and on the 4-hourly chart, a bearish trend is noticeable. The Bearish Shark Pattern on the 1-hourly chart provides a counter-trend trading opportunity.
Feel free to share your thoughts on which retest level you find more suitable for a shorting opportunity.
NZDJPY Trading Plan: Bearish Shark Pattern RetestIn our NZDJPY analysis, we are observing a potential shorting opportunity on the 1-hourly chart. Here are the details:
1. Setup: Bearish Shark Pattern Retest
2. Timeframe: 1-Hourly Chart
3. Key Level:
- Entry Point: Bearish Shark Pattern Retest at 92.07
The Daily Chart reveals a Bearish Gartley Pattern at X with RSI Divergence, suggesting a potential bearish move. On the 1-hourly chart, the Bearish Shark Pattern provides an additional layer of confirmation for a shorting opportunity.
Feel free to share your insights, and let's navigate this market together.
EURUSD Trading Plan: Bearish Shark Pattern on 4-Hourly ChartLet's delve into the EURUSD trading plan for the upcoming period.
The weekly chart suggests a weaker bull trading setup, signalling a bullish trend with some weakening.
However, the four-hour chart paints a different picture, displaying a bearish trend.
Here's the comprehensive trading plan:
1. Weekly Chart: Indicates a weaker bull trend.
2. 4-Hour Chart: A Bearish Shark Pattern is anticipated to complete within the sell zone at 1.0874, presenting a potential shorting opportunity.
Given the bearish trend identified on the four-hour chart, the focus will be on the Bearish Shark Pattern for a potential short trade.
Share your thoughts and insights on this trade plan!
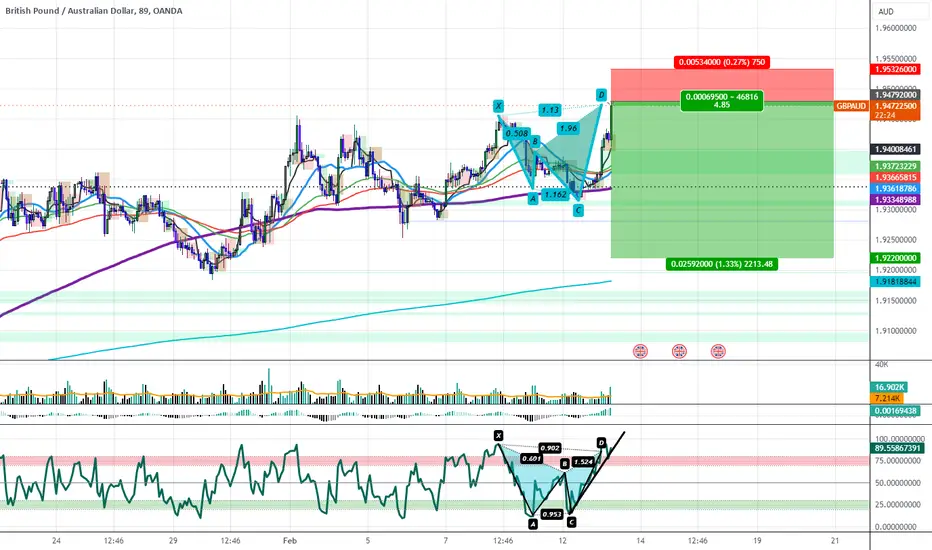
GBPAUD: Pushing into the PCZ of a Bearish SharkGBPAUD is pushing above the range resistance and into the PCZ of a Bearish Shark with elevated volumes, at the same time there is a Bearish Gartley formed on the RSI and the RSI is setting up to breakdown while in the overextended zone. I think we will likely see the AUD take back dominance for a few months in many of its pairs, particularly in the GBPAUD and AUDUSD pairs.
It is possible that the GBPAUD pushes above 1.95 for a short amount of time, I will likely continue shorting into 1.955
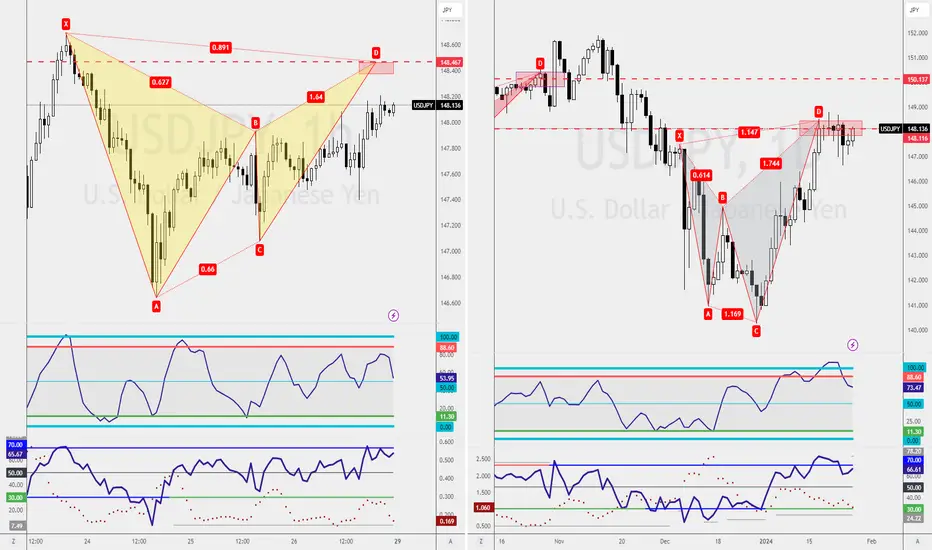
Awaiting Confirmation for Shorting Opportunity Traders,Despite a strong bullish candle, the presence of a Bearish Shark Pattern retest on USDJPY is intriguing.
However, the trader advocates waiting for further confirmation to engage in a shorting opportunity on USDJPY, treating it as a retracement trade.
What's your take on the potential trade for USDJPY?
BTC still trading withing Bull FlagBitcoin is at 42.8k and still trading within the premises of BULL FLAG pattern...
Which in my opinion is a good range to trade but we may see some volatility hitting market soon maybe in the upcoming days or weeks...
What do you think will BTC touch that lower zone?
Which is around 34-36k zone
Drop your opinion below..
I will read all
Combo Trade OpportunityAn amazing Bearish Fib-3 Bat with RSI Divergence has surfaced on the CADJPY 1-hourly chart.
While some may see this as a great counter-trend trading opportunity, others might interpret it as a warning sign and choose not to engage.
But here's the twist - it's a Combo Trade.
On the Weekly Chart, there's a Bearish Shark Pattern Retest, accompanied by a Type2 Bearish Gartley Pattern.
What's your take on CADJPY?
Share your trade plan for CADJPY in the comments below!
Combo Trade Strategy for Potential Head and ShouldersThe USDJPY's Weekly chart is showing signs of a potential Head and Shoulders formation.
While engaging directly on the weekly chart might be considered risky, what if we use a Combo Trade Management strategy?
There's a Bearish Shark Pattern on the Daily chart, and we might witness a formation of a
Bearish Deep Gartley Pattern on the 1-hourly chart, providing a counter-trend trading opportunity.
Which of these trading opportunities do you prefer? Share your thoughts!
Sideways Movement with Trade OpportunitiesEURUSD is exhibiting a sideways movement on the weekly chart.
Here are two potential trade opportunities:
1. Buying Opportunity:
- Wait for a retest of support at 1.0847 for a potential buying opportunity.
2. Shorting Opportunity:
- Look for a shorting opportunity on the Bearish Shark Pattern at 1.0893.
What's your preferred trade plan for EURUSD?
Confluence of Bearish PatternsCADJPY is displaying a confluence of bearish patterns:
1. Weekly Bearish Shark Pattern:
- Retest in progress.
2. Daily Type2 Bearish Gartley Pattern:
- Completion aligns with the Bearish Shark on the weekly.
The trader plans to wait for a confirming candle on the daily chart near the level of 110.37.
Share your insights and trade plans for CADJPY!
Potential Head and Shoulders & Early Trading OpportunitiesUSDJPY is showing promise with a potential Head and Shoulders pattern on the Weekly Chart. Here's the game plan:
1. Awaiting Bearish Shark Pattern Confirmation on Daily Chart:
- Patient approach for a comprehensive setup.
2. Early Trading Opportunities on 15-Minutes Chart:
- Spotted Bearish Bat and Bearish Gartley Patterns.
- Potential for quicker engagements on shorter timeframes.
Stay vigilant and let's discuss your insights on this evolving USDJPY scenario!
Combo Trade: Patience for ConfirmationGBPUSD is setting up for a potential combo trade. Keep an eye on:
Bearish Shark Pattern:
Timeframes: 15 mins and 1-hourly
Completion: 1.2708
What makes this interesting is that both Shark Patterns have different starting points.
Exercise patience and wait for candlestick confirmation. Share your insights and trade plans on GBPUSD!
Waiting for ConfirmationIf you're seeking shorting opportunities on EURUSD, I've got two potential setups for you.
Remember, always wait for candlestick pattern confirmation before making your move.
Bearish Shark Pattern: Look out for completion at 1.0917.
Bearish Bat Pattern: This setup is more intriguing to me, as the Potential Reversal Zone (PRZ) aligns with the bearish trendline.
Be patient and let the market confirm the patterns. Share your thoughts and trade plans on EURUSD below!
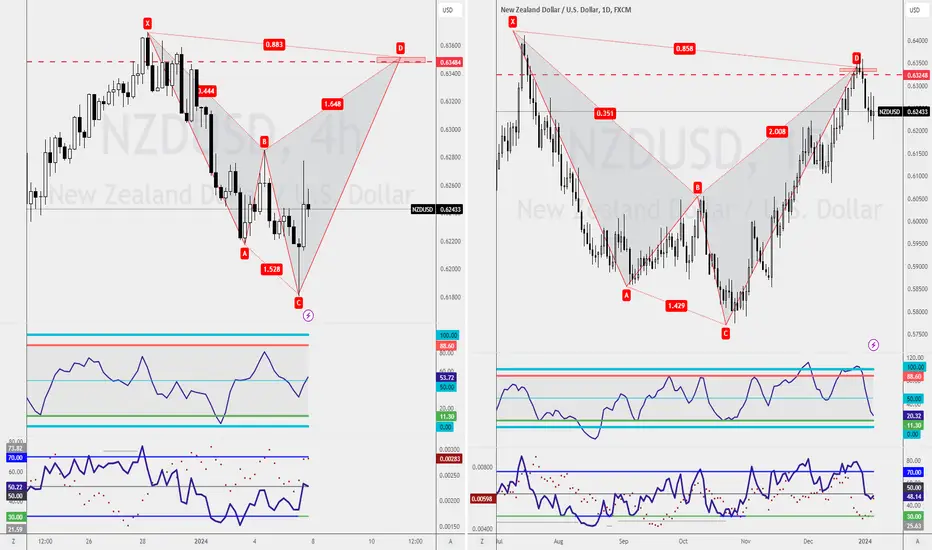
Anticipating a Combo Trade Short OpportunityMy sights are set on a compelling setup for NZDUSD. Both the Weekly and Daily Charts align with a Bearish Shark Pattern, presenting a powerful Combo Trade opportunity.
I'm waiting patiently for the Bearish Shark Pattern completion at 0.6352 on the 4-hourly chart, aiming for a High Profit Factor with reduced initial risk.
What are your thoughts on NZDUSD? Any strategies or insights to share?
A Promising Bearish SetupI'm keeping a keen eye on what I consider a golden trading opportunity - the retest of a Bearish Shark Pattern coinciding with a higher timeframe Type2 Bearish 5-0 Pattern on the Daily Chart.
My plan is to wait for a retest around 184.15, aiming for a shorting opportunity.
What's your take on GBPJPY? Any strategies or thoughts you'd like to share?