APARINDS Price actionAPAR Industries (APARINDS) is currently trading between ₹8,083 and ₹8,620 per share as of June 26, 2025. The stock is down about 31% from its 52-week high of ₹11,779.90 (reached in January 2025), but it remains 85% above its 52-week low of ₹4,308.05 (from April 2025). Over the past six and twelve months, APARINDS has delivered negative returns of -22.68% and -16.58%, respectively, reflecting a significant correction after a strong rally earlier in the year.
Valuation-wise, the stock has a price
Bullish Patterns
JTO Long Setup – Range Low Accumulation with Bottom PotentialJTO remains range-bound and is showing signs of a potential bottom, with downside liquidity largely cleared. We’re watching the $1.80–$1.90 zone for a long entry, as long as price holds above the key $1.65 invalidation level.
📌 Trade Setup:
• Entry Zone: $1.80 – $1.90
• Take Profit Targets:
o 🥇 $2.60 – $2.80
o 🥈 $3.80 – $4.00
• Stop Loss: Daily close below $1.65
LINK Long Swing Setup – Higher Low Retest at Key SupportLINK has shown strong relative strength in recent weeks and is now retesting the $12 support zone. With broader markets stabilizing, this level could confirm a higher low and set the stage for continued upside.
📌 Trade Setup:
• Entry Zone: Around $12.00
• Take Profit Targets:
o 🥇 $15.00 – $16.00
o 🥈 $19.00 – $20.00
• Stop Loss: Daily close below $11.00
ETH/USDT Dumped hard as I predicted and next Target?ETH SHORT HIT — As Predicted!
Hey fam
Hope you enjoyed the ETH short setup I shared earlier when price was around $2700–$2800
ETH is now down 22% from that level.
Broke support just like we discussed…
And remember I said — if $2500 breaks, we could see $2200.
Well… we’re already there now ✅
What Now?
This is where we start accumulating on spot.
Why?
Because ETH is currently at the 0.5 Fib level — could hold.
If not, we target 0.618 Fib for next entry.
Best Accumulation Zone: $2200–$1800
$TAO dumped 30% — and we called it at the topLSE:TAO dumped 30% — and we called it at the top.
We gave the exit at $480.
Now it’s trading near $329. Hope you booked profits or caught that juicy short.
But it’s not over yet 👇
➡️ $350 support broken
➡️ Key zone: $300–$250
➡️ Why? That’s where FVG, 0.5, and 0.618 Fib align.
I’m watching $250 for fresh entries.
Long-term vision? Still see $2k- $3k on the horizon.
Big dips = Big setups.
#TAO #Bittensor NFA & DYOR
INJ Long Swing Setup – Approaching Fibonacci & Major SupportInjective (INJ) is nearing a key support zone that aligns with the 61.8% Fibonacci retracement level. This confluence area around $10.20–$11.30 offers a strong setup for a potential long swing trade.
📌 Trade Setup:
• Entry Zone: $10.20 – $11.30
• Take Profit Targets:
o 🥇 $14.00 – $16.00
o 🥈 $20.00 – $23.00
• Stop Loss: Daily close below $9.00
Will Bitcoin Hit $80k Before $171,000 ?Bitcoin is Forming a Inverse Head & Shoulders on the 2D chart...
And if this plays out — we could be looking at a move to $171,000
Here’s what you need to know:
Structure Breakdown:
▪️ Left Shoulder: Completed
▪️ Head: Completed
▪️ Right Shoulder: (in progress)
Neckline: ~$112.5K-$115k
Breakout above neckline = $171K target
That’s a +49% upside move from here.
But here’s the catch...
When too many spot the same pattern — whales love to trap.
Fakeouts, stop hunts, liquidations — you’ve seen
Ramco Cement may give break out of triangle pattern soon.Ramco Cement as per chart is trading on triangle pattern. As per indicator stock is bullish and ready for breakout. Major supply zone is 1010. After crossing this level, it may give massive move for considerable gain. It can accumulate here add more after breakout.
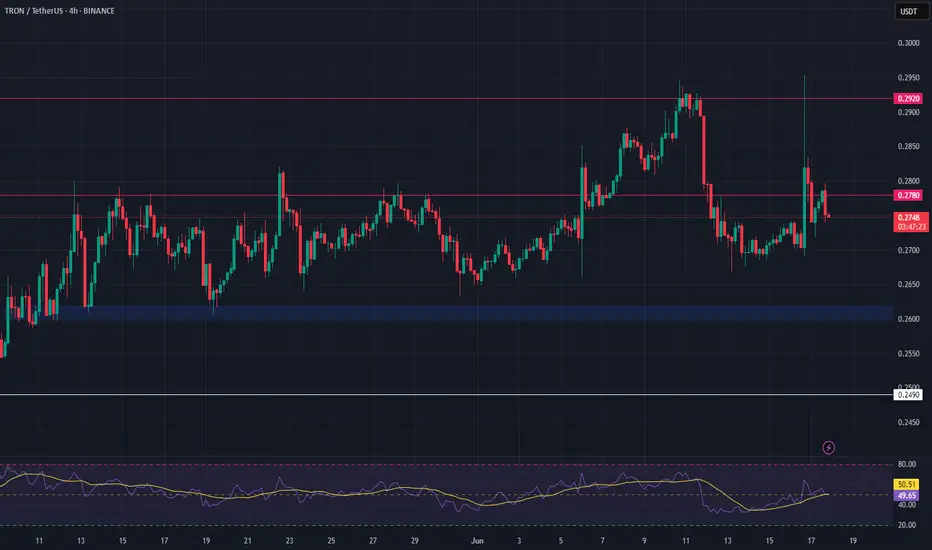
TRX Long Swing Setup – Waiting for Pullback After Bullish RallyTRX has seen a strong rally over the past few days, and we’re now watching for a retracement into support. The $0.260–$0.262 zone offers a potential long spot entry as price cools off.
📌 Trade Setup:
• Entry Zone: $0.260 – $0.262
• Take Profit Targets:
o 🥇 $0.278
o 🥈 $0.292
• Stop Loss: Daily close below $0.249
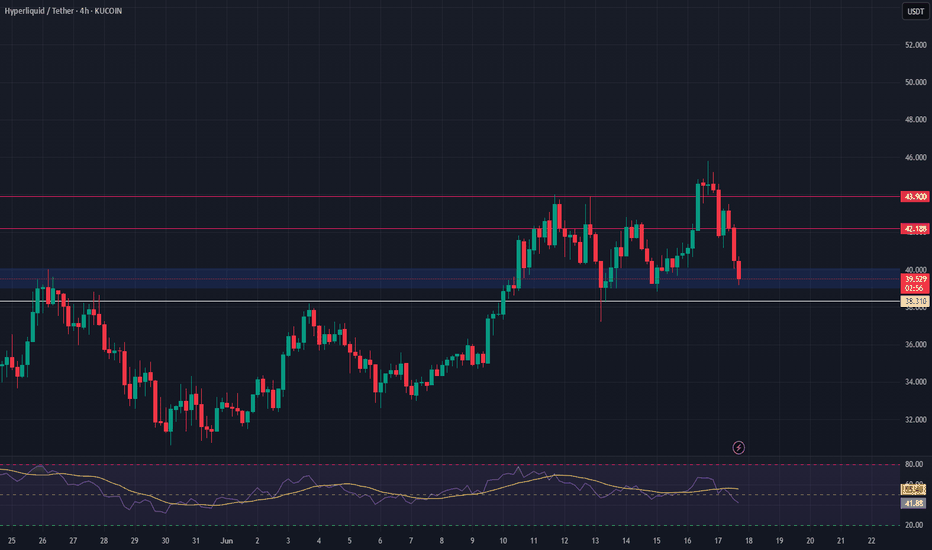
HYPE Long Swing Setup – Approaching Key Support ZoneHYPE is under pressure but now nearing a major support level, presenting a potential opportunity for a bounce. We’re eyeing the $39.00–$40.00 zone for a long entry as buyers may step in at this key area.
📌 Trade Setup:
• Entry Zone: $39.00 – $40.00
• Take Profit Targets:
o 🥇 $42.18
o 🥈 $43.90
• Stop Loss: Daily close below $38.31
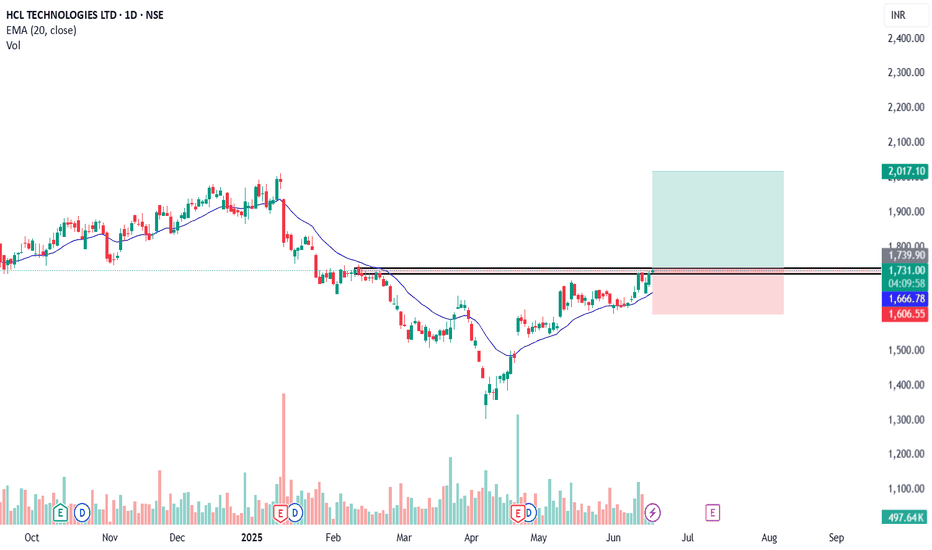
Bullish Breakout in HCL TechStock breaks above key resistance zone of ₹1770
Strong bullish candle formation on the daily chart
Breakout supported by above-average volume, confirming strength
Price broke out from ascending triangle pattern — a classic bullish continuation signal
📢 Fundamental Trigger:
HCL Tech remains strong in cloud, AI, and digital transformation services
Recent deal wins and strong Q4 results supporting bullish sentiment
Attractive valuation compared to peers like TCS & Infosys
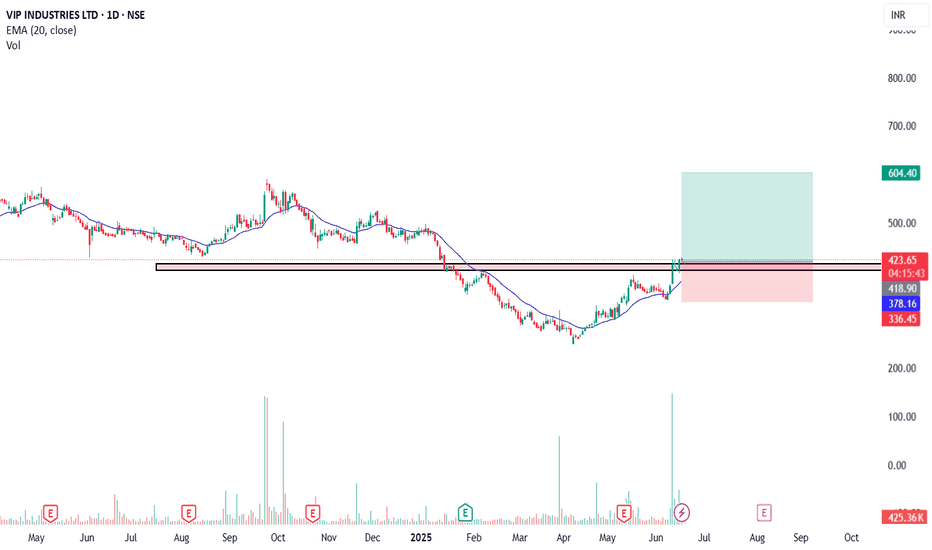
Bullish Breakout in VIP Industries 🔍 Chart Overview:
Breakout above resistance zone at ₹420
Strong volume spike confirming buying interest
Price action broke out of a consolidation channel
Formed a bullish flag/pennant pattern before breakout
🔧 Technical Indicators:
RSI moving above 60 → bullish momentum building
MACD crossover near zero line → fresh upward signal
50 EMA support intact, stock trading above all major EMAs
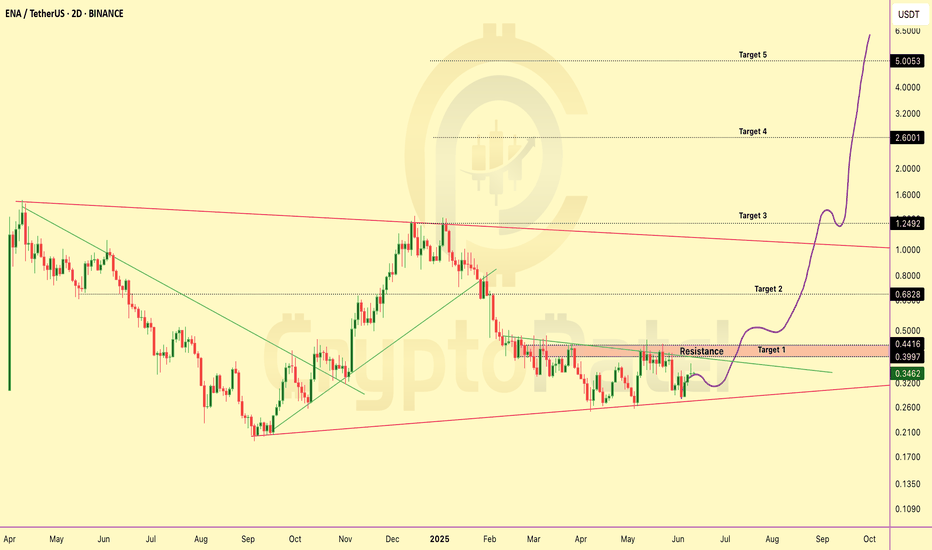
ENA/USDT Chart Analysis — Is It the Right Time To Accumulate?ENA/USDT Chart Analysis — Is It the Right Time To Accumulate?
MIL:ENA is still trading nearly -77% below its all-time high (ATH) of $1.52, currently hovering around $0.34.
Right now, the price is sitting above a strong support zone near $0.27, making the current range of $0.34–$0.30 an attractive accumulation zone — especially for long-term investors.
Short & Long-Term Targets:
Short-Term Targets: $0.44 → $0.68 → $1.25
Long-Term Potential: $2.60 → $5+
Key Levels To Watch:
Major Resistance:
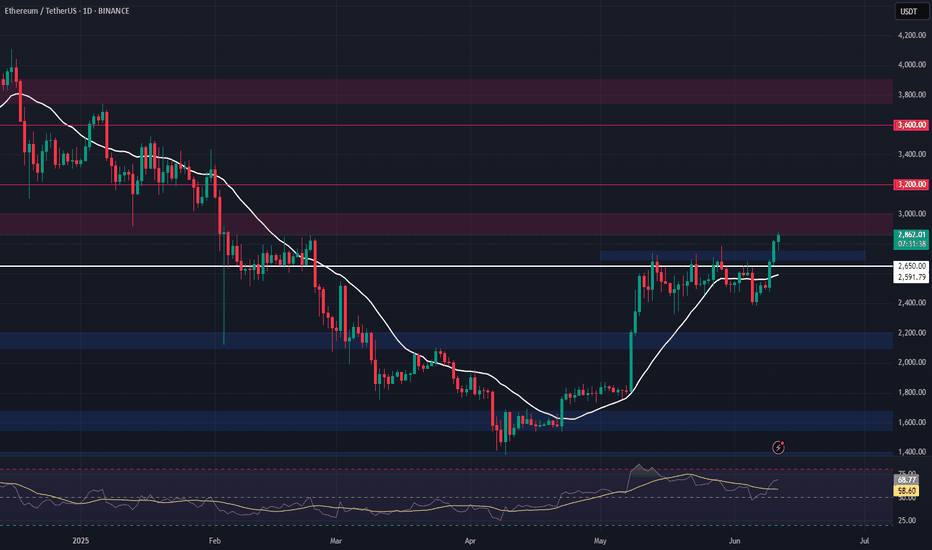
ETH Long Swing Setup – Breakout Retest of Key ResistanceETH has broken above the critical $2,750 resistance, signaling bullish momentum. We’re now watching for a retrace into the $2,700–$2,750 zone, which is expected to act as support for a continuation higher.
📌 Trade Setup:
• Entry Zone: $2,700 – $2,750
• Take Profit Targets:
o 🥇 $3,000
o 🥈 $3,200
o 🥉 $3,700
• Stop Loss: Daily close below $2,650
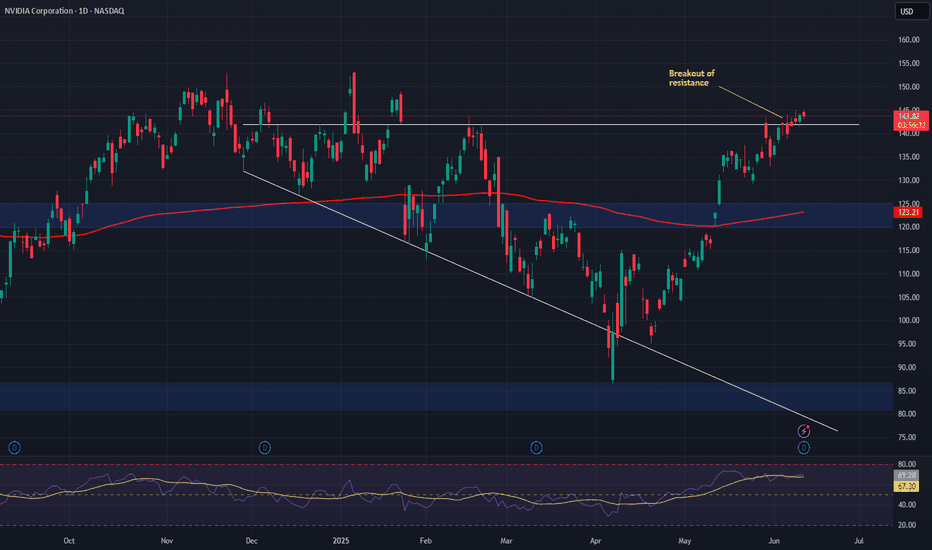
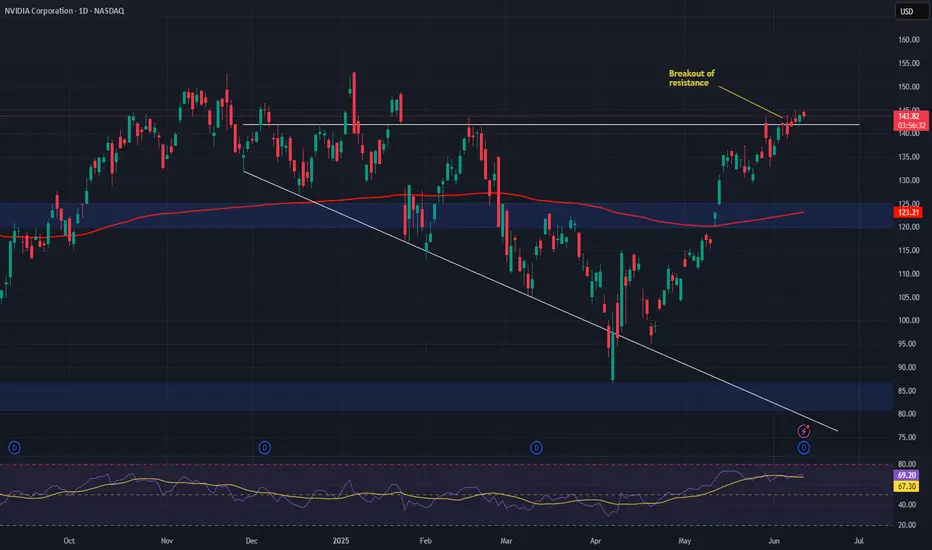
Nvidia (NVDA) – Building the AI Wave, Not Just Riding ItCompany Overview:
Nvidia NASDAQ:NVDA remains the undisputed leader in AI, high-performance computing, and now increasingly software infrastructure. With growing exposure to agentic AI, healthcare AI, and autonomous systems, Nvidia is redefining its growth story beyond semiconductors.
Key Catalysts:
🧠 Software Ecosystem Expansion
AI Blueprints, Llama Nemotron, and NIM microservices fuel adoption of agentic AI
High-margin, recurring revenue from software complements GPU hardware growth
Move
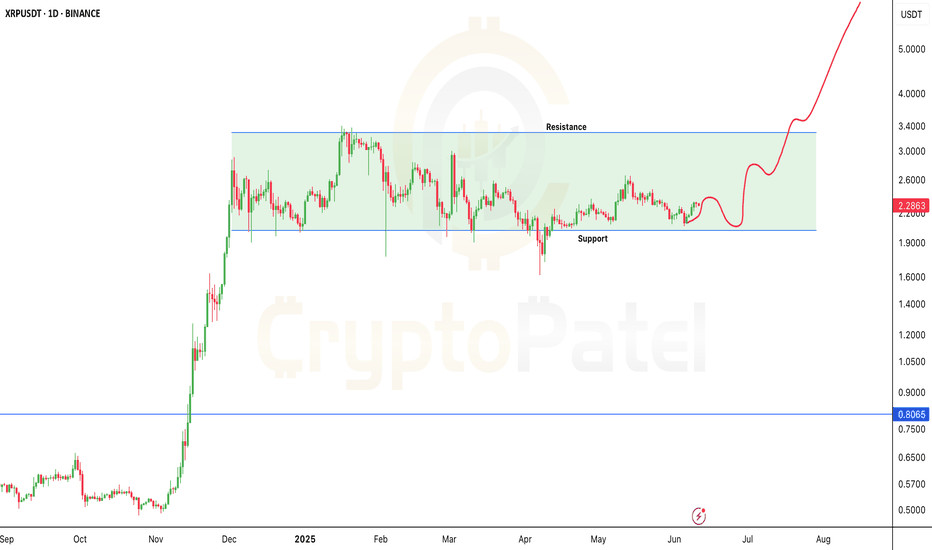
XRP Breakout Watch — Will June 16 Trigger a Bull Run?🚨 XRP Breakout Watch — Will June 16 Trigger a Bull Run? 🚨
CRYPTOCAP:XRP is holding above the key $2 support.
👉 A breakout above $2.65 → $3.00 is in play.
👉 Whale accumulation rising. Volume tightening.
👉 Ripple vs SEC ruling expected soon.
Targets if bullish: $3 → $8 → $13 🚀
Downside risk: Below $2 → $1.50 or lower.
Note: NFA & DYOR
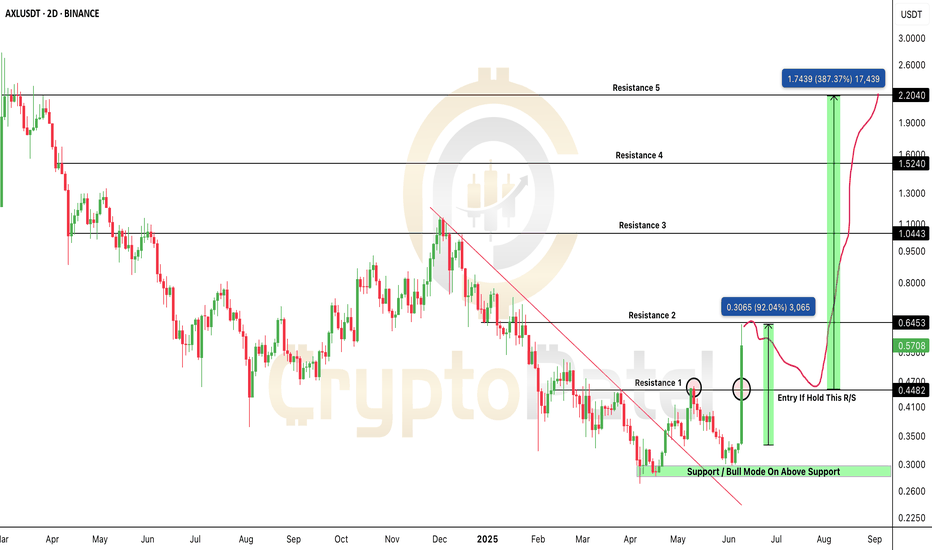
$AXL/USDT — Massive 90% Breakout, But Is It Time To Buy?$AXL/USDT — Massive 90% Breakout, But Is It Time To Buy?
NYSE:AXL has exploded +90% in just 2 days, breaking out of a long-term downtrend with huge volume.
The chart looks fire — but traders, beware:
High volatility = high risk at these levels.
Here’s the technical read:
✅ Downtrend broken
✅ $0.4482 resistance flipped → acting as strong support
✅ Structure is bullish — but a healthy correction is expected
My current view:
→ I do NOT suggest entering at this level.
→ If already holding → no
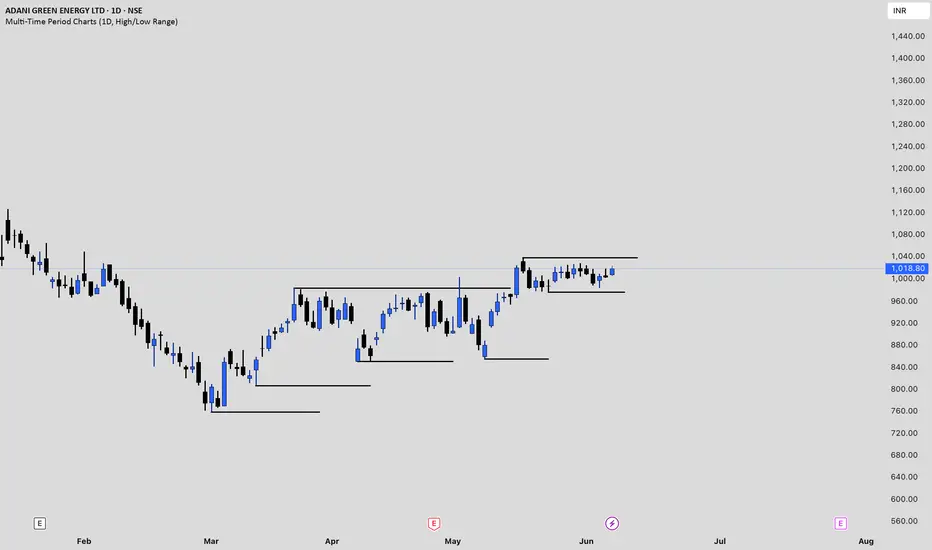
ADANIGREEN Price actionAdani Green Energy Ltd (ADANIGREEN) closed at ₹1,009.50 on June 6, 2025. The stock has shown notable volatility in recent months. Over the past month, it gained nearly 10%, and over the last three months, it’s up 18.25%. However, longer-term performance is weaker, with a 6-month decline of 18.38% and a significant 45% drop over the past year .
The stock’s 52-week high is ₹2,091, while the 52-week low is ₹758, indicating substantial price swings. ADANIGREEN trades at a high valuation, with a P/E
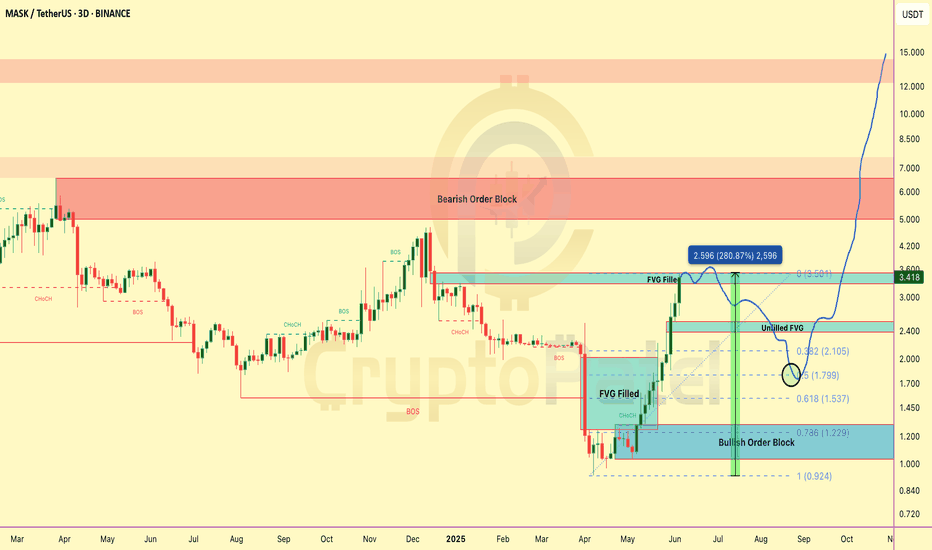
MASK 3.7x PUMP — Is a BIG DIP Coming?MASK 3.7x PUMP — Is a BIG DIP Coming?
MASK just delivered a MASSIVE rally from the Bullish Order Block at $1.2–$1.3 — and filled the FVG around $3.5.
Here’s what’s next 👇
🟢 Short-Term Outlook:
👉 After pumping from $0.927 → $3.50 → that’s a 3.7x move WITHOUT any major retracement.
👉 High chances of a healthy pullback next.
👉 Strong Accumulation Zone: If price drops towards 0.5 Fib retracement at $1.80 → This will be a key area for Smart Money to re-enter.
🟢 Mid-Term Potential:
👉 Once accumulat
Bitcoin Bulls vs Bears — Battle Zones Mapped Out#Bitcoin Bulls vs Bears — Battle Zones Mapped Out
🔰 $105K–$106.7K = Bearish Order Block:
Below this zone = CRYPTOCAP:BTC stays bearish unless HTF closes above $106.7K
🔰 Next Moves:
▪️ Likely retest $105K–$106K before next leg ↓
▪️ Target: $97K–$95K zone
🔰 Key Levels:
✅ Holding 0.618 Fib (support)
✅ Unfilled FVG: $97K–$98.3K
✅ Bullish OBs: $95.7K–$97K | $93.5K–$94.7K
If $97,000 holds strong → Expect BIG bounce!
IDEAFORGE Price action## ideaForge Technology Ltd (IDEAFORGE) Price Analysis
**Current Price and Recent Performance**
As of June 3, 2025, ideaForge Technology Ltd (IDEAFORGE) is trading at approximately ₹529 on the NSE . The stock has experienced significant volatility in recent months, with a 52-week high of ₹864 and a low of ₹301 . Over the past few weeks, the price has rebounded sharply from the ₹360–₹400 range in early May to above ₹520 by the end of May, indicating strong recent momentum .
**Valuation and Fin
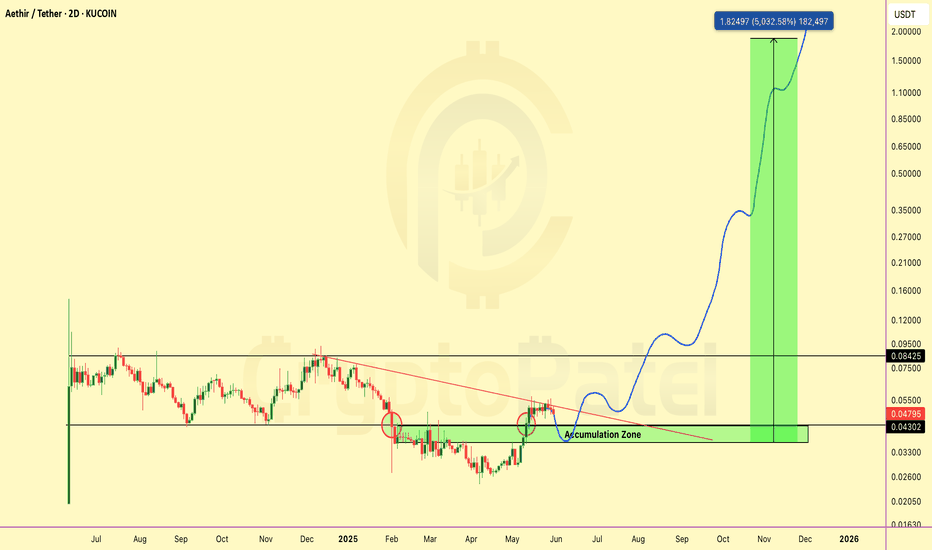
$ATH = AWS of Web3? Backed by Big VCs & Could 50xTSX:ATH = AWS of Web3? Backed by Big VCs & Could 50x
Here’s Why I’m Bullish on #AETHIR 👇
Aethir ( TSX:ATH ) is building a decentralized GPU cloud for AI, gaming, and big compute — imagine AWS on Web3.
And guess what? It’s still early.
Why Aethir is Super Bullish Right Now:
▶️ Massive Use Case – Powers AI, metaverse, & cloud gaming
▶️ Strong Team – Built by blockchain + AI veterans
▶️ Top VC Backing – Hashkey, Sanctor Capital, Merit Circle
▶️ Real Revenue Model – Users pay in TSX:ATH to acc