Bullish Patterns
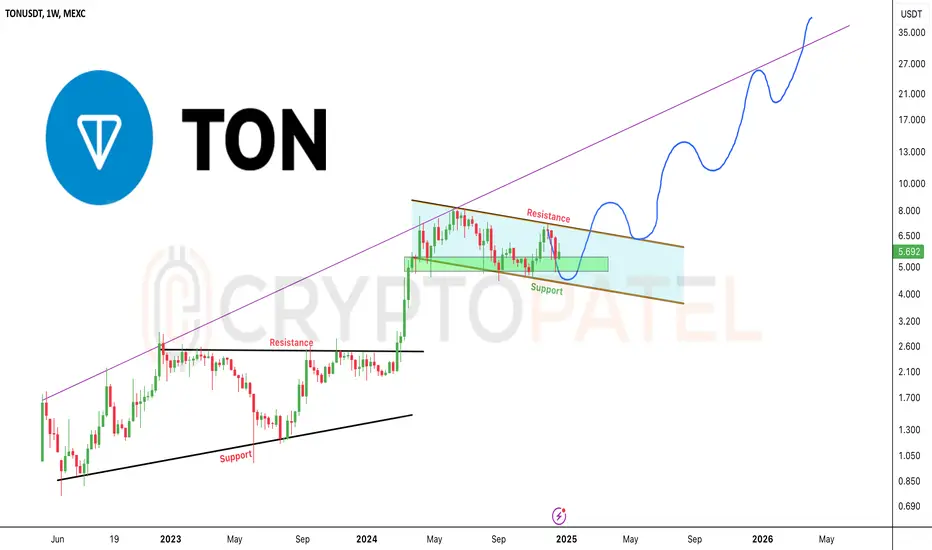
TON/USDT Bullish Breakout Alert – Could $TON Hit $50?🔥 TON/USDT Bullish Breakout Alert – Could CRYPTOCAP:TON Hit $50?
CRYPTOCAP:TON is heating up! A bull flag pattern is forming on the HTF, and all signs point to a potential massive breakout. If you're looking for your next big trade, this could be it!
Here's the must-know breakdown:
Top Levels to Watch:
🔹Buy Zone: $5.50–$4 (perfect accumulation area in the bull market)
🔹 Critical Support: $4 (below this, it’s bearish territory)
🔹 Breakout Point: $7 (above this, expect fireworks 🚀).
Pro Insi
TLong
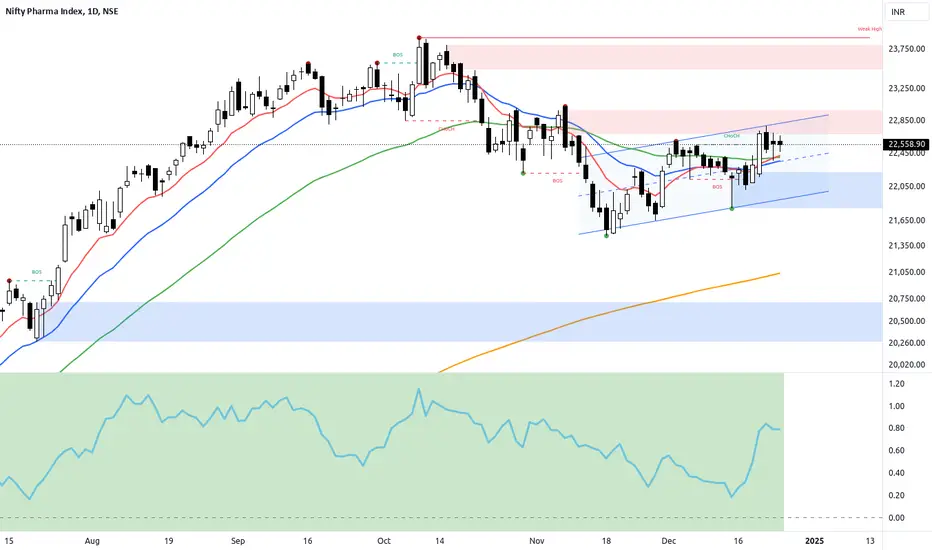
CNXPHARMA: Pharma Index Showing Strength
#CNXPHARMA
The Pharma Index is demonstrating robust strength compared to other indices in recent sessions. Key observations include:
Bullish Momentum: The chart reflects strong bullish candles over the past few days, indicating growing buying interest.
Trend Confirmation: The index is forming a consistent pattern of Higher Highs (HH) and Higher Lows (HL), a classic sign of an uptrend.
EMA Support: All critical Exponential Moving Averages (EMAs) are providing strong support, and the pri
BULLISH SHARKAs Harmonic Analyst, I have identified Potential Reversal Zone One (PRZ1) at 647.15 and Potential Reversal Zone Two (PRZ2) at 655.40 on Weekly Time Frame.
Observe Terminal Bar strength and Proceed.
Look for Type 1 Reversal Target as 850 Before Price comes back retesting to Initial Reversal Zone.
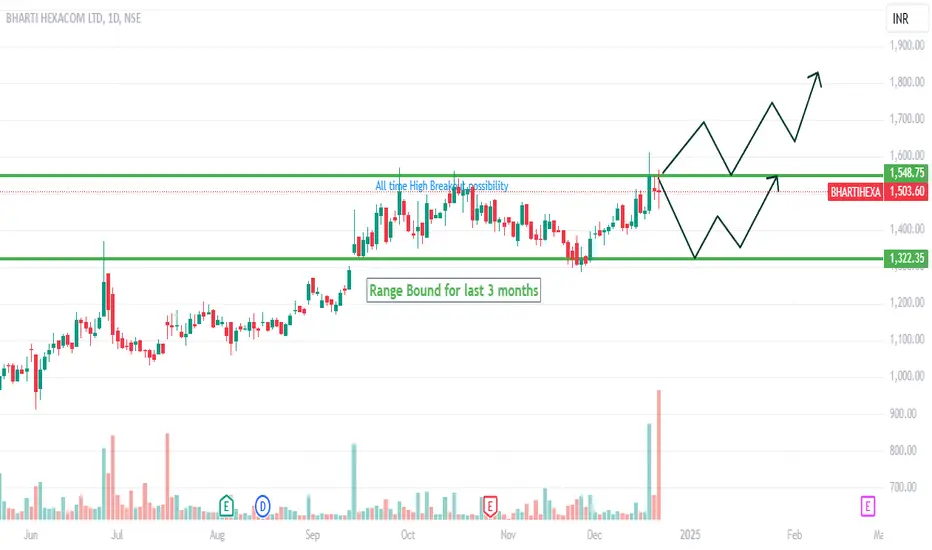
Range bound breakout in Bharti HexaNSE:BHARTIHEXA
A range-bound ATH breakout is about to happen in the daily time frame. There can be 2 possibilities for the breakout:-
It will straightway go for the breakout with some retracement
It can touch its previous support of 1300 & then bounce back to try for the next time.
Buy only after a strong confirmation with a strong bullish candle with a smaller wick between the range 1560-1580
Tgt for at least 200 points within 3-5 months.
Put a stop loss of recent swing or calculate the bas
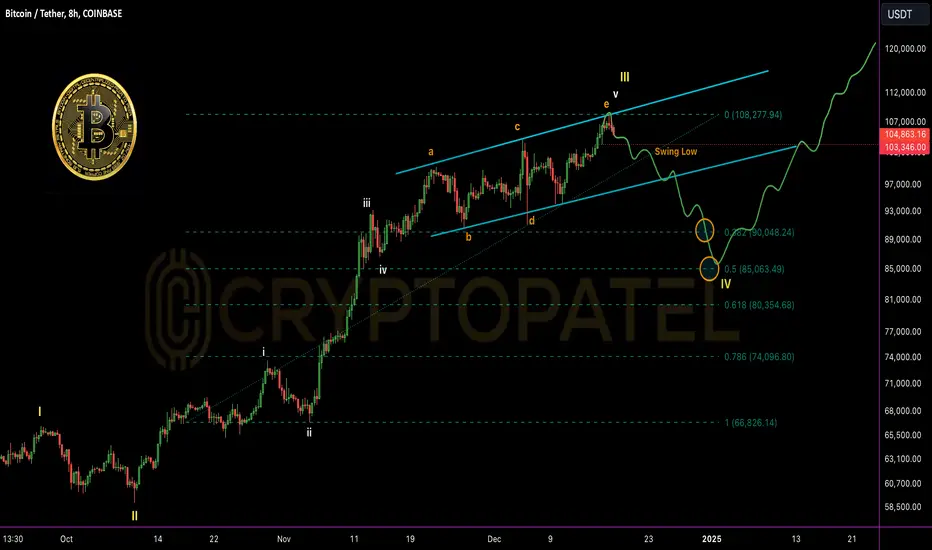
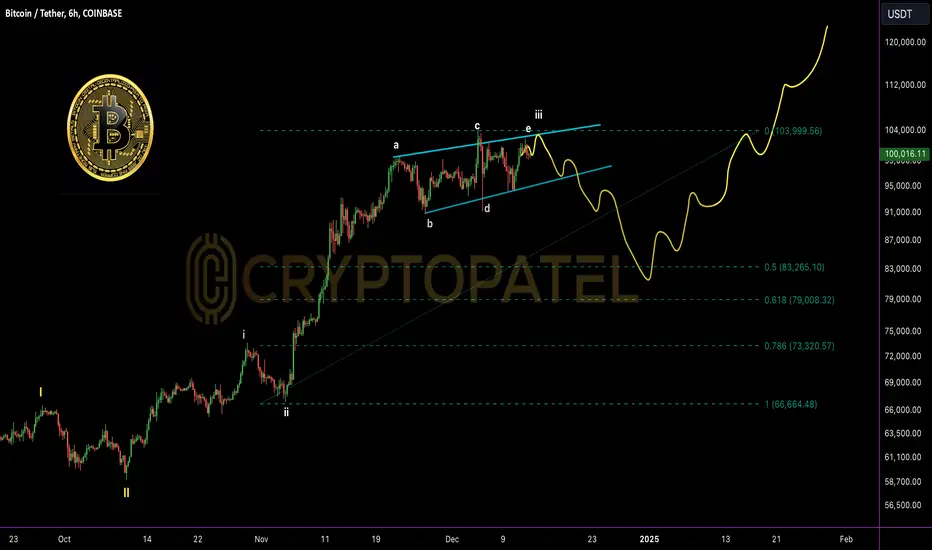
Bitcoin Elliott Wave Breakdown: Sharp Drop Ahead?Bitcoin Elliott Wave Breakdown: Sharp Drop Ahead?
Elliott Wave Insights: #Bitcoin may be forming an Expanding Diagonal (ED) in Wave 3, signaling potential retracement. Wave 2's shallow nature raises caution for long positions.
Scalp Short Setup:
⚫️ Entry: $106k–$108k
⚫️ Targets:
◾️ 0.382 FIB: $90,048
◾️ 0.5 FIB: $85,063
⚫️ Stop-Loss: 4H close above recent ATH.
⚠️ Risk Management: Use tight stops; avoid high leverage. Bullish momentum persists.
Plan: Waiting for clearer corrections to enter l
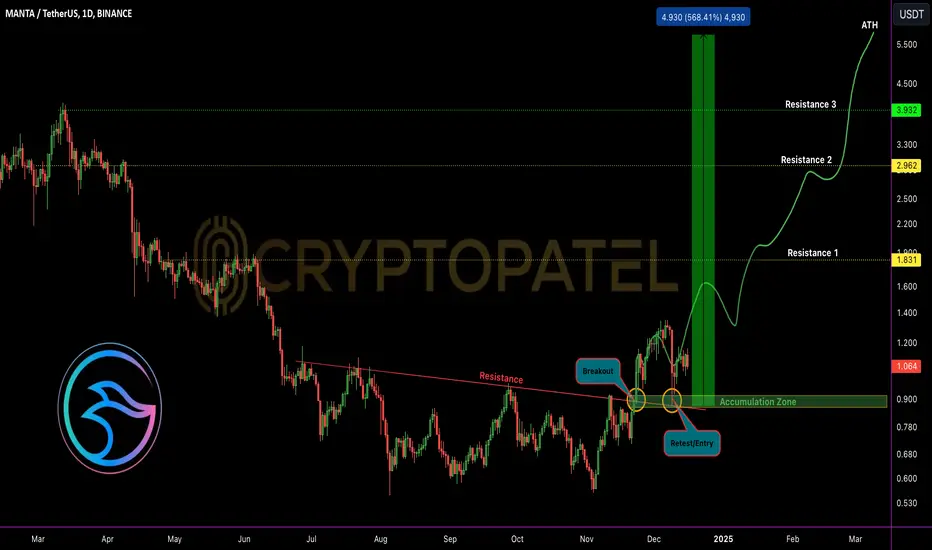
$MANTA Breakout Alert: Perfect Retest Signals Big Gains Ahead OMXHEX:MANTA Breakout Alert: Perfect Retest Signals Big Gains Ahead 🚀
Perfect dip entry executed below $1.
After breaking above $0.91, the price retested the $0.90 level—a strong bullish confirmation.
➡️ Entry Zone: $0.85–$0.95 ✅
➡️ Targets: $2 / $5 / $10 🔜
The retest at $0.90 signals strength, aligning with technical breakout patterns.
Of Course NFA 🕺
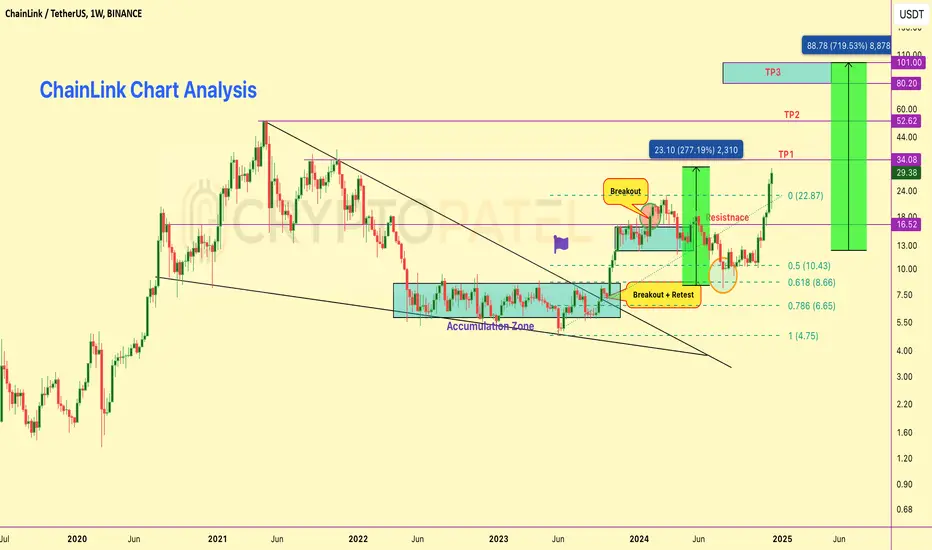
LINK/USDT 3x up from our entryLINK/USDT Update: Massive Gains Delivered 🚀
🔹 Entry Zone: $14–$10 ✅
🔹 Current Price: $30.50 (3x from our lower entry )
Chainlink ( CRYPTOCAP:LINK ) has surpassed an $18.5B market cap and hit $30 for the first time since 2021. With its strong utility and growing partnerships, CRYPTOCAP:LINK continues to show incredible potential.
Key Levels to Watch:
▪️ Resistance: $34, $52
▪️ Target: With further adoption, CRYPTOCAP:LINK could potentially reach $100 in this bull run.
Pro Tip: Always book
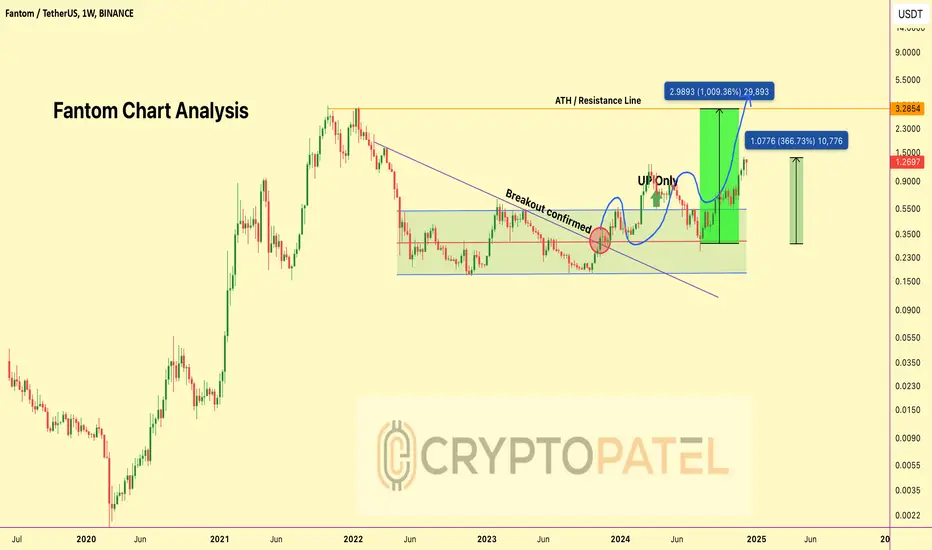
FTM Now 5x up from our Entry so What Next?#Fantom Update: 5x Gains & Bull Market Potential 🚀
🔹 Entry: $0.30 - $0.25 ✅
🔹 CMP: $1.27 (peaked at $1.39)
🔹 Gain So Far: ~5x
🔹 Target Price: $5 (Expecting strong potential in the current bull market!)
Key Strategy:
🔹 Partially Book Profits: Always remember to take some profits along the way. This ensures you’ll never regret it if the market shifts suddenly.
🔹 Ride the Remaining Profits: Let the rest of your holdings ride toward higher targets, capitalizing on the full potential of the bull ma
FLong
Cautious on Bitcoin: Expecting a Sharp Pullback Before LongCautious on Bitcoin: Expecting a Sharp Pullback Before Long
1⃣ Current Stance: Cautious on long positions in CRYPTOCAP:BTC due to the shallow nature of Wave 2 and the potential for an expanding diagonal (ED) formation.
2⃣ Entry Plan: Planning to open a long position in #Bitcoin but waiting for a clearer correction.
3⃣ Market Expectation: Expecting a sharp pullback, though the exact dip is uncertain at this stage.
4⃣ Next Steps: Will provide further updates after additional confirmations ar
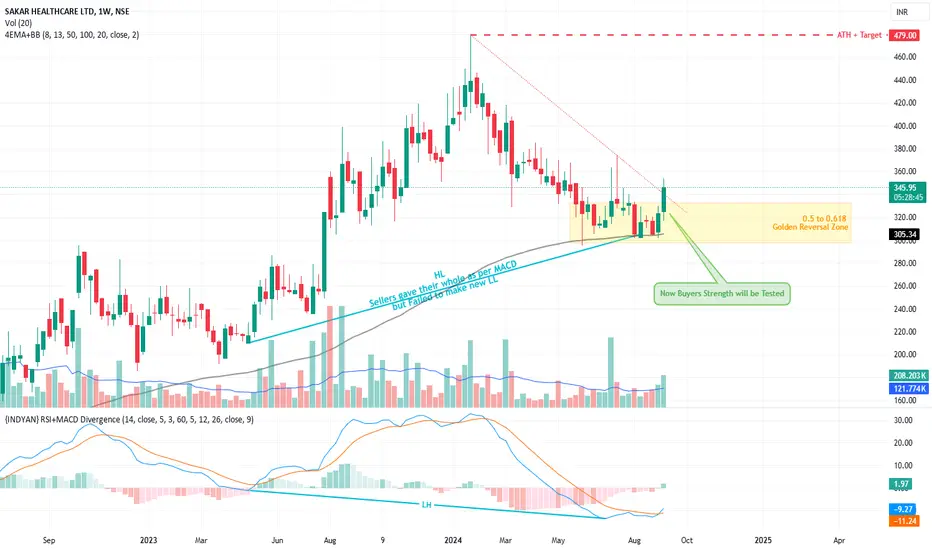
SAKAR HEALTHCARE By KRS Charts13th September 2024 / 9:49 AM
Why SAKAR❓
1. First sign that attract me was SAKAR is in Bullish Trend making HHs and HLs since listed. ⬆️
2. SAKAR is currently reacted to be bullish again from 100 EMA support in 1W TF. also in 1D TF 100 EMA is Just Underneath 👌
3. Fortunately, it reacted to be bullish within that 0.5 to 0.618 fibbo zone. ⚡
4. Bullish Continues Divergence is also supporting SAKAR to be bullish. ✅
SL is Flexible, in 1W TF until closing below 100EMA line.
Target
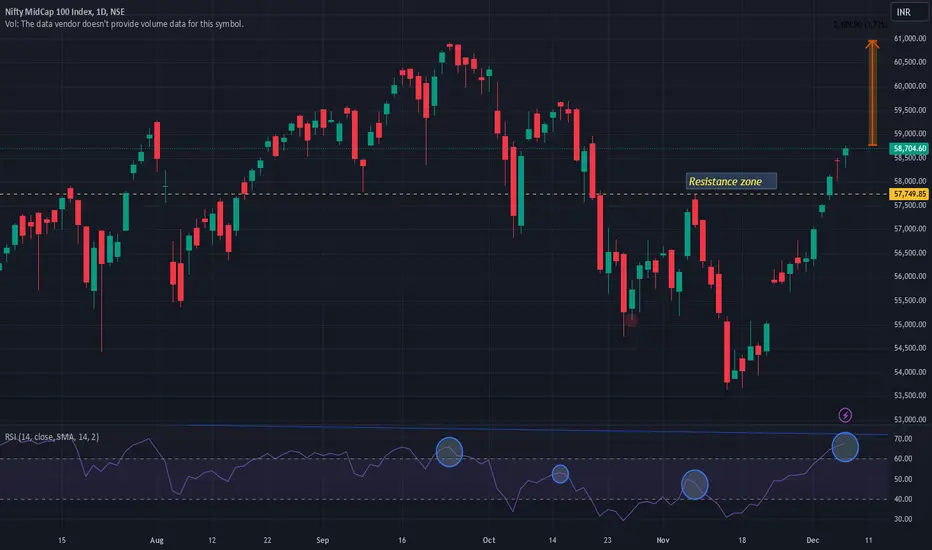
MIDCAP100I see MIDACAP100 index very strong. In my opinion it is heading towards previous high.
1. Crossed previous top
2. RSI also showing positive compared to previous high RSI. Infact its above all high since July.
3. FII turning towards buy though in small numbers.
4. Taken a strong support nr 200 DMA
My view might be changed if it closes below 57600.
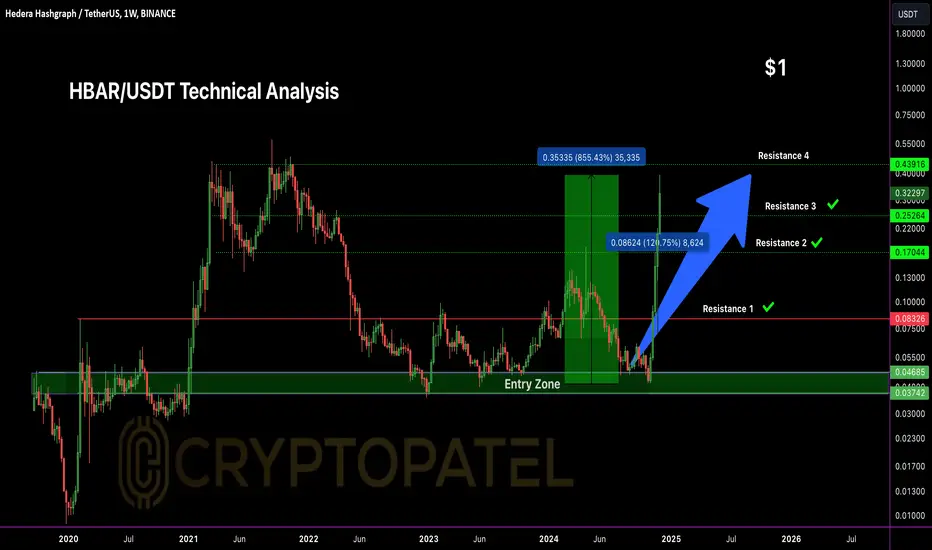
HBAR/USDT now 855% up From our Entry HBAR/USDT Huge Profit Update 🚀
Big congratulations to everyone who followed Cryptopatel's CRYPTOCAP:HBAR analysis! 🎉
➡️ HBAR/USDT is now up 855% from our entry point!
➡️ Entry: $0.037 - $0.040
✅ Target 1: $0.083
✅ Target 2: $0.170
✅ Target 3: $0.252
✅ Target 4: $0.44 (almost reached!)
Now’s a good time to take 80% profit at this level.
If you started with $1000, it’s now worth $8500.
Let’s keep the momentum going. 🚀
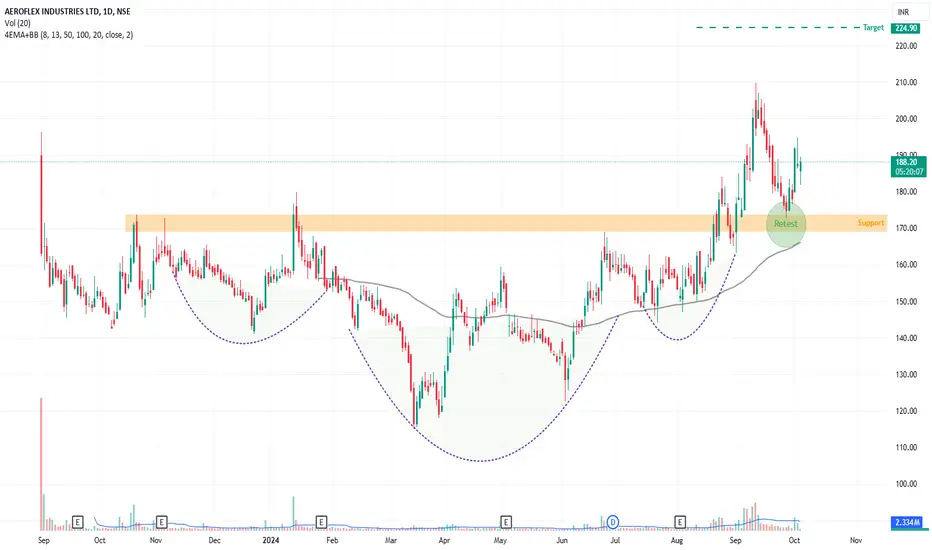
Aeroflex Industries by KRS Charts4th Oct 2024 / 10:02 AM
Why AEROFLEX ❓
1. Clear Pattern of Reversal to Bullish, Inverted Head & Shoulder❗❗👍
2. Many has Jumped in Breakout due to high calls were given for AEROFLEX but once in Retest ,i think it's right time to enter with more conviction.
3. In smaller TF, 100 EMA is right underneath so multi-TF support ✅↗️
Target would be of ~224 Rs with SL closing below Support as we can see in Chart 📈
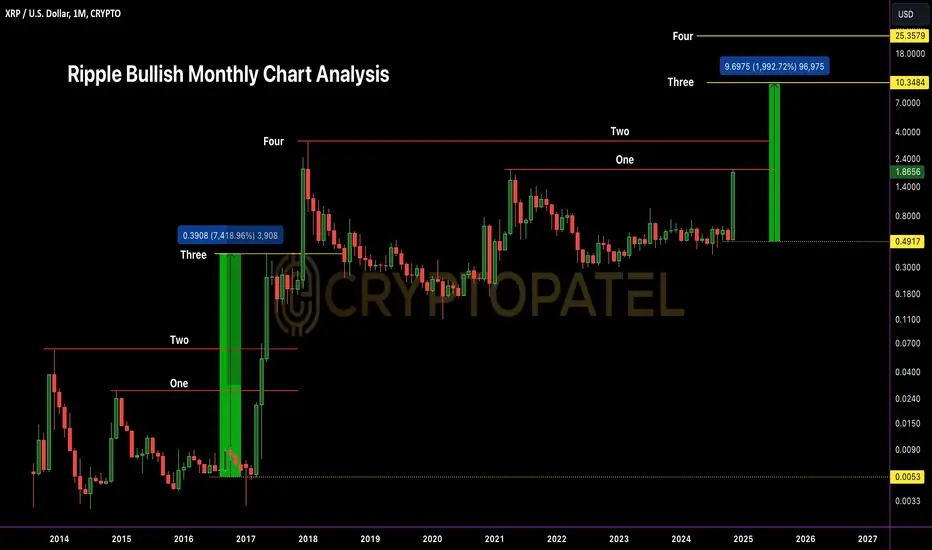
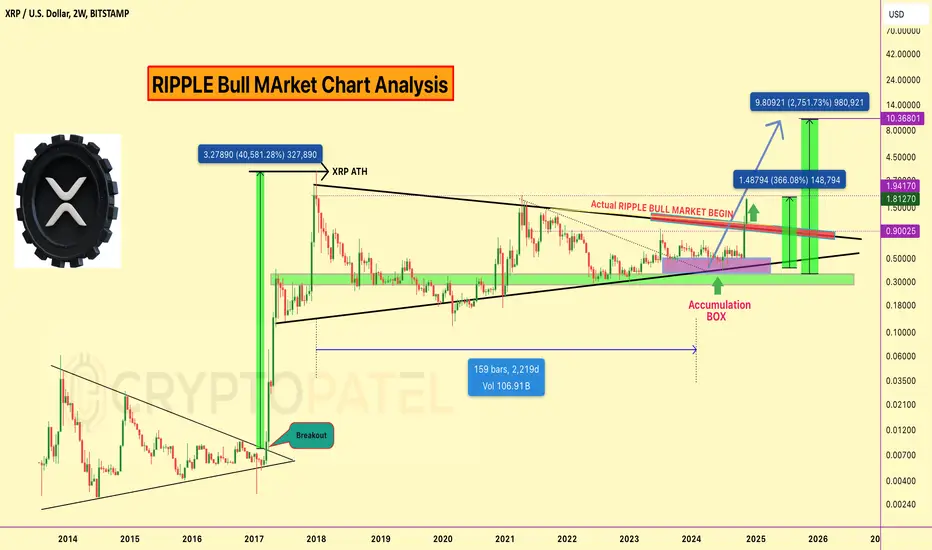
XRP/USDT $10 Potential In bull market🔥 CRYPTOCAP:XRP Monthly Chart Analysis 🔥
Looking at the #XRP monthly chart reminds me of the legendary 2017 Ripple bull run 🚀
🔰 Back then:
🔹 3 massive monthly candles with high volume printed a staggering 7400% gain in just 3 months.
🔰 Now:
🔹 We’ve already seen the 1st big monthly candle with high volume.
🔹 If history repeats, we could see 2 more massive monthly candles soon.
🔰 Potential Targets:
🔹 By the end of January or early December, XRP could hit $5+!
🔹 $10 is a riskier target, but i
XRP/USDT 366% up from our Entry so Book profit ?XRP Up 366% 🚀
I told you to buy at $0.40-$0.50 and ignore the negative news and drama (thanks, Gary Gensler). Hope you held strong because now you're in huge profits.
❤️ $2 is just around the corner.
What’s Next?
▪️ I’m expecting $3-$5 in this bull run for XRP.
▪️ Don’t repeat last bull run’s mistake: Holding blindly and not selling when it’s time.
My Suggestion:
▪️ Take out your initial investment and hold the rest as profit.
▪️ While $10 is possible, it’s unlikely this bull market.
Smart
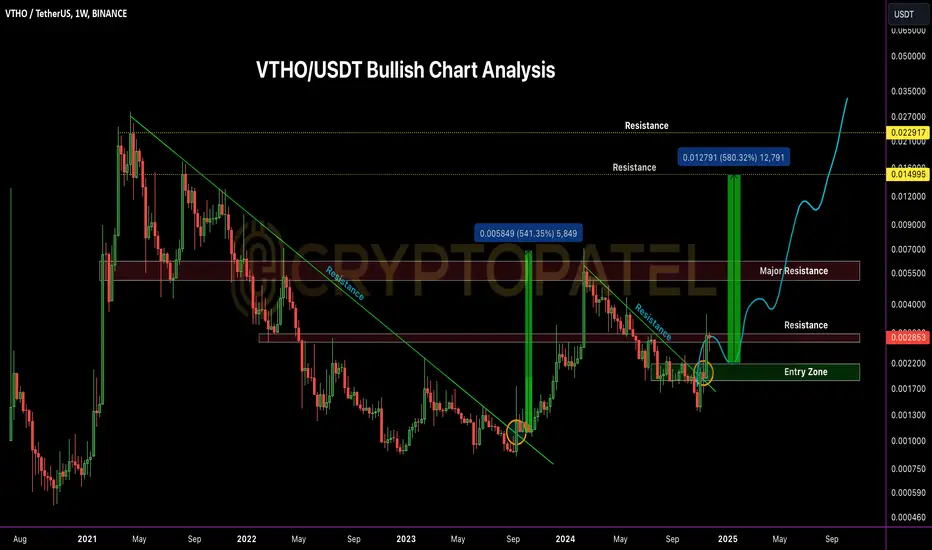
VTHO/USDT Ready for Takeoff? Breakout Signals 500%+ Potential UpVTHO/USDT Ready for Takeoff? Breakout Signals 500%+ Potential Upside
Key Highlights:
1️⃣ Trendline Breakout:
The price has broken the descending trendline, indicating a potential shift from bearish to bullish momentum.
2️⃣ Entry Zone:
Ideal entry area: $0.0017 - $0.0022 (Green Zone on the chart).
This zone offers a low-risk opportunity for long-term positions.
3️⃣ Resistance/Targets: $0.0040/$0.0058/$0.015/$0.022/ATH
Technical Observations:
▪️ The historical downtrend has been broken, suggesti